

Key Insights
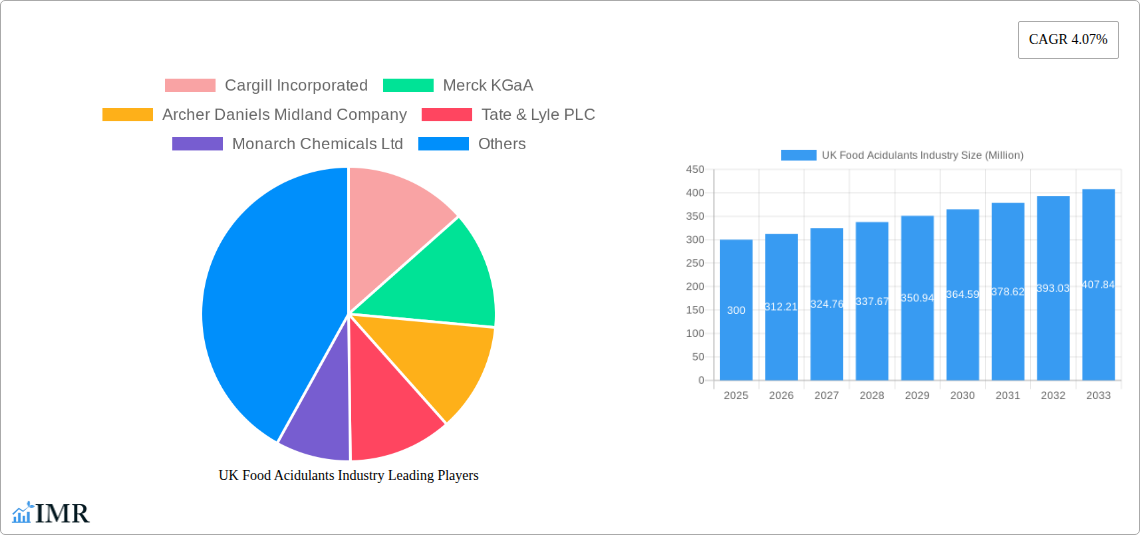
The UK food acidulants market, valued at approximately £300 million in 2025, is projected to experience steady growth, exhibiting a compound annual growth rate (CAGR) of 4.07% from 2025 to 2033. This growth is fueled by several key factors. The increasing demand for processed foods, particularly within the bakery, confectionery, and beverage sectors, significantly contributes to the market's expansion. Consumers' preference for longer shelf-life products and the need for enhanced flavor profiles drive the incorporation of acidulants in various food applications. Furthermore, the rising popularity of healthier food options is indirectly boosting demand, as some acidulants contribute to improved nutritional value or act as natural preservatives. However, the market faces certain challenges, including fluctuating raw material prices and growing consumer awareness regarding the potential health impacts of certain food additives. This necessitates the industry's focus on sustainable sourcing and the development of natural or minimally processed alternatives. The market segmentation reveals a strong demand for citric acid, driven by its versatility and widespread use across applications. Major players like Cargill Incorporated, Merck KGaA, and Archer Daniels Midland Company are strategically positioning themselves to capitalize on these market trends through innovation and expansion.
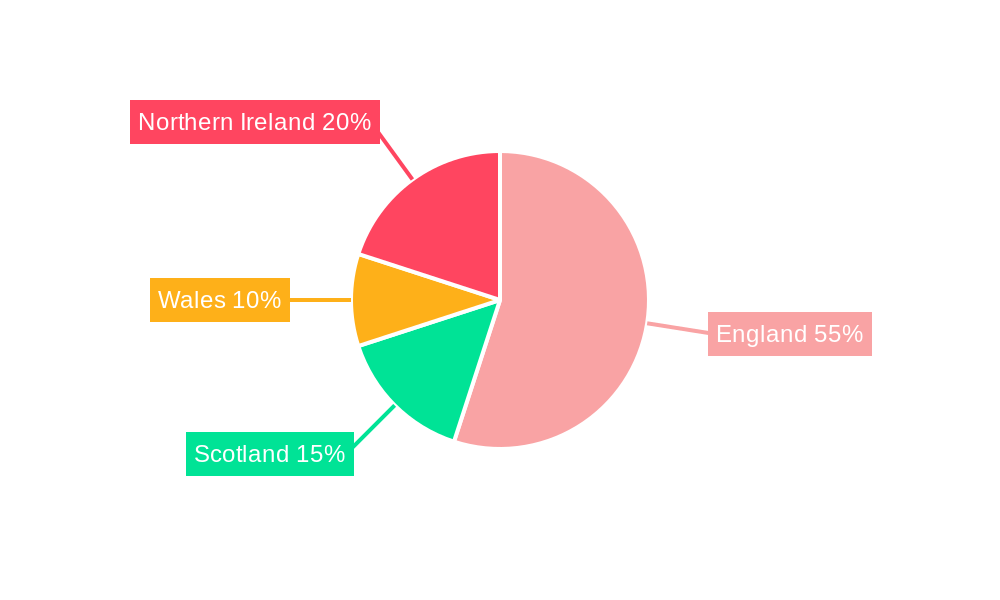
The regional breakdown within the UK shows consistent demand across England, Wales, Scotland, and Northern Ireland, with England likely holding the largest market share due to its higher population density and concentration of food processing industries. The forecast period (2025-2033) anticipates continued growth driven by evolving consumer preferences, technological advancements in food processing, and the increasing focus on food safety and preservation. The market's future trajectory will depend on effective adaptation to regulatory changes, innovative product development, and successful navigation of economic fluctuations. The competitive landscape is characterized by both large multinational corporations and specialized chemical suppliers, each pursuing strategies to capture market share within specific segments and geographical locations.
UK Food Acidulants Industry Market Report: 2019-2033
This comprehensive report provides an in-depth analysis of the UK food acidulants market, offering invaluable insights for industry professionals, investors, and strategic decision-makers. Covering the period 2019-2033, with a focus on 2025, this report dissects market dynamics, growth trends, key players, and future opportunities within the UK food and beverage landscape. The report analyzes both parent markets (food and beverage processing) and child markets (specific food applications) to deliver a granular understanding of this vital sector. Market values are presented in million units.
UK Food Acidulants Industry Market Dynamics & Structure
The UK food acidulants market exhibits a moderately concentrated structure, with key players like Cargill Incorporated, Merck KGaA, Archer Daniels Midland Company, and Tate & Lyle PLC holding significant market share. Technological innovation, particularly in sustainable and efficient production methods, is a primary growth driver. Stringent regulatory frameworks concerning food safety and labeling influence market practices. Competitive pressure from substitute ingredients necessitates continuous product innovation. The market also witnesses periodic mergers and acquisitions (M&A) activity, with deal volumes averaging xx in the historical period (2019-2024), driven by the desire for market consolidation and expansion into new segments.
- Market Concentration: Moderately concentrated, with top 5 players holding xx% market share in 2025.
- Technological Innovation: Focus on sustainable production, improved efficiency, and novel acidulant formulations.
- Regulatory Framework: Stringent food safety and labeling regulations impacting product development and marketing.
- Competitive Substitutes: Pressure from natural alternatives and other functional ingredients.
- M&A Activity: Average of xx M&A deals annually during 2019-2024, indicating consolidation trends.
- End-User Demographics: Growing demand from health-conscious consumers influences product preferences.
UK Food Acidulants Industry Growth Trends & Insights
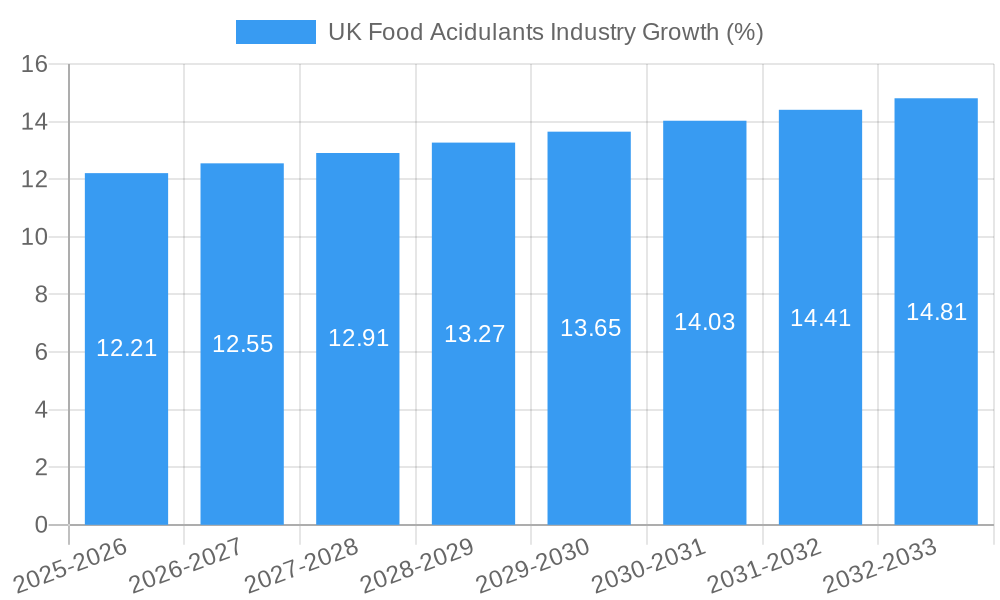
The UK food acidulants market has experienced steady growth throughout the historical period (2019-2024), driven by increasing demand across various food applications. The market size reached £xx million in 2024, exhibiting a CAGR of xx% during 2019-2024. This growth is attributed to factors such as rising consumer preference for processed foods, expansion of the food and beverage industry, and the increasing adoption of acidulants for functional properties like preservation and flavor enhancement. Technological advancements in production processes have also facilitated cost efficiencies, further driving market expansion. Consumer preference shifts toward healthier options are driving demand for natural acidulants, which represent a significant growth opportunity. Market penetration of natural acidulants is estimated at xx% in 2025, with expectations for further growth.
Dominant Regions, Countries, or Segments in UK Food Acidulants Industry
The dominant segment within the UK food acidulants market is citric acid, largely driven by its widespread use in beverages. Among applications, the beverages segment represents the largest market share, followed by dairy and frozen products. London and other major metropolitan areas demonstrate higher consumption due to greater population density and higher food processing activities. Key drivers in specific segments include:
- Citric Acid: High demand from the beverage industry.
- Beverages: Significant volume usage, driven by carbonated drinks and fruit juices.
- Dairy & Frozen Products: Use as a preservative and acidity regulator.
- Bakery: Used as a leavening agent and flavor enhancer.
- Geographical Dominance: London and other major cities represent the strongest market segments.
UK Food Acidulants Industry Product Landscape
The UK food acidulants market offers a diverse range of products, including citric acid, phosphoric acid, lactic acid, and other types, each with specific applications and performance characteristics. Recent innovations focus on the development of natural and organic acidulants to cater to the growing health-conscious consumer base. Manufacturers are emphasizing the functional benefits of their products, such as extended shelf life, improved texture, and enhanced flavor profiles.
Key Drivers, Barriers & Challenges in UK Food Acidulants Industry
Key Drivers: Growing demand from the food and beverage sector, increasing consumer preference for processed foods, and technological advancements leading to cost-effective production.
Key Barriers & Challenges: Fluctuations in raw material prices, stringent regulatory requirements, intense competition from substitute ingredients, and potential supply chain disruptions impacting overall market growth.
Emerging Opportunities in UK Food Acidulants Industry
The UK food acidulants market presents several exciting emerging opportunities, including the increasing demand for clean-label products, growing popularity of functional foods, and the rise of the plant-based food market. The exploration of novel applications in areas such as dietary supplements and health foods also holds considerable potential for market expansion.
Growth Accelerators in the UK Food Acidulants Industry
Strategic partnerships between acidulant manufacturers and food processors, coupled with technological breakthroughs leading to improved production efficiency and product innovation, are crucial for the long-term growth of the UK food acidulants market. Investments in research and development and successful market expansion strategies will prove pivotal.
Key Players Shaping the UK Food Acidulants Industry Market
- Cargill Incorporated
- Merck KGaA
- Archer Daniels Midland Company
- Tate & Lyle PLC
- Monarch Chemicals Ltd
- Brenntag AG
- H Plus Limited
- List Not Exhaustive
Notable Milestones in UK Food Acidulants Industry Sector
- 2021: Launch of a new, sustainably sourced citric acid by Cargill Incorporated.
- 2022: Acquisition of a smaller acidulant producer by Tate & Lyle PLC.
- 2023: Introduction of a novel lactic acid formulation by Merck KGaA focusing on improved texture in dairy products.
- Further milestones to be added based on available data
In-Depth UK Food Acidulants Industry Market Outlook
The UK food acidulants market is poised for sustained growth throughout the forecast period (2025-2033), driven by ongoing consumer demand and technological advancements. Strategic opportunities for market participants include focusing on sustainable and natural acidulants, expanding into niche applications, and forging partnerships to secure access to raw materials and distribution channels. The market's long-term potential rests on adapting to evolving consumer preferences and navigating the regulatory landscape effectively.
UK Food Acidulants Industry Segmentation
-
1. Type
- 1.1. Citric Acid
- 1.2. Phosphoric Acid
- 1.3. Lactic Acid
- 1.4. Other Types
-
2. Application
- 2.1. Beverages
- 2.2. Dairy and Frozen Products
- 2.3. Bakery
- 2.4. Meat Industry
- 2.5. Confectionery
- 2.6. Other Applications
UK Food Acidulants Industry Segmentation By Geography
-
1. North America
- 1.1. United States
- 1.2. Canada
- 1.3. Mexico
-
2. South America
- 2.1. Brazil
- 2.2. Argentina
- 2.3. Rest of South America
-
3. Europe
- 3.1. United Kingdom
- 3.2. Germany
- 3.3. France
- 3.4. Italy
- 3.5. Spain
- 3.6. Russia
- 3.7. Benelux
- 3.8. Nordics
- 3.9. Rest of Europe
-
4. Middle East & Africa
- 4.1. Turkey
- 4.2. Israel
- 4.3. GCC
- 4.4. North Africa
- 4.5. South Africa
- 4.6. Rest of Middle East & Africa
-
5. Asia Pacific
- 5.1. China
- 5.2. India
- 5.3. Japan
- 5.4. South Korea
- 5.5. ASEAN
- 5.6. Oceania
- 5.7. Rest of Asia Pacific
UK Food Acidulants Industry REPORT HIGHLIGHTS
| Aspects | Details |
|---|---|
| Study Period | 2019-2033 |
| Base Year | 2024 |
| Estimated Year | 2025 |
| Forecast Period | 2025-2033 |
| Historical Period | 2019-2024 |
| Growth Rate | CAGR of 4.07% from 2019-2033 |
| Segmentation |
|
Table of Contents
- 1. Introduction
- 1.1. Research Scope
- 1.2. Market Segmentation
- 1.3. Research Methodology
- 1.4. Definitions and Assumptions
- 2. Executive Summary
- 2.1. Introduction
- 3. Market Dynamics
- 3.1. Introduction
- 3.2. Market Drivers
- 3.2.1. Rising Application in Dietary Supplements
- 3.3. Market Restrains
- 3.3.1. Increasing prevalence of hydroglycemia
- 3.4. Market Trends
- 3.4.1. Phosphoric Acid Promises Growth in Future
- 4. Market Factor Analysis
- 4.1. Porters Five Forces
- 4.2. Supply/Value Chain
- 4.3. PESTEL analysis
- 4.4. Market Entropy
- 4.5. Patent/Trademark Analysis
- 5. Global UK Food Acidulants Industry Analysis, Insights and Forecast, 2019-2031
- 5.1. Market Analysis, Insights and Forecast - by Type
- 5.1.1. Citric Acid
- 5.1.2. Phosphoric Acid
- 5.1.3. Lactic Acid
- 5.1.4. Other Types
- 5.2. Market Analysis, Insights and Forecast - by Application
- 5.2.1. Beverages
- 5.2.2. Dairy and Frozen Products
- 5.2.3. Bakery
- 5.2.4. Meat Industry
- 5.2.5. Confectionery
- 5.2.6. Other Applications
- 5.3. Market Analysis, Insights and Forecast - by Region
- 5.3.1. North America
- 5.3.2. South America
- 5.3.3. Europe
- 5.3.4. Middle East & Africa
- 5.3.5. Asia Pacific
- 5.1. Market Analysis, Insights and Forecast - by Type
- 6. North America UK Food Acidulants Industry Analysis, Insights and Forecast, 2019-2031
- 6.1. Market Analysis, Insights and Forecast - by Type
- 6.1.1. Citric Acid
- 6.1.2. Phosphoric Acid
- 6.1.3. Lactic Acid
- 6.1.4. Other Types
- 6.2. Market Analysis, Insights and Forecast - by Application
- 6.2.1. Beverages
- 6.2.2. Dairy and Frozen Products
- 6.2.3. Bakery
- 6.2.4. Meat Industry
- 6.2.5. Confectionery
- 6.2.6. Other Applications
- 6.1. Market Analysis, Insights and Forecast - by Type
- 7. South America UK Food Acidulants Industry Analysis, Insights and Forecast, 2019-2031
- 7.1. Market Analysis, Insights and Forecast - by Type
- 7.1.1. Citric Acid
- 7.1.2. Phosphoric Acid
- 7.1.3. Lactic Acid
- 7.1.4. Other Types
- 7.2. Market Analysis, Insights and Forecast - by Application
- 7.2.1. Beverages
- 7.2.2. Dairy and Frozen Products
- 7.2.3. Bakery
- 7.2.4. Meat Industry
- 7.2.5. Confectionery
- 7.2.6. Other Applications
- 7.1. Market Analysis, Insights and Forecast - by Type
- 8. Europe UK Food Acidulants Industry Analysis, Insights and Forecast, 2019-2031
- 8.1. Market Analysis, Insights and Forecast - by Type
- 8.1.1. Citric Acid
- 8.1.2. Phosphoric Acid
- 8.1.3. Lactic Acid
- 8.1.4. Other Types
- 8.2. Market Analysis, Insights and Forecast - by Application
- 8.2.1. Beverages
- 8.2.2. Dairy and Frozen Products
- 8.2.3. Bakery
- 8.2.4. Meat Industry
- 8.2.5. Confectionery
- 8.2.6. Other Applications
- 8.1. Market Analysis, Insights and Forecast - by Type
- 9. Middle East & Africa UK Food Acidulants Industry Analysis, Insights and Forecast, 2019-2031
- 9.1. Market Analysis, Insights and Forecast - by Type
- 9.1.1. Citric Acid
- 9.1.2. Phosphoric Acid
- 9.1.3. Lactic Acid
- 9.1.4. Other Types
- 9.2. Market Analysis, Insights and Forecast - by Application
- 9.2.1. Beverages
- 9.2.2. Dairy and Frozen Products
- 9.2.3. Bakery
- 9.2.4. Meat Industry
- 9.2.5. Confectionery
- 9.2.6. Other Applications
- 9.1. Market Analysis, Insights and Forecast - by Type
- 10. Asia Pacific UK Food Acidulants Industry Analysis, Insights and Forecast, 2019-2031
- 10.1. Market Analysis, Insights and Forecast - by Type
- 10.1.1. Citric Acid
- 10.1.2. Phosphoric Acid
- 10.1.3. Lactic Acid
- 10.1.4. Other Types
- 10.2. Market Analysis, Insights and Forecast - by Application
- 10.2.1. Beverages
- 10.2.2. Dairy and Frozen Products
- 10.2.3. Bakery
- 10.2.4. Meat Industry
- 10.2.5. Confectionery
- 10.2.6. Other Applications
- 10.1. Market Analysis, Insights and Forecast - by Type
- 11. England UK Food Acidulants Industry Analysis, Insights and Forecast, 2019-2031
- 12. Wales UK Food Acidulants Industry Analysis, Insights and Forecast, 2019-2031
- 13. Scotland UK Food Acidulants Industry Analysis, Insights and Forecast, 2019-2031
- 14. Northern UK Food Acidulants Industry Analysis, Insights and Forecast, 2019-2031
- 15. Ireland UK Food Acidulants Industry Analysis, Insights and Forecast, 2019-2031
- 16. Competitive Analysis
- 16.1. Global Market Share Analysis 2024
- 16.2. Company Profiles
- 16.2.1 Cargill Incorporated
- 16.2.1.1. Overview
- 16.2.1.2. Products
- 16.2.1.3. SWOT Analysis
- 16.2.1.4. Recent Developments
- 16.2.1.5. Financials (Based on Availability)
- 16.2.2 Merck KGaA
- 16.2.2.1. Overview
- 16.2.2.2. Products
- 16.2.2.3. SWOT Analysis
- 16.2.2.4. Recent Developments
- 16.2.2.5. Financials (Based on Availability)
- 16.2.3 Archer Daniels Midland Company
- 16.2.3.1. Overview
- 16.2.3.2. Products
- 16.2.3.3. SWOT Analysis
- 16.2.3.4. Recent Developments
- 16.2.3.5. Financials (Based on Availability)
- 16.2.4 Tate & Lyle PLC
- 16.2.4.1. Overview
- 16.2.4.2. Products
- 16.2.4.3. SWOT Analysis
- 16.2.4.4. Recent Developments
- 16.2.4.5. Financials (Based on Availability)
- 16.2.5 Monarch Chemicals Ltd
- 16.2.5.1. Overview
- 16.2.5.2. Products
- 16.2.5.3. SWOT Analysis
- 16.2.5.4. Recent Developments
- 16.2.5.5. Financials (Based on Availability)
- 16.2.6 Brenntag AG
- 16.2.6.1. Overview
- 16.2.6.2. Products
- 16.2.6.3. SWOT Analysis
- 16.2.6.4. Recent Developments
- 16.2.6.5. Financials (Based on Availability)
- 16.2.7 H Plus Limited*List Not Exhaustive
- 16.2.7.1. Overview
- 16.2.7.2. Products
- 16.2.7.3. SWOT Analysis
- 16.2.7.4. Recent Developments
- 16.2.7.5. Financials (Based on Availability)
- 16.2.1 Cargill Incorporated
List of Figures
- Figure 1: Global UK Food Acidulants Industry Revenue Breakdown (Million, %) by Region 2024 & 2032
- Figure 2: Global UK Food Acidulants Industry Volume Breakdown (K Tons, %) by Region 2024 & 2032
- Figure 3: United kingdom Region UK Food Acidulants Industry Revenue (Million), by Country 2024 & 2032
- Figure 4: United kingdom Region UK Food Acidulants Industry Volume (K Tons), by Country 2024 & 2032
- Figure 5: United kingdom Region UK Food Acidulants Industry Revenue Share (%), by Country 2024 & 2032
- Figure 6: United kingdom Region UK Food Acidulants Industry Volume Share (%), by Country 2024 & 2032
- Figure 7: North America UK Food Acidulants Industry Revenue (Million), by Type 2024 & 2032
- Figure 8: North America UK Food Acidulants Industry Volume (K Tons), by Type 2024 & 2032
- Figure 9: North America UK Food Acidulants Industry Revenue Share (%), by Type 2024 & 2032
- Figure 10: North America UK Food Acidulants Industry Volume Share (%), by Type 2024 & 2032
- Figure 11: North America UK Food Acidulants Industry Revenue (Million), by Application 2024 & 2032
- Figure 12: North America UK Food Acidulants Industry Volume (K Tons), by Application 2024 & 2032
- Figure 13: North America UK Food Acidulants Industry Revenue Share (%), by Application 2024 & 2032
- Figure 14: North America UK Food Acidulants Industry Volume Share (%), by Application 2024 & 2032
- Figure 15: North America UK Food Acidulants Industry Revenue (Million), by Country 2024 & 2032
- Figure 16: North America UK Food Acidulants Industry Volume (K Tons), by Country 2024 & 2032
- Figure 17: North America UK Food Acidulants Industry Revenue Share (%), by Country 2024 & 2032
- Figure 18: North America UK Food Acidulants Industry Volume Share (%), by Country 2024 & 2032
- Figure 19: South America UK Food Acidulants Industry Revenue (Million), by Type 2024 & 2032
- Figure 20: South America UK Food Acidulants Industry Volume (K Tons), by Type 2024 & 2032
- Figure 21: South America UK Food Acidulants Industry Revenue Share (%), by Type 2024 & 2032
- Figure 22: South America UK Food Acidulants Industry Volume Share (%), by Type 2024 & 2032
- Figure 23: South America UK Food Acidulants Industry Revenue (Million), by Application 2024 & 2032
- Figure 24: South America UK Food Acidulants Industry Volume (K Tons), by Application 2024 & 2032
- Figure 25: South America UK Food Acidulants Industry Revenue Share (%), by Application 2024 & 2032
- Figure 26: South America UK Food Acidulants Industry Volume Share (%), by Application 2024 & 2032
- Figure 27: South America UK Food Acidulants Industry Revenue (Million), by Country 2024 & 2032
- Figure 28: South America UK Food Acidulants Industry Volume (K Tons), by Country 2024 & 2032
- Figure 29: South America UK Food Acidulants Industry Revenue Share (%), by Country 2024 & 2032
- Figure 30: South America UK Food Acidulants Industry Volume Share (%), by Country 2024 & 2032
- Figure 31: Europe UK Food Acidulants Industry Revenue (Million), by Type 2024 & 2032
- Figure 32: Europe UK Food Acidulants Industry Volume (K Tons), by Type 2024 & 2032
- Figure 33: Europe UK Food Acidulants Industry Revenue Share (%), by Type 2024 & 2032
- Figure 34: Europe UK Food Acidulants Industry Volume Share (%), by Type 2024 & 2032
- Figure 35: Europe UK Food Acidulants Industry Revenue (Million), by Application 2024 & 2032
- Figure 36: Europe UK Food Acidulants Industry Volume (K Tons), by Application 2024 & 2032
- Figure 37: Europe UK Food Acidulants Industry Revenue Share (%), by Application 2024 & 2032
- Figure 38: Europe UK Food Acidulants Industry Volume Share (%), by Application 2024 & 2032
- Figure 39: Europe UK Food Acidulants Industry Revenue (Million), by Country 2024 & 2032
- Figure 40: Europe UK Food Acidulants Industry Volume (K Tons), by Country 2024 & 2032
- Figure 41: Europe UK Food Acidulants Industry Revenue Share (%), by Country 2024 & 2032
- Figure 42: Europe UK Food Acidulants Industry Volume Share (%), by Country 2024 & 2032
- Figure 43: Middle East & Africa UK Food Acidulants Industry Revenue (Million), by Type 2024 & 2032
- Figure 44: Middle East & Africa UK Food Acidulants Industry Volume (K Tons), by Type 2024 & 2032
- Figure 45: Middle East & Africa UK Food Acidulants Industry Revenue Share (%), by Type 2024 & 2032
- Figure 46: Middle East & Africa UK Food Acidulants Industry Volume Share (%), by Type 2024 & 2032
- Figure 47: Middle East & Africa UK Food Acidulants Industry Revenue (Million), by Application 2024 & 2032
- Figure 48: Middle East & Africa UK Food Acidulants Industry Volume (K Tons), by Application 2024 & 2032
- Figure 49: Middle East & Africa UK Food Acidulants Industry Revenue Share (%), by Application 2024 & 2032
- Figure 50: Middle East & Africa UK Food Acidulants Industry Volume Share (%), by Application 2024 & 2032
- Figure 51: Middle East & Africa UK Food Acidulants Industry Revenue (Million), by Country 2024 & 2032
- Figure 52: Middle East & Africa UK Food Acidulants Industry Volume (K Tons), by Country 2024 & 2032
- Figure 53: Middle East & Africa UK Food Acidulants Industry Revenue Share (%), by Country 2024 & 2032
- Figure 54: Middle East & Africa UK Food Acidulants Industry Volume Share (%), by Country 2024 & 2032
- Figure 55: Asia Pacific UK Food Acidulants Industry Revenue (Million), by Type 2024 & 2032
- Figure 56: Asia Pacific UK Food Acidulants Industry Volume (K Tons), by Type 2024 & 2032
- Figure 57: Asia Pacific UK Food Acidulants Industry Revenue Share (%), by Type 2024 & 2032
- Figure 58: Asia Pacific UK Food Acidulants Industry Volume Share (%), by Type 2024 & 2032
- Figure 59: Asia Pacific UK Food Acidulants Industry Revenue (Million), by Application 2024 & 2032
- Figure 60: Asia Pacific UK Food Acidulants Industry Volume (K Tons), by Application 2024 & 2032
- Figure 61: Asia Pacific UK Food Acidulants Industry Revenue Share (%), by Application 2024 & 2032
- Figure 62: Asia Pacific UK Food Acidulants Industry Volume Share (%), by Application 2024 & 2032
- Figure 63: Asia Pacific UK Food Acidulants Industry Revenue (Million), by Country 2024 & 2032
- Figure 64: Asia Pacific UK Food Acidulants Industry Volume (K Tons), by Country 2024 & 2032
- Figure 65: Asia Pacific UK Food Acidulants Industry Revenue Share (%), by Country 2024 & 2032
- Figure 66: Asia Pacific UK Food Acidulants Industry Volume Share (%), by Country 2024 & 2032
List of Tables
- Table 1: Global UK Food Acidulants Industry Revenue Million Forecast, by Region 2019 & 2032
- Table 2: Global UK Food Acidulants Industry Volume K Tons Forecast, by Region 2019 & 2032
- Table 3: Global UK Food Acidulants Industry Revenue Million Forecast, by Type 2019 & 2032
- Table 4: Global UK Food Acidulants Industry Volume K Tons Forecast, by Type 2019 & 2032
- Table 5: Global UK Food Acidulants Industry Revenue Million Forecast, by Application 2019 & 2032
- Table 6: Global UK Food Acidulants Industry Volume K Tons Forecast, by Application 2019 & 2032
- Table 7: Global UK Food Acidulants Industry Revenue Million Forecast, by Region 2019 & 2032
- Table 8: Global UK Food Acidulants Industry Volume K Tons Forecast, by Region 2019 & 2032
- Table 9: Global UK Food Acidulants Industry Revenue Million Forecast, by Country 2019 & 2032
- Table 10: Global UK Food Acidulants Industry Volume K Tons Forecast, by Country 2019 & 2032
- Table 11: England UK Food Acidulants Industry Revenue (Million) Forecast, by Application 2019 & 2032
- Table 12: England UK Food Acidulants Industry Volume (K Tons) Forecast, by Application 2019 & 2032
- Table 13: Wales UK Food Acidulants Industry Revenue (Million) Forecast, by Application 2019 & 2032
- Table 14: Wales UK Food Acidulants Industry Volume (K Tons) Forecast, by Application 2019 & 2032
- Table 15: Scotland UK Food Acidulants Industry Revenue (Million) Forecast, by Application 2019 & 2032
- Table 16: Scotland UK Food Acidulants Industry Volume (K Tons) Forecast, by Application 2019 & 2032
- Table 17: Northern UK Food Acidulants Industry Revenue (Million) Forecast, by Application 2019 & 2032
- Table 18: Northern UK Food Acidulants Industry Volume (K Tons) Forecast, by Application 2019 & 2032
- Table 19: Ireland UK Food Acidulants Industry Revenue (Million) Forecast, by Application 2019 & 2032
- Table 20: Ireland UK Food Acidulants Industry Volume (K Tons) Forecast, by Application 2019 & 2032
- Table 21: Global UK Food Acidulants Industry Revenue Million Forecast, by Type 2019 & 2032
- Table 22: Global UK Food Acidulants Industry Volume K Tons Forecast, by Type 2019 & 2032
- Table 23: Global UK Food Acidulants Industry Revenue Million Forecast, by Application 2019 & 2032
- Table 24: Global UK Food Acidulants Industry Volume K Tons Forecast, by Application 2019 & 2032
- Table 25: Global UK Food Acidulants Industry Revenue Million Forecast, by Country 2019 & 2032
- Table 26: Global UK Food Acidulants Industry Volume K Tons Forecast, by Country 2019 & 2032
- Table 27: United States UK Food Acidulants Industry Revenue (Million) Forecast, by Application 2019 & 2032
- Table 28: United States UK Food Acidulants Industry Volume (K Tons) Forecast, by Application 2019 & 2032
- Table 29: Canada UK Food Acidulants Industry Revenue (Million) Forecast, by Application 2019 & 2032
- Table 30: Canada UK Food Acidulants Industry Volume (K Tons) Forecast, by Application 2019 & 2032
- Table 31: Mexico UK Food Acidulants Industry Revenue (Million) Forecast, by Application 2019 & 2032
- Table 32: Mexico UK Food Acidulants Industry Volume (K Tons) Forecast, by Application 2019 & 2032
- Table 33: Global UK Food Acidulants Industry Revenue Million Forecast, by Type 2019 & 2032
- Table 34: Global UK Food Acidulants Industry Volume K Tons Forecast, by Type 2019 & 2032
- Table 35: Global UK Food Acidulants Industry Revenue Million Forecast, by Application 2019 & 2032
- Table 36: Global UK Food Acidulants Industry Volume K Tons Forecast, by Application 2019 & 2032
- Table 37: Global UK Food Acidulants Industry Revenue Million Forecast, by Country 2019 & 2032
- Table 38: Global UK Food Acidulants Industry Volume K Tons Forecast, by Country 2019 & 2032
- Table 39: Brazil UK Food Acidulants Industry Revenue (Million) Forecast, by Application 2019 & 2032
- Table 40: Brazil UK Food Acidulants Industry Volume (K Tons) Forecast, by Application 2019 & 2032
- Table 41: Argentina UK Food Acidulants Industry Revenue (Million) Forecast, by Application 2019 & 2032
- Table 42: Argentina UK Food Acidulants Industry Volume (K Tons) Forecast, by Application 2019 & 2032
- Table 43: Rest of South America UK Food Acidulants Industry Revenue (Million) Forecast, by Application 2019 & 2032
- Table 44: Rest of South America UK Food Acidulants Industry Volume (K Tons) Forecast, by Application 2019 & 2032
- Table 45: Global UK Food Acidulants Industry Revenue Million Forecast, by Type 2019 & 2032
- Table 46: Global UK Food Acidulants Industry Volume K Tons Forecast, by Type 2019 & 2032
- Table 47: Global UK Food Acidulants Industry Revenue Million Forecast, by Application 2019 & 2032
- Table 48: Global UK Food Acidulants Industry Volume K Tons Forecast, by Application 2019 & 2032
- Table 49: Global UK Food Acidulants Industry Revenue Million Forecast, by Country 2019 & 2032
- Table 50: Global UK Food Acidulants Industry Volume K Tons Forecast, by Country 2019 & 2032
- Table 51: United Kingdom UK Food Acidulants Industry Revenue (Million) Forecast, by Application 2019 & 2032
- Table 52: United Kingdom UK Food Acidulants Industry Volume (K Tons) Forecast, by Application 2019 & 2032
- Table 53: Germany UK Food Acidulants Industry Revenue (Million) Forecast, by Application 2019 & 2032
- Table 54: Germany UK Food Acidulants Industry Volume (K Tons) Forecast, by Application 2019 & 2032
- Table 55: France UK Food Acidulants Industry Revenue (Million) Forecast, by Application 2019 & 2032
- Table 56: France UK Food Acidulants Industry Volume (K Tons) Forecast, by Application 2019 & 2032
- Table 57: Italy UK Food Acidulants Industry Revenue (Million) Forecast, by Application 2019 & 2032
- Table 58: Italy UK Food Acidulants Industry Volume (K Tons) Forecast, by Application 2019 & 2032
- Table 59: Spain UK Food Acidulants Industry Revenue (Million) Forecast, by Application 2019 & 2032
- Table 60: Spain UK Food Acidulants Industry Volume (K Tons) Forecast, by Application 2019 & 2032
- Table 61: Russia UK Food Acidulants Industry Revenue (Million) Forecast, by Application 2019 & 2032
- Table 62: Russia UK Food Acidulants Industry Volume (K Tons) Forecast, by Application 2019 & 2032
- Table 63: Benelux UK Food Acidulants Industry Revenue (Million) Forecast, by Application 2019 & 2032
- Table 64: Benelux UK Food Acidulants Industry Volume (K Tons) Forecast, by Application 2019 & 2032
- Table 65: Nordics UK Food Acidulants Industry Revenue (Million) Forecast, by Application 2019 & 2032
- Table 66: Nordics UK Food Acidulants Industry Volume (K Tons) Forecast, by Application 2019 & 2032
- Table 67: Rest of Europe UK Food Acidulants Industry Revenue (Million) Forecast, by Application 2019 & 2032
- Table 68: Rest of Europe UK Food Acidulants Industry Volume (K Tons) Forecast, by Application 2019 & 2032
- Table 69: Global UK Food Acidulants Industry Revenue Million Forecast, by Type 2019 & 2032
- Table 70: Global UK Food Acidulants Industry Volume K Tons Forecast, by Type 2019 & 2032
- Table 71: Global UK Food Acidulants Industry Revenue Million Forecast, by Application 2019 & 2032
- Table 72: Global UK Food Acidulants Industry Volume K Tons Forecast, by Application 2019 & 2032
- Table 73: Global UK Food Acidulants Industry Revenue Million Forecast, by Country 2019 & 2032
- Table 74: Global UK Food Acidulants Industry Volume K Tons Forecast, by Country 2019 & 2032
- Table 75: Turkey UK Food Acidulants Industry Revenue (Million) Forecast, by Application 2019 & 2032
- Table 76: Turkey UK Food Acidulants Industry Volume (K Tons) Forecast, by Application 2019 & 2032
- Table 77: Israel UK Food Acidulants Industry Revenue (Million) Forecast, by Application 2019 & 2032
- Table 78: Israel UK Food Acidulants Industry Volume (K Tons) Forecast, by Application 2019 & 2032
- Table 79: GCC UK Food Acidulants Industry Revenue (Million) Forecast, by Application 2019 & 2032
- Table 80: GCC UK Food Acidulants Industry Volume (K Tons) Forecast, by Application 2019 & 2032
- Table 81: North Africa UK Food Acidulants Industry Revenue (Million) Forecast, by Application 2019 & 2032
- Table 82: North Africa UK Food Acidulants Industry Volume (K Tons) Forecast, by Application 2019 & 2032
- Table 83: South Africa UK Food Acidulants Industry Revenue (Million) Forecast, by Application 2019 & 2032
- Table 84: South Africa UK Food Acidulants Industry Volume (K Tons) Forecast, by Application 2019 & 2032
- Table 85: Rest of Middle East & Africa UK Food Acidulants Industry Revenue (Million) Forecast, by Application 2019 & 2032
- Table 86: Rest of Middle East & Africa UK Food Acidulants Industry Volume (K Tons) Forecast, by Application 2019 & 2032
- Table 87: Global UK Food Acidulants Industry Revenue Million Forecast, by Type 2019 & 2032
- Table 88: Global UK Food Acidulants Industry Volume K Tons Forecast, by Type 2019 & 2032
- Table 89: Global UK Food Acidulants Industry Revenue Million Forecast, by Application 2019 & 2032
- Table 90: Global UK Food Acidulants Industry Volume K Tons Forecast, by Application 2019 & 2032
- Table 91: Global UK Food Acidulants Industry Revenue Million Forecast, by Country 2019 & 2032
- Table 92: Global UK Food Acidulants Industry Volume K Tons Forecast, by Country 2019 & 2032
- Table 93: China UK Food Acidulants Industry Revenue (Million) Forecast, by Application 2019 & 2032
- Table 94: China UK Food Acidulants Industry Volume (K Tons) Forecast, by Application 2019 & 2032
- Table 95: India UK Food Acidulants Industry Revenue (Million) Forecast, by Application 2019 & 2032
- Table 96: India UK Food Acidulants Industry Volume (K Tons) Forecast, by Application 2019 & 2032
- Table 97: Japan UK Food Acidulants Industry Revenue (Million) Forecast, by Application 2019 & 2032
- Table 98: Japan UK Food Acidulants Industry Volume (K Tons) Forecast, by Application 2019 & 2032
- Table 99: South Korea UK Food Acidulants Industry Revenue (Million) Forecast, by Application 2019 & 2032
- Table 100: South Korea UK Food Acidulants Industry Volume (K Tons) Forecast, by Application 2019 & 2032
- Table 101: ASEAN UK Food Acidulants Industry Revenue (Million) Forecast, by Application 2019 & 2032
- Table 102: ASEAN UK Food Acidulants Industry Volume (K Tons) Forecast, by Application 2019 & 2032
- Table 103: Oceania UK Food Acidulants Industry Revenue (Million) Forecast, by Application 2019 & 2032
- Table 104: Oceania UK Food Acidulants Industry Volume (K Tons) Forecast, by Application 2019 & 2032
- Table 105: Rest of Asia Pacific UK Food Acidulants Industry Revenue (Million) Forecast, by Application 2019 & 2032
- Table 106: Rest of Asia Pacific UK Food Acidulants Industry Volume (K Tons) Forecast, by Application 2019 & 2032
Frequently Asked Questions
1. What is the projected Compound Annual Growth Rate (CAGR) of the UK Food Acidulants Industry?
The projected CAGR is approximately 4.07%.
2. Which companies are prominent players in the UK Food Acidulants Industry?
Key companies in the market include Cargill Incorporated, Merck KGaA, Archer Daniels Midland Company, Tate & Lyle PLC, Monarch Chemicals Ltd, Brenntag AG, H Plus Limited*List Not Exhaustive.
3. What are the main segments of the UK Food Acidulants Industry?
The market segments include Type, Application.
4. Can you provide details about the market size?
The market size is estimated to be USD XX Million as of 2022.
5. What are some drivers contributing to market growth?
Rising Application in Dietary Supplements.
6. What are the notable trends driving market growth?
Phosphoric Acid Promises Growth in Future.
7. Are there any restraints impacting market growth?
Increasing prevalence of hydroglycemia.
8. Can you provide examples of recent developments in the market?
N/A
9. What pricing options are available for accessing the report?
Pricing options include single-user, multi-user, and enterprise licenses priced at USD 3800, USD 4500, and USD 5800 respectively.
10. Is the market size provided in terms of value or volume?
The market size is provided in terms of value, measured in Million and volume, measured in K Tons.
11. Are there any specific market keywords associated with the report?
Yes, the market keyword associated with the report is "UK Food Acidulants Industry," which aids in identifying and referencing the specific market segment covered.
12. How do I determine which pricing option suits my needs best?
The pricing options vary based on user requirements and access needs. Individual users may opt for single-user licenses, while businesses requiring broader access may choose multi-user or enterprise licenses for cost-effective access to the report.
13. Are there any additional resources or data provided in the UK Food Acidulants Industry report?
While the report offers comprehensive insights, it's advisable to review the specific contents or supplementary materials provided to ascertain if additional resources or data are available.
14. How can I stay updated on further developments or reports in the UK Food Acidulants Industry?
To stay informed about further developments, trends, and reports in the UK Food Acidulants Industry, consider subscribing to industry newsletters, following relevant companies and organizations, or regularly checking reputable industry news sources and publications.
Methodology
Step 1 - Identification of Relevant Samples Size from Population Database


Step 2 - Approaches for Defining Global Market Size (Value, Volume* & Price*)

Note*: In applicable scenarios
Step 3 - Data Sources
Primary Research
- Web Analytics
- Survey Reports
- Research Institute
- Latest Research Reports
- Opinion Leaders
Secondary Research
- Annual Reports
- White Paper
- Latest Press Release
- Industry Association
- Paid Database
- Investor Presentations

Step 4 - Data Triangulation
Involves using different sources of information in order to increase the validity of a study
These sources are likely to be stakeholders in a program - participants, other researchers, program staff, other community members, and so on.
Then we put all data in single framework & apply various statistical tools to find out the dynamic on the market.
During the analysis stage, feedback from the stakeholder groups would be compared to determine areas of agreement as well as areas of divergence
