

Key Insights
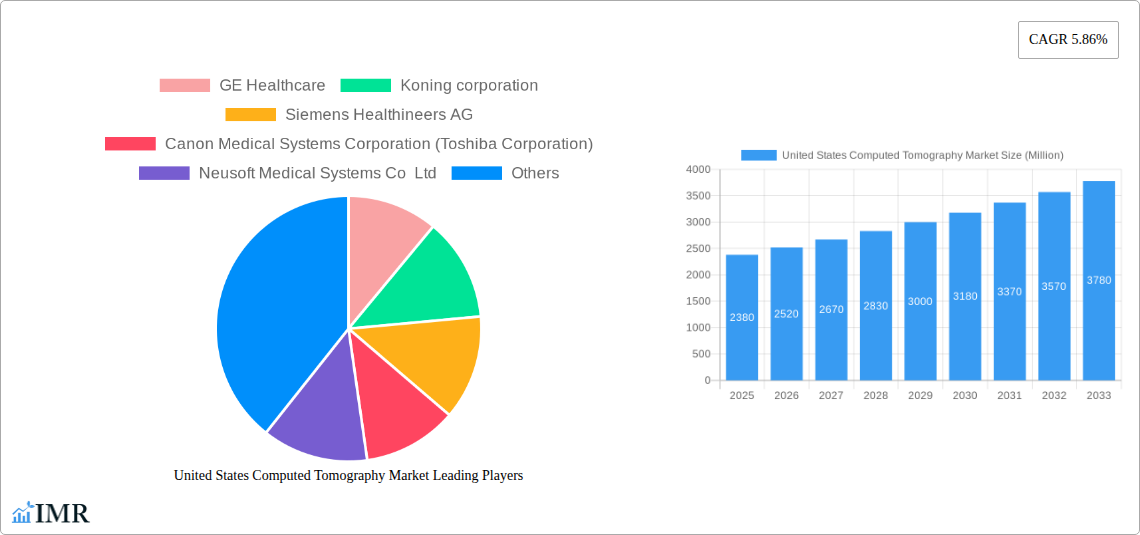
The United States Computed Tomography (CT) market, valued at approximately $2.38 billion in 2025, is projected to experience robust growth, driven by several key factors. Technological advancements, such as multi-slice CT scanners offering faster scan times and improved image quality, are significantly enhancing diagnostic capabilities and driving market expansion. The increasing prevalence of chronic diseases, including cardiovascular disease, cancer, and neurological disorders, necessitates advanced imaging techniques like CT scans for accurate diagnosis and treatment planning, further fueling market growth. Furthermore, the rising geriatric population, susceptible to age-related health issues requiring frequent CT scans, contributes to increased demand. The market is segmented by type (low, medium, and high slice CT scanners), application (oncology, neurology, cardiovascular, musculoskeletal, and others), and end-user (hospitals, diagnostic centers, and others). Hospitals remain the largest end-user segment, owing to their extensive diagnostic capabilities and patient influx.
Despite the positive growth trajectory, certain restraints are anticipated. High costs associated with CT scanners and their maintenance, coupled with increasing healthcare expenses, could potentially limit market expansion to some extent. Stringent regulatory approvals for new technologies and the potential risk of radiation exposure are also factors to consider. However, the ongoing development of advanced imaging techniques, such as low-dose CT scans, aimed at mitigating radiation risks, is likely to mitigate these concerns. The US market is expected to witness a significant increase in the adoption of advanced CT technologies, with a particular focus on enhancing image clarity and reducing scan times. This will drive growth throughout the forecast period (2025-2033). The high CAGR of 5.86% reflects the optimistic outlook for the market despite the aforementioned challenges. Specific growth within segments will depend on factors like technological advancements and reimbursement policies.
United States Computed Tomography (CT) Market Report: 2019-2033
This comprehensive report provides an in-depth analysis of the United States Computed Tomography (CT) market, encompassing its historical performance (2019-2024), current state (2025), and future projections (2025-2033). We delve into market segmentation by type (Low Slice, Medium Slice, High Slice), application (Oncology, Neurology, Cardiovascular, Musculoskeletal, Other Applications), and end-user (Hospitals, Diagnostic Centers, Other End Users), offering granular insights for strategic decision-making. The report is enriched with data on market size (in Million units), CAGR, and key industry players, making it an invaluable resource for industry professionals, investors, and market researchers.
United States Computed Tomography Market Dynamics & Structure
The United States CT market is characterized by a moderately concentrated landscape with major players holding significant market share. Technological advancements, particularly in image resolution, speed, and radiation dose reduction, are key growth drivers. Stringent regulatory frameworks, including FDA approvals, influence market entry and product development. Competitive pressures from advanced imaging modalities (MRI, PET) also exist. The market is further shaped by demographic trends, such as an aging population and increased prevalence of chronic diseases, boosting demand for diagnostic imaging services. M&A activity remains a significant aspect, with several large-scale acquisitions and partnerships observed in recent years, leading to an estimated xx% increase in deal volume between 2019 and 2024.
- Market Concentration: The top 5 players account for approximately xx% of the market share in 2025.
- Technological Innovation: Continuous advancements in detector technology, image reconstruction algorithms, and AI-powered image analysis are driving growth.
- Regulatory Landscape: FDA approvals and safety regulations influence market access and product development timelines.
- Competitive Substitutes: MRI and PET scans present competitive challenges, requiring CT manufacturers to continuously innovate.
- End-User Demographics: An aging population and rising prevalence of chronic diseases fuel demand for CT scans.
- M&A Activity: An estimated xx M&A deals were closed between 2019 and 2024, contributing to market consolidation.
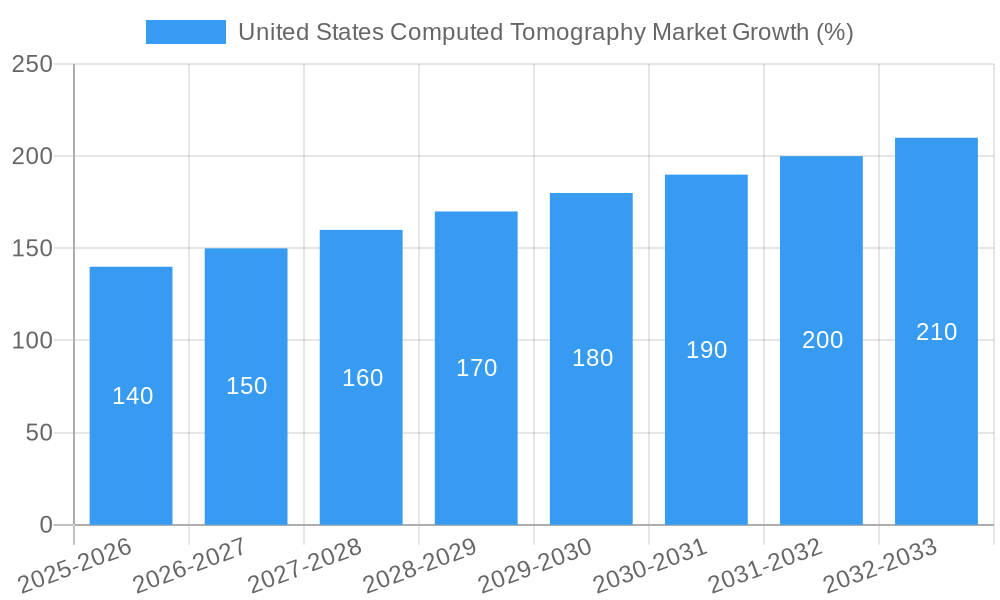
United States Computed Tomography Market Growth Trends & Insights
The US CT market witnessed substantial growth during the historical period (2019-2024), driven by factors such as technological advancements, increasing healthcare spending, and growing prevalence of chronic diseases. The market size expanded from xx Million units in 2019 to xx Million units in 2024, registering a CAGR of xx%. Adoption rates are increasing across various applications, particularly in oncology and cardiology. Technological disruptions, including the introduction of multi-slice CT scanners and AI-powered image analysis, are further accelerating market growth. Changes in consumer behavior, with increased demand for faster and more accurate diagnostic tools, also contribute positively. The market is projected to maintain a steady growth trajectory in the forecast period (2025-2033), driven by continued technological advancements and expanding applications. Market penetration is projected to reach xx% by 2033.
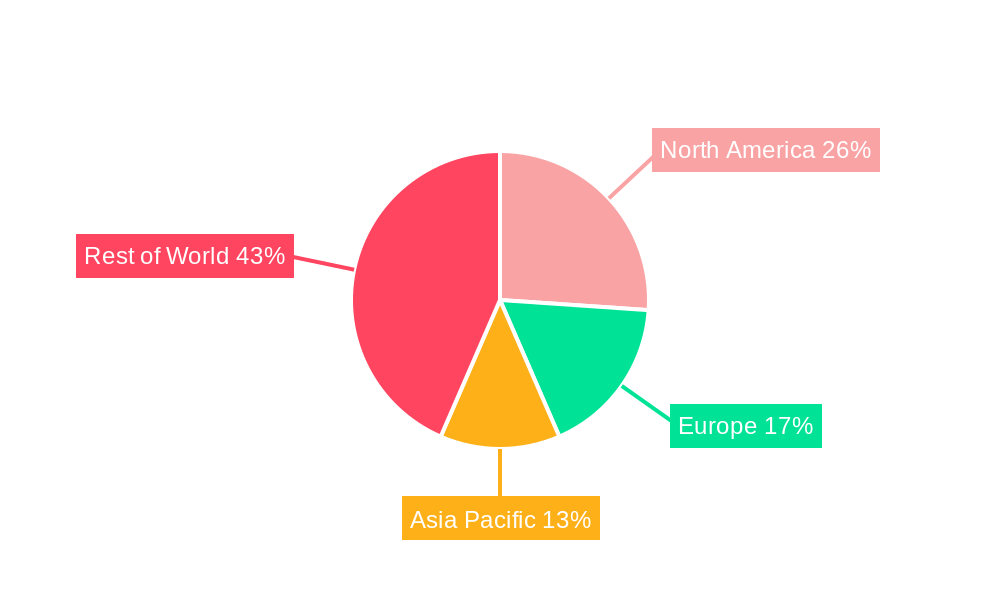
Dominant Regions, Countries, or Segments in United States Computed Tomography Market
The growth of the US CT market is predominantly driven by several key regions and segments. Hospitals remain the largest end-user segment, holding approximately xx% of the market share in 2025, followed by diagnostic centers. Among applications, oncology and cardiology contribute significantly to overall market growth due to the high volume of CT scans performed for diagnosis and treatment monitoring. The high-slice CT segment is experiencing faster growth than other segments due to its superior image quality and faster scan times. Geographically, major metropolitan areas with a high concentration of hospitals and diagnostic centers demonstrate significantly higher adoption rates.
- Key Drivers:
- High healthcare spending.
- Increasing prevalence of chronic diseases (cancer, cardiovascular diseases).
- Technological advancements.
- Favorable regulatory environment.
- Dominant Segments:
- Application: Oncology, Cardiovascular.
- Type: High-Slice CT scanners.
- End-User: Hospitals.
United States Computed Tomography Market Product Landscape
The US CT market showcases a diverse range of products, from low-slice to high-slice scanners with varying levels of technological sophistication. Key advancements include improved image resolution, faster scan times, reduced radiation dose, and advanced image reconstruction algorithms. Manufacturers are increasingly integrating AI-powered tools for automated image analysis and improved diagnostic accuracy. Unique selling propositions often focus on ease of use, improved workflow efficiency, and reduced operational costs. The market is witnessing a growing trend towards point-of-care CT systems, providing flexibility and convenience for healthcare providers.
Key Drivers, Barriers & Challenges in United States Computed Tomography Market
Key Drivers:
- Rising prevalence of chronic diseases requiring advanced diagnostic tools.
- Technological advancements leading to improved image quality and efficiency.
- Increasing healthcare spending and investments in medical infrastructure.
Key Challenges & Restraints:
- High initial investment costs for CT scanners, especially advanced models.
- Stringent regulatory requirements and FDA approval processes.
- Competition from alternative imaging modalities (MRI, PET).
- Concerns regarding radiation exposure and associated risks. This leads to a xx% reduction in market growth each year due to public concerns.
Emerging Opportunities in United States Computed Tomography Market
- Point-of-care CT: Expanding applications in emergency rooms and operating rooms.
- AI-powered image analysis: Automating tasks and improving diagnostic accuracy.
- Mobile CT scanners: Enhanced accessibility and improved patient care in remote areas.
- Specialized CT applications: Development of niche applications in areas such as dentistry and veterinary medicine.
Growth Accelerators in the United States Computed Tomography Market Industry
The US CT market's long-term growth is propelled by continuous technological innovation, strategic partnerships and collaborations amongst manufacturers and healthcare providers, expansion into untapped markets such as rural healthcare settings, and increasing focus on providing cost-effective solutions. The development of advanced imaging techniques and AI integration are vital catalysts, while an expanding network of diagnostic imaging centers in underserved communities further stimulates growth.
Key Players Shaping the United States Computed Tomography Market Market
- GE Healthcare
- Koning corporation
- Siemens Healthineers AG
- Canon Medical Systems Corporation (Toshiba Corporation)
- Neusoft Medical Systems Co Ltd
- Carestream Health
- Koninklijke Philips NV
- Stryker Corporation
- Planmeca Group (Planmed OY)
- Samsung Electronics Co Ltd
- Fujifilm Holdings Corporation
Notable Milestones in United States Computed Tomography Market Sector
- June 2022: Xoran Technologies receives a patent for a modular computed tomography (CT) system assembly, signifying advancement in point-of-care CT technology.
- March 2022: NeuroLogica Corp's OmniTom Elite receives 510(k) approval, expanding mobile CT imaging capabilities.
In-Depth United States Computed Tomography Market Market Outlook
The US CT market holds significant potential for growth in the coming years, driven by ongoing technological advancements, increasing healthcare spending, and a growing elderly population. Strategic opportunities lie in developing innovative point-of-care CT solutions, integrating AI for enhanced diagnostic accuracy, and expanding into underserved markets. The market's future growth will be characterized by an increasing emphasis on cost-effectiveness, improved workflow efficiency, and reduced radiation exposure.
United States Computed Tomography Market Segmentation
-
1. Type
- 1.1. Low Slice
- 1.2. Medium Slice
- 1.3. High Slice
-
2. Application
- 2.1. Oncology
- 2.2. Neurology
- 2.3. Cardiovascular
- 2.4. Musculoskeletal
- 2.5. Other Applications
-
3. End User
- 3.1. Hospitals
- 3.2. Diagnostic Centers
- 3.3. Other End Users
United States Computed Tomography Market Segmentation By Geography
- 1. United States
United States Computed Tomography Market REPORT HIGHLIGHTS
| Aspects | Details |
|---|---|
| Study Period | 2019-2033 |
| Base Year | 2024 |
| Estimated Year | 2025 |
| Forecast Period | 2025-2033 |
| Historical Period | 2019-2024 |
| Growth Rate | CAGR of 5.86% from 2019-2033 |
| Segmentation |
|
Table of Contents
- 1. Introduction
- 1.1. Research Scope
- 1.2. Market Segmentation
- 1.3. Research Methodology
- 1.4. Definitions and Assumptions
- 2. Executive Summary
- 2.1. Introduction
- 3. Market Dynamics
- 3.1. Introduction
- 3.2. Market Drivers
- 3.2.1. Increasing Prevalence of Chronic Diseases; Rising Geriatric Population; Increasing Technological Advancements
- 3.3. Market Restrains
- 3.3.1. Lack Of Proper Reimbursement And Stringent Regulatory Approval Procedures; High Cost of Equipment
- 3.4. Market Trends
- 3.4.1. Oncology Segment is Expected to Hold a Significant Market Share Over the Forecast Period
- 4. Market Factor Analysis
- 4.1. Porters Five Forces
- 4.2. Supply/Value Chain
- 4.3. PESTEL analysis
- 4.4. Market Entropy
- 4.5. Patent/Trademark Analysis
- 5. United States Computed Tomography Market Analysis, Insights and Forecast, 2019-2031
- 5.1. Market Analysis, Insights and Forecast - by Type
- 5.1.1. Low Slice
- 5.1.2. Medium Slice
- 5.1.3. High Slice
- 5.2. Market Analysis, Insights and Forecast - by Application
- 5.2.1. Oncology
- 5.2.2. Neurology
- 5.2.3. Cardiovascular
- 5.2.4. Musculoskeletal
- 5.2.5. Other Applications
- 5.3. Market Analysis, Insights and Forecast - by End User
- 5.3.1. Hospitals
- 5.3.2. Diagnostic Centers
- 5.3.3. Other End Users
- 5.4. Market Analysis, Insights and Forecast - by Region
- 5.4.1. United States
- 5.1. Market Analysis, Insights and Forecast - by Type
- 6. United States United States Computed Tomography Market Analysis, Insights and Forecast, 2019-2031
- 7. Canada United States Computed Tomography Market Analysis, Insights and Forecast, 2019-2031
- 8. Mexico United States Computed Tomography Market Analysis, Insights and Forecast, 2019-2031
- 9. Competitive Analysis
- 9.1. Market Share Analysis 2024
- 9.2. Company Profiles
- 9.2.1 GE Healthcare
- 9.2.1.1. Overview
- 9.2.1.2. Products
- 9.2.1.3. SWOT Analysis
- 9.2.1.4. Recent Developments
- 9.2.1.5. Financials (Based on Availability)
- 9.2.2 Koning corporation
- 9.2.2.1. Overview
- 9.2.2.2. Products
- 9.2.2.3. SWOT Analysis
- 9.2.2.4. Recent Developments
- 9.2.2.5. Financials (Based on Availability)
- 9.2.3 Siemens Healthineers AG
- 9.2.3.1. Overview
- 9.2.3.2. Products
- 9.2.3.3. SWOT Analysis
- 9.2.3.4. Recent Developments
- 9.2.3.5. Financials (Based on Availability)
- 9.2.4 Canon Medical Systems Corporation (Toshiba Corporation)
- 9.2.4.1. Overview
- 9.2.4.2. Products
- 9.2.4.3. SWOT Analysis
- 9.2.4.4. Recent Developments
- 9.2.4.5. Financials (Based on Availability)
- 9.2.5 Neusoft Medical Systems Co Ltd
- 9.2.5.1. Overview
- 9.2.5.2. Products
- 9.2.5.3. SWOT Analysis
- 9.2.5.4. Recent Developments
- 9.2.5.5. Financials (Based on Availability)
- 9.2.6 Carestream Health
- 9.2.6.1. Overview
- 9.2.6.2. Products
- 9.2.6.3. SWOT Analysis
- 9.2.6.4. Recent Developments
- 9.2.6.5. Financials (Based on Availability)
- 9.2.7 Koninklijke Philips NV
- 9.2.7.1. Overview
- 9.2.7.2. Products
- 9.2.7.3. SWOT Analysis
- 9.2.7.4. Recent Developments
- 9.2.7.5. Financials (Based on Availability)
- 9.2.8 Stryker Corporation
- 9.2.8.1. Overview
- 9.2.8.2. Products
- 9.2.8.3. SWOT Analysis
- 9.2.8.4. Recent Developments
- 9.2.8.5. Financials (Based on Availability)
- 9.2.9 Planmeca Group (Planmed OY)
- 9.2.9.1. Overview
- 9.2.9.2. Products
- 9.2.9.3. SWOT Analysis
- 9.2.9.4. Recent Developments
- 9.2.9.5. Financials (Based on Availability)
- 9.2.10 Samsung Electronics Co Ltd
- 9.2.10.1. Overview
- 9.2.10.2. Products
- 9.2.10.3. SWOT Analysis
- 9.2.10.4. Recent Developments
- 9.2.10.5. Financials (Based on Availability)
- 9.2.11 Fujifilm Holdings Corporation
- 9.2.11.1. Overview
- 9.2.11.2. Products
- 9.2.11.3. SWOT Analysis
- 9.2.11.4. Recent Developments
- 9.2.11.5. Financials (Based on Availability)
- 9.2.1 GE Healthcare
List of Figures
- Figure 1: United States Computed Tomography Market Revenue Breakdown (Million, %) by Product 2024 & 2032
- Figure 2: United States Computed Tomography Market Share (%) by Company 2024
List of Tables
- Table 1: United States Computed Tomography Market Revenue Million Forecast, by Region 2019 & 2032
- Table 2: United States Computed Tomography Market Revenue Million Forecast, by Type 2019 & 2032
- Table 3: United States Computed Tomography Market Revenue Million Forecast, by Application 2019 & 2032
- Table 4: United States Computed Tomography Market Revenue Million Forecast, by End User 2019 & 2032
- Table 5: United States Computed Tomography Market Revenue Million Forecast, by Region 2019 & 2032
- Table 6: United States Computed Tomography Market Revenue Million Forecast, by Country 2019 & 2032
- Table 7: United States United States Computed Tomography Market Revenue (Million) Forecast, by Application 2019 & 2032
- Table 8: Canada United States Computed Tomography Market Revenue (Million) Forecast, by Application 2019 & 2032
- Table 9: Mexico United States Computed Tomography Market Revenue (Million) Forecast, by Application 2019 & 2032
- Table 10: United States Computed Tomography Market Revenue Million Forecast, by Type 2019 & 2032
- Table 11: United States Computed Tomography Market Revenue Million Forecast, by Application 2019 & 2032
- Table 12: United States Computed Tomography Market Revenue Million Forecast, by End User 2019 & 2032
- Table 13: United States Computed Tomography Market Revenue Million Forecast, by Country 2019 & 2032
Frequently Asked Questions
1. What is the projected Compound Annual Growth Rate (CAGR) of the United States Computed Tomography Market?
The projected CAGR is approximately 5.86%.
2. Which companies are prominent players in the United States Computed Tomography Market?
Key companies in the market include GE Healthcare, Koning corporation, Siemens Healthineers AG, Canon Medical Systems Corporation (Toshiba Corporation), Neusoft Medical Systems Co Ltd, Carestream Health, Koninklijke Philips NV, Stryker Corporation, Planmeca Group (Planmed OY), Samsung Electronics Co Ltd, Fujifilm Holdings Corporation.
3. What are the main segments of the United States Computed Tomography Market?
The market segments include Type, Application, End User.
4. Can you provide details about the market size?
The market size is estimated to be USD 2.38 Million as of 2022.
5. What are some drivers contributing to market growth?
Increasing Prevalence of Chronic Diseases; Rising Geriatric Population; Increasing Technological Advancements.
6. What are the notable trends driving market growth?
Oncology Segment is Expected to Hold a Significant Market Share Over the Forecast Period.
7. Are there any restraints impacting market growth?
Lack Of Proper Reimbursement And Stringent Regulatory Approval Procedures; High Cost of Equipment.
8. Can you provide examples of recent developments in the market?
In June 2022, Xoran Technologies, a United States-based company received a patent for a modular computed tomography (CT) system assembly. Together with our twenty and counting active patents, this ground-breaking cone beam CT arrangement opens up new possibilities. The innovation is just the start of a new line of point-of-care (POC) imaging equipment from Xoran.
9. What pricing options are available for accessing the report?
Pricing options include single-user, multi-user, and enterprise licenses priced at USD 3800, USD 4500, and USD 5800 respectively.
10. Is the market size provided in terms of value or volume?
The market size is provided in terms of value, measured in Million.
11. Are there any specific market keywords associated with the report?
Yes, the market keyword associated with the report is "United States Computed Tomography Market," which aids in identifying and referencing the specific market segment covered.
12. How do I determine which pricing option suits my needs best?
The pricing options vary based on user requirements and access needs. Individual users may opt for single-user licenses, while businesses requiring broader access may choose multi-user or enterprise licenses for cost-effective access to the report.
13. Are there any additional resources or data provided in the United States Computed Tomography Market report?
While the report offers comprehensive insights, it's advisable to review the specific contents or supplementary materials provided to ascertain if additional resources or data are available.
14. How can I stay updated on further developments or reports in the United States Computed Tomography Market?
To stay informed about further developments, trends, and reports in the United States Computed Tomography Market, consider subscribing to industry newsletters, following relevant companies and organizations, or regularly checking reputable industry news sources and publications.
Methodology
Step 1 - Identification of Relevant Samples Size from Population Database


Step 2 - Approaches for Defining Global Market Size (Value, Volume* & Price*)

Note*: In applicable scenarios
Step 3 - Data Sources
Primary Research
- Web Analytics
- Survey Reports
- Research Institute
- Latest Research Reports
- Opinion Leaders
Secondary Research
- Annual Reports
- White Paper
- Latest Press Release
- Industry Association
- Paid Database
- Investor Presentations

Step 4 - Data Triangulation
Involves using different sources of information in order to increase the validity of a study
These sources are likely to be stakeholders in a program - participants, other researchers, program staff, other community members, and so on.
Then we put all data in single framework & apply various statistical tools to find out the dynamic on the market.
During the analysis stage, feedback from the stakeholder groups would be compared to determine areas of agreement as well as areas of divergence
