

Key Insights
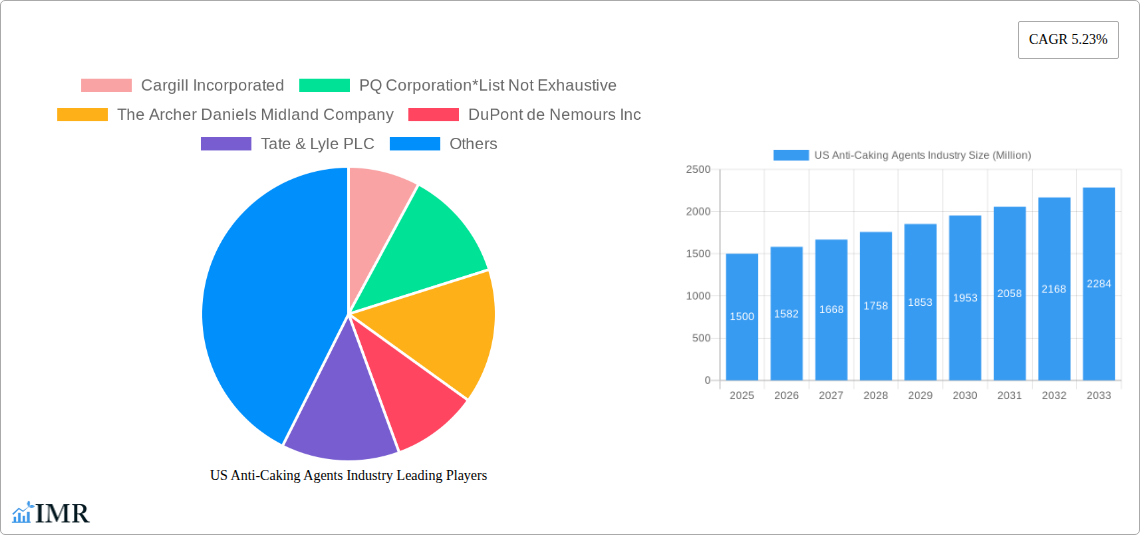
The US anti-caking agents market, valued at approximately $1.5 billion in 2025, is projected to experience robust growth, driven by increasing demand across diverse sectors. The food and beverage industry remains a significant consumer, utilizing anti-caking agents to enhance the flowability and shelf life of powdered products like spices, sugar, and flour. The cosmetic and personal care sector also contributes substantially, employing these agents to prevent clumping in powders and other formulations. Furthermore, the growing animal feed industry fuels demand, as anti-caking agents improve feed consistency and prevent bridging, leading to optimized animal nutrition and farm productivity. The market's expansion is further fueled by evolving consumer preferences for convenient and high-quality products, along with stringent food safety regulations pushing manufacturers to adopt effective anti-caking solutions. Calcium, sodium, and magnesium compounds dominate the market, reflecting their effectiveness and cost-efficiency.
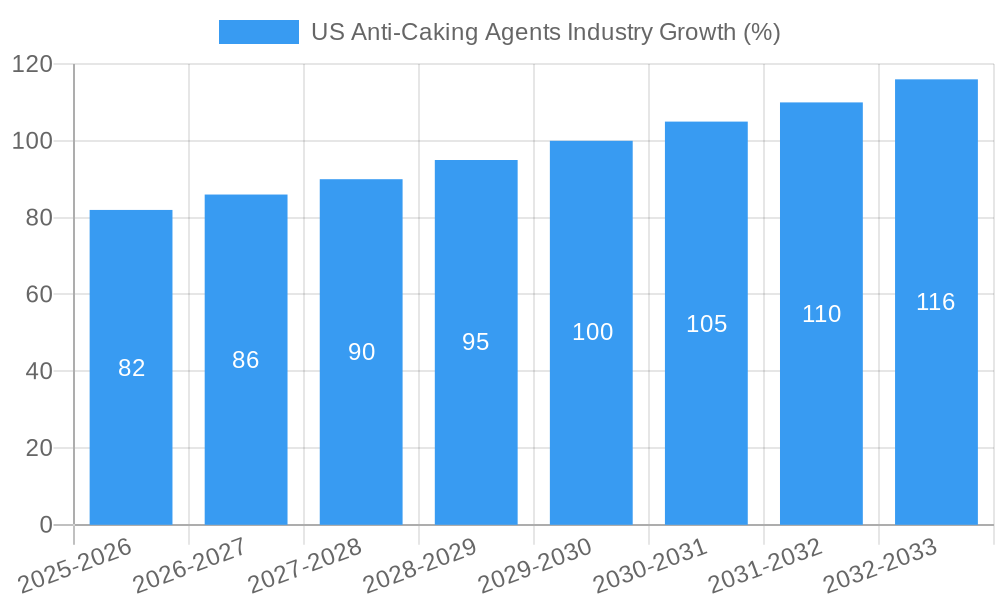
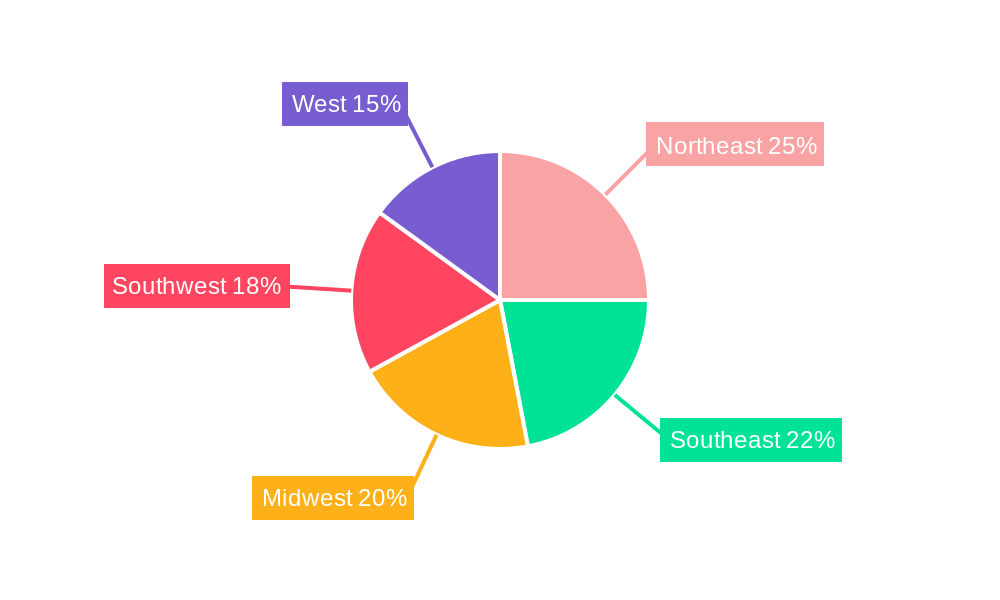
The market's Compound Annual Growth Rate (CAGR) of 5.23% from 2025-2033 indicates a steady upward trajectory. However, potential restraints include fluctuations in raw material prices and increasing regulatory scrutiny regarding the use of certain anti-caking agents. Major players like Cargill, ADM, DuPont, and BASF leverage their extensive distribution networks and technological capabilities to maintain a strong market presence. Regional analysis reveals a significant share for the United States, with the Northeast, Southeast, Midwest, Southwest, and West regions all contributing to the overall market size. Future growth will be influenced by innovation in sustainable and natural anti-caking agents, catering to growing consumer demand for environmentally friendly products. This shift, coupled with continuous technological advancements in the formulation and application of these agents, ensures the continued expansion of the US anti-caking agents market.
US Anti-Caking Agents Industry Market Report: 2019-2033
This comprehensive report provides an in-depth analysis of the US anti-caking agents market, offering valuable insights for industry professionals, investors, and strategic decision-makers. The report covers the period from 2019 to 2033, with a focus on the forecast period from 2025 to 2033 (Base Year: 2025, Estimated Year: 2025). The analysis encompasses key market segments, including Type (Calcium Compounds, Sodium Compounds, Magnesium Compounds, Others) and Application (Food and Beverage, Cosmetic and Personal Care, Feed, Others), providing a granular understanding of market dynamics and growth potential.
US Anti-Caking Agents Industry Market Dynamics & Structure
The US anti-caking agents market is characterized by a moderately concentrated landscape with several major players and numerous smaller regional producers. Technological innovation, driven by increasing demand for high-performance and specialized anti-caking agents, plays a crucial role. Stringent regulatory frameworks governing food safety and ingredient labeling significantly impact market operations. Competitive pressure from substitute ingredients and emerging technologies necessitates constant product innovation. End-user demographics, particularly growth in the food and beverage industry and the increasing demand for convenience foods, shape market demand. M&A activity in recent years has consolidated market share and spurred further innovation.
- Market Concentration: The market is moderately concentrated, with the top 5 players holding an estimated 45% market share in 2024.
- Technological Innovation: Focus on developing sustainable, organic, and high-performance anti-caking agents.
- Regulatory Landscape: Strict FDA regulations regarding food additives and labeling influence product development and market entry.
- Competitive Substitutes: Natural alternatives and modified starch-based products present competition.
- M&A Activity: Significant mergers and acquisitions (xx deals) were recorded between 2019 and 2024, resulting in increased market consolidation.
US Anti-Caking Agents Industry Growth Trends & Insights
The US anti-caking agents market experienced a steady growth trajectory between 2019 and 2024, with a CAGR of xx%. This growth is attributed to several factors, including rising consumer demand for processed foods, increasing awareness of the functional benefits of anti-caking agents, and advancements in product formulations. The market is witnessing a shift towards natural and organic anti-caking agents, driven by changing consumer preferences and stringent regulatory requirements. Technological disruptions, such as the introduction of novel manufacturing processes and the development of sustainable formulations, are significantly impacting market dynamics. Market penetration of specialized anti-caking agents in niche applications, such as pharmaceuticals and pet food, is expected to increase significantly in the coming years. This robust growth is predicted to continue, with a projected CAGR of xx% from 2025 to 2033, reaching a market size of $xx million by 2033. Specific market segmentation data with precise values will be included in the complete report.
Dominant Regions, Countries, or Segments in US Anti-Caking Agents Industry
The Food and Beverage segment dominates the US anti-caking agents market, accounting for approximately 60% of the total market value in 2024. This is primarily driven by the increasing demand for processed foods and the need for efficient food preservation techniques. Among the types of anti-caking agents, Calcium Compounds hold the largest market share, due to their cost-effectiveness and wide range of applications. The Midwest region demonstrates the highest growth, owing to the significant concentration of food processing industries.
- Key Drivers: Growth in the food processing industry, increasing demand for convenience foods, and rising consumer disposable incomes.
- Dominance Factors: Cost-effectiveness of Calcium Compounds, high demand from the food and beverage sector, and strong industrial concentration in certain regions.
- Growth Potential: Expansion into niche applications such as pharmaceuticals and pet food, and the increasing adoption of natural and organic options.
US Anti-Caking Agents Industry Product Landscape
The anti-caking agents market features a diverse range of products tailored to specific applications. Innovations focus on improving performance characteristics such as flowability, dispersibility, and moisture absorption. Technological advancements have resulted in the development of specialized anti-caking agents with enhanced functionalities, such as extended shelf-life and improved sensory properties. Unique selling propositions include superior performance at lower dosages and eco-friendly formulations. The ongoing trend is towards natural and organic options catering to the growing health-conscious consumer base.
Key Drivers, Barriers & Challenges in US Anti-Caking Agents Industry
Key Drivers: Rising demand for processed foods, increasing preference for convenience products, and the growing use of anti-caking agents in various industries. Technological advancements are also leading to the development of newer and more efficient products. Government regulations promoting food safety also drive market growth.
Challenges: Stringent regulatory requirements for food additives, intense competition from substitute ingredients, and potential supply chain disruptions due to raw material price fluctuations. Fluctuations in the cost of raw materials can pose a challenge to manufacturers and affect profitability.
Emerging Opportunities in US Anti-Caking Agents Industry
Untapped markets in niche applications such as pet food, pharmaceuticals, and specialized dietary supplements offer significant opportunities. Growing demand for natural and organic anti-caking agents presents a considerable market segment for sustainable product development. The development of novel applications for anti-caking agents in cosmetics and personal care products, focusing on improved texture and stability of formulations, also offers considerable potential.
Growth Accelerators in the US Anti-Caking Agents Industry Industry
Technological breakthroughs in material science are expected to lead to the development of superior anti-caking agents with improved properties and functionalities. Strategic partnerships between ingredient suppliers and food processors can foster innovation and accelerate market penetration. Expansion into emerging markets, especially in the Asian and African regions, presents a significant opportunity for market growth.
Key Players Shaping the US Anti-Caking Agents Industry Market
- Cargill Incorporated
- PQ Corporation
- The Archer Daniels Midland Company
- DuPont de Nemours Inc
- Tate & Lyle PLC
- BASF SE
- Imac Inc
- Agropur Ingredients
Notable Milestones in US Anti-Caking Agents Industry Sector
- 2021 (Q4): Cargill acquired Penford Products, expanding its portfolio of anti-caking agents for the food industry.
- 2022 (Q2): BASF launched a new line of organic anti-caking agents for the food and beverage industry, targeting the growing demand for natural ingredients.
- 2023 (Q1): PQ Corporation announced a joint venture with a Chinese company to expand its production capacity in Asia, aiming to capitalize on the burgeoning Asian market.
In-Depth US Anti-Caking Agents Industry Market Outlook
The US anti-caking agents market is poised for continued growth, driven by the factors previously discussed. Strategic opportunities lie in developing innovative products tailored to specific applications, focusing on sustainability and eco-friendly formulations. Expanding into new markets and forging strategic partnerships with key players in the food and beverage, cosmetic, and feed industries will be crucial for long-term success. The market exhibits strong growth potential, with significant opportunities for players who can leverage technological advancements and adapt to the evolving consumer preferences and regulatory landscape.
US Anti-Caking Agents Industry Segmentation
-
1. Type
- 1.1. Calcium Compounds
- 1.2. Sodium Compounds
- 1.3. Magnesium Compounds
- 1.4. Others
-
2. Application
-
2.1. Food and Beverage
- 2.1.1. Bakery Products
- 2.1.2. Dairy Products
- 2.1.3. Soups & Sauces
- 2.1.4. Beverages
- 2.1.5. Others
- 2.2. Cosmetic and Personal Care
- 2.3. Feed
-
2.1. Food and Beverage
US Anti-Caking Agents Industry Segmentation By Geography
-
1. North America
- 1.1. United States
- 1.2. Canada
- 1.3. Mexico
-
2. South America
- 2.1. Brazil
- 2.2. Argentina
- 2.3. Rest of South America
-
3. Europe
- 3.1. United Kingdom
- 3.2. Germany
- 3.3. France
- 3.4. Italy
- 3.5. Spain
- 3.6. Russia
- 3.7. Benelux
- 3.8. Nordics
- 3.9. Rest of Europe
-
4. Middle East & Africa
- 4.1. Turkey
- 4.2. Israel
- 4.3. GCC
- 4.4. North Africa
- 4.5. South Africa
- 4.6. Rest of Middle East & Africa
-
5. Asia Pacific
- 5.1. China
- 5.2. India
- 5.3. Japan
- 5.4. South Korea
- 5.5. ASEAN
- 5.6. Oceania
- 5.7. Rest of Asia Pacific
US Anti-Caking Agents Industry REPORT HIGHLIGHTS
| Aspects | Details |
|---|---|
| Study Period | 2019-2033 |
| Base Year | 2024 |
| Estimated Year | 2025 |
| Forecast Period | 2025-2033 |
| Historical Period | 2019-2024 |
| Growth Rate | CAGR of 5.23% from 2019-2033 |
| Segmentation |
|
Table of Contents
- 1. Introduction
- 1.1. Research Scope
- 1.2. Market Segmentation
- 1.3. Research Methodology
- 1.4. Definitions and Assumptions
- 2. Executive Summary
- 2.1. Introduction
- 3. Market Dynamics
- 3.1. Introduction
- 3.2. Market Drivers
- 3.2.1. Wide Applications and Functionality; Demand For Gluten-Free Products
- 3.3. Market Restrains
- 3.3.1. Easy Availability of Economically Feasible Alternatives
- 3.4. Market Trends
- 3.4.1. Calcium Compounds Holds a Significant Share
- 4. Market Factor Analysis
- 4.1. Porters Five Forces
- 4.2. Supply/Value Chain
- 4.3. PESTEL analysis
- 4.4. Market Entropy
- 4.5. Patent/Trademark Analysis
- 5. Global US Anti-Caking Agents Industry Analysis, Insights and Forecast, 2019-2031
- 5.1. Market Analysis, Insights and Forecast - by Type
- 5.1.1. Calcium Compounds
- 5.1.2. Sodium Compounds
- 5.1.3. Magnesium Compounds
- 5.1.4. Others
- 5.2. Market Analysis, Insights and Forecast - by Application
- 5.2.1. Food and Beverage
- 5.2.1.1. Bakery Products
- 5.2.1.2. Dairy Products
- 5.2.1.3. Soups & Sauces
- 5.2.1.4. Beverages
- 5.2.1.5. Others
- 5.2.2. Cosmetic and Personal Care
- 5.2.3. Feed
- 5.2.1. Food and Beverage
- 5.3. Market Analysis, Insights and Forecast - by Region
- 5.3.1. North America
- 5.3.2. South America
- 5.3.3. Europe
- 5.3.4. Middle East & Africa
- 5.3.5. Asia Pacific
- 5.1. Market Analysis, Insights and Forecast - by Type
- 6. North America US Anti-Caking Agents Industry Analysis, Insights and Forecast, 2019-2031
- 6.1. Market Analysis, Insights and Forecast - by Type
- 6.1.1. Calcium Compounds
- 6.1.2. Sodium Compounds
- 6.1.3. Magnesium Compounds
- 6.1.4. Others
- 6.2. Market Analysis, Insights and Forecast - by Application
- 6.2.1. Food and Beverage
- 6.2.1.1. Bakery Products
- 6.2.1.2. Dairy Products
- 6.2.1.3. Soups & Sauces
- 6.2.1.4. Beverages
- 6.2.1.5. Others
- 6.2.2. Cosmetic and Personal Care
- 6.2.3. Feed
- 6.2.1. Food and Beverage
- 6.1. Market Analysis, Insights and Forecast - by Type
- 7. South America US Anti-Caking Agents Industry Analysis, Insights and Forecast, 2019-2031
- 7.1. Market Analysis, Insights and Forecast - by Type
- 7.1.1. Calcium Compounds
- 7.1.2. Sodium Compounds
- 7.1.3. Magnesium Compounds
- 7.1.4. Others
- 7.2. Market Analysis, Insights and Forecast - by Application
- 7.2.1. Food and Beverage
- 7.2.1.1. Bakery Products
- 7.2.1.2. Dairy Products
- 7.2.1.3. Soups & Sauces
- 7.2.1.4. Beverages
- 7.2.1.5. Others
- 7.2.2. Cosmetic and Personal Care
- 7.2.3. Feed
- 7.2.1. Food and Beverage
- 7.1. Market Analysis, Insights and Forecast - by Type
- 8. Europe US Anti-Caking Agents Industry Analysis, Insights and Forecast, 2019-2031
- 8.1. Market Analysis, Insights and Forecast - by Type
- 8.1.1. Calcium Compounds
- 8.1.2. Sodium Compounds
- 8.1.3. Magnesium Compounds
- 8.1.4. Others
- 8.2. Market Analysis, Insights and Forecast - by Application
- 8.2.1. Food and Beverage
- 8.2.1.1. Bakery Products
- 8.2.1.2. Dairy Products
- 8.2.1.3. Soups & Sauces
- 8.2.1.4. Beverages
- 8.2.1.5. Others
- 8.2.2. Cosmetic and Personal Care
- 8.2.3. Feed
- 8.2.1. Food and Beverage
- 8.1. Market Analysis, Insights and Forecast - by Type
- 9. Middle East & Africa US Anti-Caking Agents Industry Analysis, Insights and Forecast, 2019-2031
- 9.1. Market Analysis, Insights and Forecast - by Type
- 9.1.1. Calcium Compounds
- 9.1.2. Sodium Compounds
- 9.1.3. Magnesium Compounds
- 9.1.4. Others
- 9.2. Market Analysis, Insights and Forecast - by Application
- 9.2.1. Food and Beverage
- 9.2.1.1. Bakery Products
- 9.2.1.2. Dairy Products
- 9.2.1.3. Soups & Sauces
- 9.2.1.4. Beverages
- 9.2.1.5. Others
- 9.2.2. Cosmetic and Personal Care
- 9.2.3. Feed
- 9.2.1. Food and Beverage
- 9.1. Market Analysis, Insights and Forecast - by Type
- 10. Asia Pacific US Anti-Caking Agents Industry Analysis, Insights and Forecast, 2019-2031
- 10.1. Market Analysis, Insights and Forecast - by Type
- 10.1.1. Calcium Compounds
- 10.1.2. Sodium Compounds
- 10.1.3. Magnesium Compounds
- 10.1.4. Others
- 10.2. Market Analysis, Insights and Forecast - by Application
- 10.2.1. Food and Beverage
- 10.2.1.1. Bakery Products
- 10.2.1.2. Dairy Products
- 10.2.1.3. Soups & Sauces
- 10.2.1.4. Beverages
- 10.2.1.5. Others
- 10.2.2. Cosmetic and Personal Care
- 10.2.3. Feed
- 10.2.1. Food and Beverage
- 10.1. Market Analysis, Insights and Forecast - by Type
- 11. Northeast US Anti-Caking Agents Industry Analysis, Insights and Forecast, 2019-2031
- 12. Southeast US Anti-Caking Agents Industry Analysis, Insights and Forecast, 2019-2031
- 13. Midwest US Anti-Caking Agents Industry Analysis, Insights and Forecast, 2019-2031
- 14. Southwest US Anti-Caking Agents Industry Analysis, Insights and Forecast, 2019-2031
- 15. West US Anti-Caking Agents Industry Analysis, Insights and Forecast, 2019-2031
- 16. Competitive Analysis
- 16.1. Global Market Share Analysis 2024
- 16.2. Company Profiles
- 16.2.1 Cargill Incorporated
- 16.2.1.1. Overview
- 16.2.1.2. Products
- 16.2.1.3. SWOT Analysis
- 16.2.1.4. Recent Developments
- 16.2.1.5. Financials (Based on Availability)
- 16.2.2 PQ Corporation*List Not Exhaustive
- 16.2.2.1. Overview
- 16.2.2.2. Products
- 16.2.2.3. SWOT Analysis
- 16.2.2.4. Recent Developments
- 16.2.2.5. Financials (Based on Availability)
- 16.2.3 The Archer Daniels Midland Company
- 16.2.3.1. Overview
- 16.2.3.2. Products
- 16.2.3.3. SWOT Analysis
- 16.2.3.4. Recent Developments
- 16.2.3.5. Financials (Based on Availability)
- 16.2.4 DuPont de Nemours Inc
- 16.2.4.1. Overview
- 16.2.4.2. Products
- 16.2.4.3. SWOT Analysis
- 16.2.4.4. Recent Developments
- 16.2.4.5. Financials (Based on Availability)
- 16.2.5 Tate & Lyle PLC
- 16.2.5.1. Overview
- 16.2.5.2. Products
- 16.2.5.3. SWOT Analysis
- 16.2.5.4. Recent Developments
- 16.2.5.5. Financials (Based on Availability)
- 16.2.6 BASF SE
- 16.2.6.1. Overview
- 16.2.6.2. Products
- 16.2.6.3. SWOT Analysis
- 16.2.6.4. Recent Developments
- 16.2.6.5. Financials (Based on Availability)
- 16.2.7 Imac Inc
- 16.2.7.1. Overview
- 16.2.7.2. Products
- 16.2.7.3. SWOT Analysis
- 16.2.7.4. Recent Developments
- 16.2.7.5. Financials (Based on Availability)
- 16.2.8 Agropur Ingredients
- 16.2.8.1. Overview
- 16.2.8.2. Products
- 16.2.8.3. SWOT Analysis
- 16.2.8.4. Recent Developments
- 16.2.8.5. Financials (Based on Availability)
- 16.2.1 Cargill Incorporated
List of Figures
- Figure 1: Global US Anti-Caking Agents Industry Revenue Breakdown (Million, %) by Region 2024 & 2032
- Figure 2: United states US Anti-Caking Agents Industry Revenue (Million), by Country 2024 & 2032
- Figure 3: United states US Anti-Caking Agents Industry Revenue Share (%), by Country 2024 & 2032
- Figure 4: North America US Anti-Caking Agents Industry Revenue (Million), by Type 2024 & 2032
- Figure 5: North America US Anti-Caking Agents Industry Revenue Share (%), by Type 2024 & 2032
- Figure 6: North America US Anti-Caking Agents Industry Revenue (Million), by Application 2024 & 2032
- Figure 7: North America US Anti-Caking Agents Industry Revenue Share (%), by Application 2024 & 2032
- Figure 8: North America US Anti-Caking Agents Industry Revenue (Million), by Country 2024 & 2032
- Figure 9: North America US Anti-Caking Agents Industry Revenue Share (%), by Country 2024 & 2032
- Figure 10: South America US Anti-Caking Agents Industry Revenue (Million), by Type 2024 & 2032
- Figure 11: South America US Anti-Caking Agents Industry Revenue Share (%), by Type 2024 & 2032
- Figure 12: South America US Anti-Caking Agents Industry Revenue (Million), by Application 2024 & 2032
- Figure 13: South America US Anti-Caking Agents Industry Revenue Share (%), by Application 2024 & 2032
- Figure 14: South America US Anti-Caking Agents Industry Revenue (Million), by Country 2024 & 2032
- Figure 15: South America US Anti-Caking Agents Industry Revenue Share (%), by Country 2024 & 2032
- Figure 16: Europe US Anti-Caking Agents Industry Revenue (Million), by Type 2024 & 2032
- Figure 17: Europe US Anti-Caking Agents Industry Revenue Share (%), by Type 2024 & 2032
- Figure 18: Europe US Anti-Caking Agents Industry Revenue (Million), by Application 2024 & 2032
- Figure 19: Europe US Anti-Caking Agents Industry Revenue Share (%), by Application 2024 & 2032
- Figure 20: Europe US Anti-Caking Agents Industry Revenue (Million), by Country 2024 & 2032
- Figure 21: Europe US Anti-Caking Agents Industry Revenue Share (%), by Country 2024 & 2032
- Figure 22: Middle East & Africa US Anti-Caking Agents Industry Revenue (Million), by Type 2024 & 2032
- Figure 23: Middle East & Africa US Anti-Caking Agents Industry Revenue Share (%), by Type 2024 & 2032
- Figure 24: Middle East & Africa US Anti-Caking Agents Industry Revenue (Million), by Application 2024 & 2032
- Figure 25: Middle East & Africa US Anti-Caking Agents Industry Revenue Share (%), by Application 2024 & 2032
- Figure 26: Middle East & Africa US Anti-Caking Agents Industry Revenue (Million), by Country 2024 & 2032
- Figure 27: Middle East & Africa US Anti-Caking Agents Industry Revenue Share (%), by Country 2024 & 2032
- Figure 28: Asia Pacific US Anti-Caking Agents Industry Revenue (Million), by Type 2024 & 2032
- Figure 29: Asia Pacific US Anti-Caking Agents Industry Revenue Share (%), by Type 2024 & 2032
- Figure 30: Asia Pacific US Anti-Caking Agents Industry Revenue (Million), by Application 2024 & 2032
- Figure 31: Asia Pacific US Anti-Caking Agents Industry Revenue Share (%), by Application 2024 & 2032
- Figure 32: Asia Pacific US Anti-Caking Agents Industry Revenue (Million), by Country 2024 & 2032
- Figure 33: Asia Pacific US Anti-Caking Agents Industry Revenue Share (%), by Country 2024 & 2032
List of Tables
- Table 1: Global US Anti-Caking Agents Industry Revenue Million Forecast, by Region 2019 & 2032
- Table 2: Global US Anti-Caking Agents Industry Revenue Million Forecast, by Type 2019 & 2032
- Table 3: Global US Anti-Caking Agents Industry Revenue Million Forecast, by Application 2019 & 2032
- Table 4: Global US Anti-Caking Agents Industry Revenue Million Forecast, by Region 2019 & 2032
- Table 5: Global US Anti-Caking Agents Industry Revenue Million Forecast, by Country 2019 & 2032
- Table 6: Northeast US Anti-Caking Agents Industry Revenue (Million) Forecast, by Application 2019 & 2032
- Table 7: Southeast US Anti-Caking Agents Industry Revenue (Million) Forecast, by Application 2019 & 2032
- Table 8: Midwest US Anti-Caking Agents Industry Revenue (Million) Forecast, by Application 2019 & 2032
- Table 9: Southwest US Anti-Caking Agents Industry Revenue (Million) Forecast, by Application 2019 & 2032
- Table 10: West US Anti-Caking Agents Industry Revenue (Million) Forecast, by Application 2019 & 2032
- Table 11: Global US Anti-Caking Agents Industry Revenue Million Forecast, by Type 2019 & 2032
- Table 12: Global US Anti-Caking Agents Industry Revenue Million Forecast, by Application 2019 & 2032
- Table 13: Global US Anti-Caking Agents Industry Revenue Million Forecast, by Country 2019 & 2032
- Table 14: United States US Anti-Caking Agents Industry Revenue (Million) Forecast, by Application 2019 & 2032
- Table 15: Canada US Anti-Caking Agents Industry Revenue (Million) Forecast, by Application 2019 & 2032
- Table 16: Mexico US Anti-Caking Agents Industry Revenue (Million) Forecast, by Application 2019 & 2032
- Table 17: Global US Anti-Caking Agents Industry Revenue Million Forecast, by Type 2019 & 2032
- Table 18: Global US Anti-Caking Agents Industry Revenue Million Forecast, by Application 2019 & 2032
- Table 19: Global US Anti-Caking Agents Industry Revenue Million Forecast, by Country 2019 & 2032
- Table 20: Brazil US Anti-Caking Agents Industry Revenue (Million) Forecast, by Application 2019 & 2032
- Table 21: Argentina US Anti-Caking Agents Industry Revenue (Million) Forecast, by Application 2019 & 2032
- Table 22: Rest of South America US Anti-Caking Agents Industry Revenue (Million) Forecast, by Application 2019 & 2032
- Table 23: Global US Anti-Caking Agents Industry Revenue Million Forecast, by Type 2019 & 2032
- Table 24: Global US Anti-Caking Agents Industry Revenue Million Forecast, by Application 2019 & 2032
- Table 25: Global US Anti-Caking Agents Industry Revenue Million Forecast, by Country 2019 & 2032
- Table 26: United Kingdom US Anti-Caking Agents Industry Revenue (Million) Forecast, by Application 2019 & 2032
- Table 27: Germany US Anti-Caking Agents Industry Revenue (Million) Forecast, by Application 2019 & 2032
- Table 28: France US Anti-Caking Agents Industry Revenue (Million) Forecast, by Application 2019 & 2032
- Table 29: Italy US Anti-Caking Agents Industry Revenue (Million) Forecast, by Application 2019 & 2032
- Table 30: Spain US Anti-Caking Agents Industry Revenue (Million) Forecast, by Application 2019 & 2032
- Table 31: Russia US Anti-Caking Agents Industry Revenue (Million) Forecast, by Application 2019 & 2032
- Table 32: Benelux US Anti-Caking Agents Industry Revenue (Million) Forecast, by Application 2019 & 2032
- Table 33: Nordics US Anti-Caking Agents Industry Revenue (Million) Forecast, by Application 2019 & 2032
- Table 34: Rest of Europe US Anti-Caking Agents Industry Revenue (Million) Forecast, by Application 2019 & 2032
- Table 35: Global US Anti-Caking Agents Industry Revenue Million Forecast, by Type 2019 & 2032
- Table 36: Global US Anti-Caking Agents Industry Revenue Million Forecast, by Application 2019 & 2032
- Table 37: Global US Anti-Caking Agents Industry Revenue Million Forecast, by Country 2019 & 2032
- Table 38: Turkey US Anti-Caking Agents Industry Revenue (Million) Forecast, by Application 2019 & 2032
- Table 39: Israel US Anti-Caking Agents Industry Revenue (Million) Forecast, by Application 2019 & 2032
- Table 40: GCC US Anti-Caking Agents Industry Revenue (Million) Forecast, by Application 2019 & 2032
- Table 41: North Africa US Anti-Caking Agents Industry Revenue (Million) Forecast, by Application 2019 & 2032
- Table 42: South Africa US Anti-Caking Agents Industry Revenue (Million) Forecast, by Application 2019 & 2032
- Table 43: Rest of Middle East & Africa US Anti-Caking Agents Industry Revenue (Million) Forecast, by Application 2019 & 2032
- Table 44: Global US Anti-Caking Agents Industry Revenue Million Forecast, by Type 2019 & 2032
- Table 45: Global US Anti-Caking Agents Industry Revenue Million Forecast, by Application 2019 & 2032
- Table 46: Global US Anti-Caking Agents Industry Revenue Million Forecast, by Country 2019 & 2032
- Table 47: China US Anti-Caking Agents Industry Revenue (Million) Forecast, by Application 2019 & 2032
- Table 48: India US Anti-Caking Agents Industry Revenue (Million) Forecast, by Application 2019 & 2032
- Table 49: Japan US Anti-Caking Agents Industry Revenue (Million) Forecast, by Application 2019 & 2032
- Table 50: South Korea US Anti-Caking Agents Industry Revenue (Million) Forecast, by Application 2019 & 2032
- Table 51: ASEAN US Anti-Caking Agents Industry Revenue (Million) Forecast, by Application 2019 & 2032
- Table 52: Oceania US Anti-Caking Agents Industry Revenue (Million) Forecast, by Application 2019 & 2032
- Table 53: Rest of Asia Pacific US Anti-Caking Agents Industry Revenue (Million) Forecast, by Application 2019 & 2032
Frequently Asked Questions
1. What is the projected Compound Annual Growth Rate (CAGR) of the US Anti-Caking Agents Industry?
The projected CAGR is approximately 5.23%.
2. Which companies are prominent players in the US Anti-Caking Agents Industry?
Key companies in the market include Cargill Incorporated, PQ Corporation*List Not Exhaustive, The Archer Daniels Midland Company, DuPont de Nemours Inc, Tate & Lyle PLC, BASF SE, Imac Inc, Agropur Ingredients.
3. What are the main segments of the US Anti-Caking Agents Industry?
The market segments include Type, Application.
4. Can you provide details about the market size?
The market size is estimated to be USD XX Million as of 2022.
5. What are some drivers contributing to market growth?
Wide Applications and Functionality; Demand For Gluten-Free Products.
6. What are the notable trends driving market growth?
Calcium Compounds Holds a Significant Share.
7. Are there any restraints impacting market growth?
Easy Availability of Economically Feasible Alternatives.
8. Can you provide examples of recent developments in the market?
1. In 2021, Cargill acquired Penford Products, a leading provider of anti-caking agents for the food industry. 2. In 2022, BASF launched a new line of organic anti-caking agents for the food and beverage industry. 3. In 2023, PQ Corporation announced a joint venture with a Chinese company to expand its production of anti-caking agents in Asia.
9. What pricing options are available for accessing the report?
Pricing options include single-user, multi-user, and enterprise licenses priced at USD 3800, USD 4500, and USD 5800 respectively.
10. Is the market size provided in terms of value or volume?
The market size is provided in terms of value, measured in Million.
11. Are there any specific market keywords associated with the report?
Yes, the market keyword associated with the report is "US Anti-Caking Agents Industry," which aids in identifying and referencing the specific market segment covered.
12. How do I determine which pricing option suits my needs best?
The pricing options vary based on user requirements and access needs. Individual users may opt for single-user licenses, while businesses requiring broader access may choose multi-user or enterprise licenses for cost-effective access to the report.
13. Are there any additional resources or data provided in the US Anti-Caking Agents Industry report?
While the report offers comprehensive insights, it's advisable to review the specific contents or supplementary materials provided to ascertain if additional resources or data are available.
14. How can I stay updated on further developments or reports in the US Anti-Caking Agents Industry?
To stay informed about further developments, trends, and reports in the US Anti-Caking Agents Industry, consider subscribing to industry newsletters, following relevant companies and organizations, or regularly checking reputable industry news sources and publications.
Methodology
Step 1 - Identification of Relevant Samples Size from Population Database


Step 2 - Approaches for Defining Global Market Size (Value, Volume* & Price*)

Note*: In applicable scenarios
Step 3 - Data Sources
Primary Research
- Web Analytics
- Survey Reports
- Research Institute
- Latest Research Reports
- Opinion Leaders
Secondary Research
- Annual Reports
- White Paper
- Latest Press Release
- Industry Association
- Paid Database
- Investor Presentations

Step 4 - Data Triangulation
Involves using different sources of information in order to increase the validity of a study
These sources are likely to be stakeholders in a program - participants, other researchers, program staff, other community members, and so on.
Then we put all data in single framework & apply various statistical tools to find out the dynamic on the market.
During the analysis stage, feedback from the stakeholder groups would be compared to determine areas of agreement as well as areas of divergence
