

Key Insights
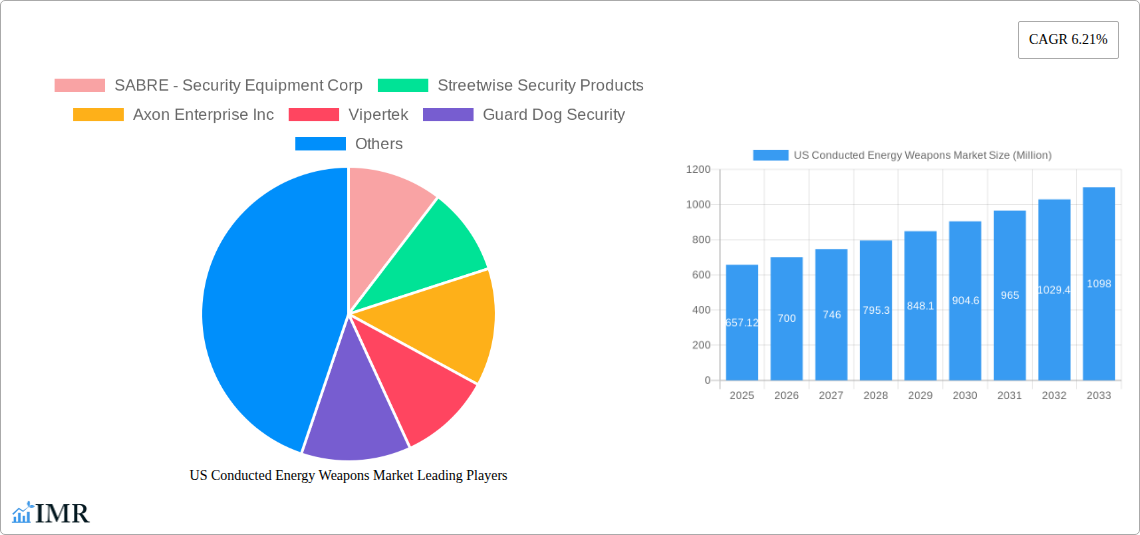
The US Conducted Energy Weapons (CEW) market, valued at $657.12 million in 2025, is projected to experience robust growth, driven by increasing demand from law enforcement agencies and a rising awareness of personal safety among consumers. The market's Compound Annual Growth Rate (CAGR) of 6.21% from 2025 to 2033 indicates a significant expansion over the forecast period. Key drivers include the growing adoption of less-lethal alternatives to firearms by law enforcement, improved CEW technology offering enhanced safety and effectiveness, and a rise in personal security concerns leading to increased consumer purchases. Market segmentation reveals strong demand across various CEW types, including stun guns, tasers, and stun batons, with law enforcement agencies representing a significant portion of the end-user market. Leading companies like Axon Enterprise, SABRE, and Vipertek are at the forefront of innovation, continuously developing advanced CEW models with improved features and functionalities. Regional analysis indicates strong growth across all US regions, reflecting the widespread adoption of CEWs nationwide. The historical period (2019-2024) likely witnessed a steady growth trajectory, laying the foundation for the projected expansion in the forecast period.
The continued technological advancements in CEW technology, including improved battery life, ergonomics, and safety features, are expected to further fuel market growth. Furthermore, stringent regulations regarding the use of lethal force by law enforcement are likely to drive the adoption of CEWs as a safer alternative. However, potential restraints include concerns regarding misuse, potential for injury, and ongoing debates surrounding the ethical implications of CEW deployment. Despite these concerns, the overall market outlook remains positive, fueled by increasing demand from both the public and law enforcement sectors, pointing towards a significant expansion of the US CEW market in the coming years. The market will likely see increased competition and innovation as companies strive to meet the growing demand for advanced and reliable CEW products.
US Conducted Energy Weapons Market: A Comprehensive Analysis (2019-2033)
This comprehensive report provides an in-depth analysis of the US Conducted Energy Weapons (CEW) market, encompassing market dynamics, growth trends, regional segmentation, product landscape, key players, and future outlook. The report covers the period from 2019 to 2033, with 2025 serving as the base and estimated year. This analysis will be invaluable for industry professionals, investors, and strategic decision-makers seeking to understand this dynamic market. The parent market is the broader security and safety equipment market, while the child market focuses specifically on less-lethal weapons. The market size is projected to reach xx Million by 2033.
US Conducted Energy Weapons Market Market Dynamics & Structure
The US CEW market is characterized by moderate concentration, with key players holding significant market share, but also seeing the emergence of smaller, specialized firms. Technological innovation, driven by advancements in energy delivery, safety features, and data recording capabilities, is a primary driver. Stringent regulatory frameworks governing CEW use and safety standards shape market dynamics. Competitive substitutes, such as pepper spray and other less-lethal options, exert pressure. The end-user demographic comprises law enforcement agencies and increasingly, personal consumers. M&A activity has been relatively moderate in recent years, with xx deals recorded between 2019 and 2024.
- Market Concentration: Moderately concentrated, with the top 5 players holding approximately xx% of the market share in 2025.
- Technological Innovation: Focus on improved accuracy, reduced risk of collateral damage, and enhanced data logging features.
- Regulatory Framework: Stringent regulations regarding CEW use by law enforcement, impacting market growth and product development.
- Competitive Substitutes: Pepper spray, batons, and other less-lethal options compete for market share.
- End-User Demographics: Law enforcement agencies account for xx% of the market, with personal use accounting for the remaining xx%.
- M&A Trends: xx M&A deals recorded between 2019 and 2024, indicating a moderate level of consolidation.
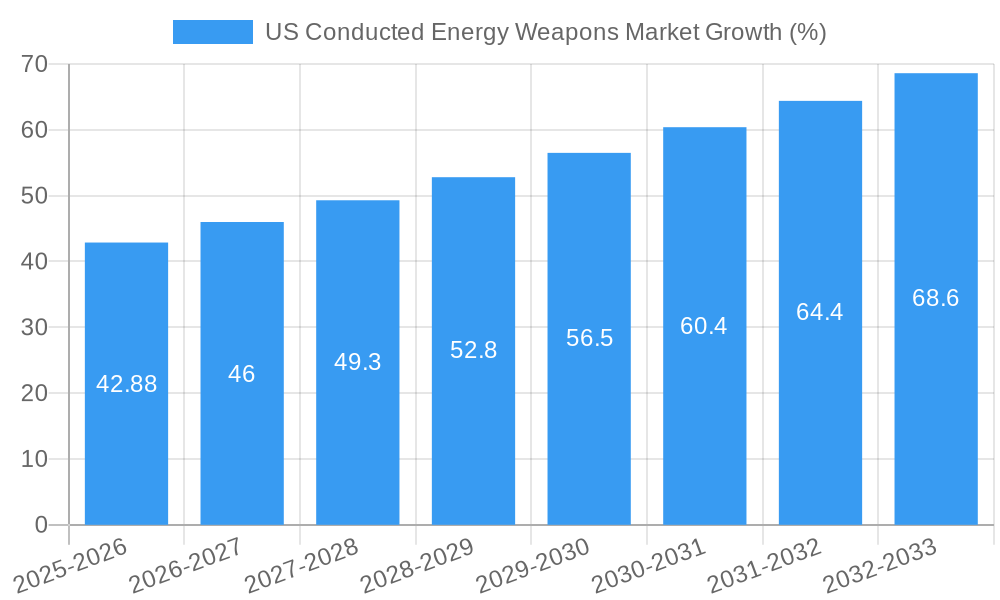
US Conducted Energy Weapons Market Growth Trends & Insights
The US CEW market experienced a Compound Annual Growth Rate (CAGR) of xx% during the historical period (2019-2024). This growth is projected to continue at a CAGR of xx% during the forecast period (2025-2033), driven by increasing demand from law enforcement agencies seeking safer alternatives to firearms and rising concerns about personal safety among consumers. Technological advancements, such as improved battery life and more sophisticated targeting systems, are also contributing to growth. Market penetration is expected to reach xx% by 2033, indicating significant potential for future expansion. Consumer behavior is shifting toward a preference for technologically advanced CEWs with enhanced safety features.
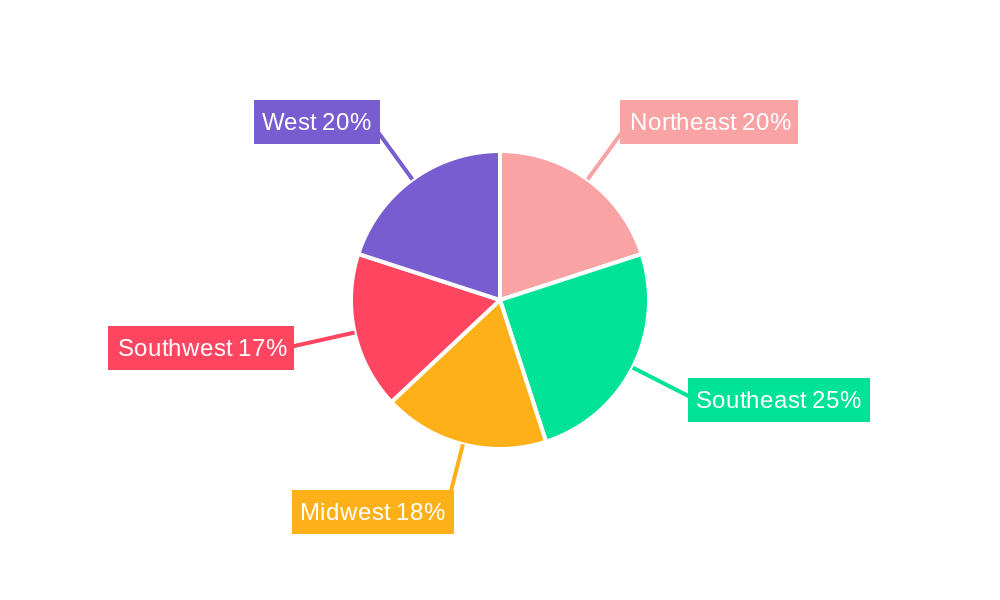
Dominant Regions, Countries, or Segments in US Conducted Energy Weapons Market
The market is geographically dispersed across the US, with no single region exhibiting absolute dominance. However, states with larger law enforcement agencies and higher crime rates generally show greater demand. Among the product segments, stun guns currently hold the largest market share (xx%), followed by tasers (xx%) and stun batons (xx%). Within the equipment type segment, weapons dominate, followed by cartridges. The law enforcement segment accounts for the largest portion (xx%) of the end-user market.
- Key Drivers: Increased funding for law enforcement, rising crime rates in certain regions, and growing awareness of personal safety concerns.
- Dominance Factors: Market size variations across regions, coupled with variations in crime rates and law enforcement budgets.
- Growth Potential: High potential in regions with increasing crime rates and growing awareness of personal safety.
US Conducted Energy Weapons Market Product Landscape
The US CEW market offers a range of products, including stun guns, tasers, and stun batons, each with varying functionalities and features. Recent innovations focus on improved ergonomics, enhanced safety mechanisms (such as accidental discharge prevention), longer battery life, and more accurate targeting systems. Manufacturers emphasize features like ease of use, reliability, and reduced risk of injury. Technological advancements continuously improve the effectiveness and safety of CEWs.
Key Drivers, Barriers & Challenges in US Conducted Energy Weapons Market
Key Drivers:
- Increased demand from law enforcement for less-lethal alternatives to firearms.
- Growing concerns about personal safety among civilians.
- Technological advancements leading to improved safety and effectiveness of CEWs.
Challenges & Restraints:
- Stringent regulatory frameworks and potential liability concerns.
- The risk of misuse and associated ethical considerations.
- Competitive pressure from other less-lethal options.
Emerging Opportunities in US Conducted Energy Weapons Market
- Development of CEWs with enhanced targeting capabilities and reduced collateral damage.
- Expanding market penetration into the personal safety and security sector.
- Exploring new applications of CEW technology in areas such as animal control and crowd management.
Growth Accelerators in the US Conducted Energy Weapons Market Industry
Continued technological innovation, strategic partnerships between manufacturers and law enforcement agencies, and expansion into new markets (e.g., private security) will be key drivers of long-term growth. The development of advanced features and increased awareness of the safety benefits of CEWs will also contribute to market expansion.
Key Players Shaping the US Conducted Energy Weapons Market Market
- SABRE - Security Equipment Corp
- Streetwise Security Products
- Axon Enterprise Inc
- Vipertek
- Guard Dog Security
- PhaZZer LL
- Foxfend
Notable Milestones in US Conducted Energy Weapons Market Sector
- 2020: Axon Enterprise Inc. launched a new Taser model with improved safety features.
- 2022: New regulations concerning CEW use were implemented in several states.
- 2023: SABRE Corporation announced a strategic partnership with a major law enforcement agency.
In-Depth US Conducted Energy Weapons Market Market Outlook
The US CEW market is poised for sustained growth driven by ongoing technological advancements, increased demand from both law enforcement and personal users, and the expansion into new applications. Strategic partnerships and product diversification will further propel market expansion, making it an attractive sector for investment and future growth.
US Conducted Energy Weapons Market Segmentation
- 1. Production Analysis
- 2. Consumption Analysis
- 3. Import Market Analysis (Value & Volume)
- 4. Export Market Analysis (Value & Volume)
- 5. Price Trend Analysis
US Conducted Energy Weapons Market Segmentation By Geography
-
1. North America
- 1.1. United States
- 1.2. Canada
- 1.3. Mexico
-
2. South America
- 2.1. Brazil
- 2.2. Argentina
- 2.3. Rest of South America
-
3. Europe
- 3.1. United Kingdom
- 3.2. Germany
- 3.3. France
- 3.4. Italy
- 3.5. Spain
- 3.6. Russia
- 3.7. Benelux
- 3.8. Nordics
- 3.9. Rest of Europe
-
4. Middle East & Africa
- 4.1. Turkey
- 4.2. Israel
- 4.3. GCC
- 4.4. North Africa
- 4.5. South Africa
- 4.6. Rest of Middle East & Africa
-
5. Asia Pacific
- 5.1. China
- 5.2. India
- 5.3. Japan
- 5.4. South Korea
- 5.5. ASEAN
- 5.6. Oceania
- 5.7. Rest of Asia Pacific
US Conducted Energy Weapons Market REPORT HIGHLIGHTS
| Aspects | Details |
|---|---|
| Study Period | 2019-2033 |
| Base Year | 2024 |
| Estimated Year | 2025 |
| Forecast Period | 2025-2033 |
| Historical Period | 2019-2024 |
| Growth Rate | CAGR of 6.21% from 2019-2033 |
| Segmentation |
|
Table of Contents
- 1. Introduction
- 1.1. Research Scope
- 1.2. Market Segmentation
- 1.3. Research Methodology
- 1.4. Definitions and Assumptions
- 2. Executive Summary
- 2.1. Introduction
- 3. Market Dynamics
- 3.1. Introduction
- 3.2. Market Drivers
- 3.2.1. ; Increased Seaborne Threats And Ambiguous Maritime Security Policies; Increasing Adoption Of Security Technologies In Bric Countries
- 3.3. Market Restrains
- 3.3.1. ; High Risk Rate In Ungoverned Zones; Unstructured Security Standards And Technologies
- 3.4. Market Trends
- 3.4.1. Increasing Incidents of Civil Unrest Driving Procurement
- 4. Market Factor Analysis
- 4.1. Porters Five Forces
- 4.2. Supply/Value Chain
- 4.3. PESTEL analysis
- 4.4. Market Entropy
- 4.5. Patent/Trademark Analysis
- 5. Global US Conducted Energy Weapons Market Analysis, Insights and Forecast, 2019-2031
- 5.1. Market Analysis, Insights and Forecast - by Production Analysis
- 5.2. Market Analysis, Insights and Forecast - by Consumption Analysis
- 5.3. Market Analysis, Insights and Forecast - by Import Market Analysis (Value & Volume)
- 5.4. Market Analysis, Insights and Forecast - by Export Market Analysis (Value & Volume)
- 5.5. Market Analysis, Insights and Forecast - by Price Trend Analysis
- 5.6. Market Analysis, Insights and Forecast - by Region
- 5.6.1. North America
- 5.6.2. South America
- 5.6.3. Europe
- 5.6.4. Middle East & Africa
- 5.6.5. Asia Pacific
- 5.1. Market Analysis, Insights and Forecast - by Production Analysis
- 6. North America US Conducted Energy Weapons Market Analysis, Insights and Forecast, 2019-2031
- 6.1. Market Analysis, Insights and Forecast - by Production Analysis
- 6.2. Market Analysis, Insights and Forecast - by Consumption Analysis
- 6.3. Market Analysis, Insights and Forecast - by Import Market Analysis (Value & Volume)
- 6.4. Market Analysis, Insights and Forecast - by Export Market Analysis (Value & Volume)
- 6.5. Market Analysis, Insights and Forecast - by Price Trend Analysis
- 6.1. Market Analysis, Insights and Forecast - by Production Analysis
- 7. South America US Conducted Energy Weapons Market Analysis, Insights and Forecast, 2019-2031
- 7.1. Market Analysis, Insights and Forecast - by Production Analysis
- 7.2. Market Analysis, Insights and Forecast - by Consumption Analysis
- 7.3. Market Analysis, Insights and Forecast - by Import Market Analysis (Value & Volume)
- 7.4. Market Analysis, Insights and Forecast - by Export Market Analysis (Value & Volume)
- 7.5. Market Analysis, Insights and Forecast - by Price Trend Analysis
- 7.1. Market Analysis, Insights and Forecast - by Production Analysis
- 8. Europe US Conducted Energy Weapons Market Analysis, Insights and Forecast, 2019-2031
- 8.1. Market Analysis, Insights and Forecast - by Production Analysis
- 8.2. Market Analysis, Insights and Forecast - by Consumption Analysis
- 8.3. Market Analysis, Insights and Forecast - by Import Market Analysis (Value & Volume)
- 8.4. Market Analysis, Insights and Forecast - by Export Market Analysis (Value & Volume)
- 8.5. Market Analysis, Insights and Forecast - by Price Trend Analysis
- 8.1. Market Analysis, Insights and Forecast - by Production Analysis
- 9. Middle East & Africa US Conducted Energy Weapons Market Analysis, Insights and Forecast, 2019-2031
- 9.1. Market Analysis, Insights and Forecast - by Production Analysis
- 9.2. Market Analysis, Insights and Forecast - by Consumption Analysis
- 9.3. Market Analysis, Insights and Forecast - by Import Market Analysis (Value & Volume)
- 9.4. Market Analysis, Insights and Forecast - by Export Market Analysis (Value & Volume)
- 9.5. Market Analysis, Insights and Forecast - by Price Trend Analysis
- 9.1. Market Analysis, Insights and Forecast - by Production Analysis
- 10. Asia Pacific US Conducted Energy Weapons Market Analysis, Insights and Forecast, 2019-2031
- 10.1. Market Analysis, Insights and Forecast - by Production Analysis
- 10.2. Market Analysis, Insights and Forecast - by Consumption Analysis
- 10.3. Market Analysis, Insights and Forecast - by Import Market Analysis (Value & Volume)
- 10.4. Market Analysis, Insights and Forecast - by Export Market Analysis (Value & Volume)
- 10.5. Market Analysis, Insights and Forecast - by Price Trend Analysis
- 10.1. Market Analysis, Insights and Forecast - by Production Analysis
- 11. Northeast US Conducted Energy Weapons Market Analysis, Insights and Forecast, 2019-2031
- 12. Southeast US Conducted Energy Weapons Market Analysis, Insights and Forecast, 2019-2031
- 13. Midwest US Conducted Energy Weapons Market Analysis, Insights and Forecast, 2019-2031
- 14. Southwest US Conducted Energy Weapons Market Analysis, Insights and Forecast, 2019-2031
- 15. West US Conducted Energy Weapons Market Analysis, Insights and Forecast, 2019-2031
- 16. Competitive Analysis
- 16.1. Global Market Share Analysis 2024
- 16.2. Company Profiles
- 16.2.1 SABRE - Security Equipment Corp
- 16.2.1.1. Overview
- 16.2.1.2. Products
- 16.2.1.3. SWOT Analysis
- 16.2.1.4. Recent Developments
- 16.2.1.5. Financials (Based on Availability)
- 16.2.2 Streetwise Security Products
- 16.2.2.1. Overview
- 16.2.2.2. Products
- 16.2.2.3. SWOT Analysis
- 16.2.2.4. Recent Developments
- 16.2.2.5. Financials (Based on Availability)
- 16.2.3 Axon Enterprise Inc
- 16.2.3.1. Overview
- 16.2.3.2. Products
- 16.2.3.3. SWOT Analysis
- 16.2.3.4. Recent Developments
- 16.2.3.5. Financials (Based on Availability)
- 16.2.4 Vipertek
- 16.2.4.1. Overview
- 16.2.4.2. Products
- 16.2.4.3. SWOT Analysis
- 16.2.4.4. Recent Developments
- 16.2.4.5. Financials (Based on Availability)
- 16.2.5 Guard Dog Security
- 16.2.5.1. Overview
- 16.2.5.2. Products
- 16.2.5.3. SWOT Analysis
- 16.2.5.4. Recent Developments
- 16.2.5.5. Financials (Based on Availability)
- 16.2.6 PhaZZer LL
- 16.2.6.1. Overview
- 16.2.6.2. Products
- 16.2.6.3. SWOT Analysis
- 16.2.6.4. Recent Developments
- 16.2.6.5. Financials (Based on Availability)
- 16.2.7 Foxfend
- 16.2.7.1. Overview
- 16.2.7.2. Products
- 16.2.7.3. SWOT Analysis
- 16.2.7.4. Recent Developments
- 16.2.7.5. Financials (Based on Availability)
- 16.2.1 SABRE - Security Equipment Corp
List of Figures
- Figure 1: Global US Conducted Energy Weapons Market Revenue Breakdown (Million, %) by Region 2024 & 2032
- Figure 2: United states US Conducted Energy Weapons Market Revenue (Million), by Country 2024 & 2032
- Figure 3: United states US Conducted Energy Weapons Market Revenue Share (%), by Country 2024 & 2032
- Figure 4: North America US Conducted Energy Weapons Market Revenue (Million), by Production Analysis 2024 & 2032
- Figure 5: North America US Conducted Energy Weapons Market Revenue Share (%), by Production Analysis 2024 & 2032
- Figure 6: North America US Conducted Energy Weapons Market Revenue (Million), by Consumption Analysis 2024 & 2032
- Figure 7: North America US Conducted Energy Weapons Market Revenue Share (%), by Consumption Analysis 2024 & 2032
- Figure 8: North America US Conducted Energy Weapons Market Revenue (Million), by Import Market Analysis (Value & Volume) 2024 & 2032
- Figure 9: North America US Conducted Energy Weapons Market Revenue Share (%), by Import Market Analysis (Value & Volume) 2024 & 2032
- Figure 10: North America US Conducted Energy Weapons Market Revenue (Million), by Export Market Analysis (Value & Volume) 2024 & 2032
- Figure 11: North America US Conducted Energy Weapons Market Revenue Share (%), by Export Market Analysis (Value & Volume) 2024 & 2032
- Figure 12: North America US Conducted Energy Weapons Market Revenue (Million), by Price Trend Analysis 2024 & 2032
- Figure 13: North America US Conducted Energy Weapons Market Revenue Share (%), by Price Trend Analysis 2024 & 2032
- Figure 14: North America US Conducted Energy Weapons Market Revenue (Million), by Country 2024 & 2032
- Figure 15: North America US Conducted Energy Weapons Market Revenue Share (%), by Country 2024 & 2032
- Figure 16: South America US Conducted Energy Weapons Market Revenue (Million), by Production Analysis 2024 & 2032
- Figure 17: South America US Conducted Energy Weapons Market Revenue Share (%), by Production Analysis 2024 & 2032
- Figure 18: South America US Conducted Energy Weapons Market Revenue (Million), by Consumption Analysis 2024 & 2032
- Figure 19: South America US Conducted Energy Weapons Market Revenue Share (%), by Consumption Analysis 2024 & 2032
- Figure 20: South America US Conducted Energy Weapons Market Revenue (Million), by Import Market Analysis (Value & Volume) 2024 & 2032
- Figure 21: South America US Conducted Energy Weapons Market Revenue Share (%), by Import Market Analysis (Value & Volume) 2024 & 2032
- Figure 22: South America US Conducted Energy Weapons Market Revenue (Million), by Export Market Analysis (Value & Volume) 2024 & 2032
- Figure 23: South America US Conducted Energy Weapons Market Revenue Share (%), by Export Market Analysis (Value & Volume) 2024 & 2032
- Figure 24: South America US Conducted Energy Weapons Market Revenue (Million), by Price Trend Analysis 2024 & 2032
- Figure 25: South America US Conducted Energy Weapons Market Revenue Share (%), by Price Trend Analysis 2024 & 2032
- Figure 26: South America US Conducted Energy Weapons Market Revenue (Million), by Country 2024 & 2032
- Figure 27: South America US Conducted Energy Weapons Market Revenue Share (%), by Country 2024 & 2032
- Figure 28: Europe US Conducted Energy Weapons Market Revenue (Million), by Production Analysis 2024 & 2032
- Figure 29: Europe US Conducted Energy Weapons Market Revenue Share (%), by Production Analysis 2024 & 2032
- Figure 30: Europe US Conducted Energy Weapons Market Revenue (Million), by Consumption Analysis 2024 & 2032
- Figure 31: Europe US Conducted Energy Weapons Market Revenue Share (%), by Consumption Analysis 2024 & 2032
- Figure 32: Europe US Conducted Energy Weapons Market Revenue (Million), by Import Market Analysis (Value & Volume) 2024 & 2032
- Figure 33: Europe US Conducted Energy Weapons Market Revenue Share (%), by Import Market Analysis (Value & Volume) 2024 & 2032
- Figure 34: Europe US Conducted Energy Weapons Market Revenue (Million), by Export Market Analysis (Value & Volume) 2024 & 2032
- Figure 35: Europe US Conducted Energy Weapons Market Revenue Share (%), by Export Market Analysis (Value & Volume) 2024 & 2032
- Figure 36: Europe US Conducted Energy Weapons Market Revenue (Million), by Price Trend Analysis 2024 & 2032
- Figure 37: Europe US Conducted Energy Weapons Market Revenue Share (%), by Price Trend Analysis 2024 & 2032
- Figure 38: Europe US Conducted Energy Weapons Market Revenue (Million), by Country 2024 & 2032
- Figure 39: Europe US Conducted Energy Weapons Market Revenue Share (%), by Country 2024 & 2032
- Figure 40: Middle East & Africa US Conducted Energy Weapons Market Revenue (Million), by Production Analysis 2024 & 2032
- Figure 41: Middle East & Africa US Conducted Energy Weapons Market Revenue Share (%), by Production Analysis 2024 & 2032
- Figure 42: Middle East & Africa US Conducted Energy Weapons Market Revenue (Million), by Consumption Analysis 2024 & 2032
- Figure 43: Middle East & Africa US Conducted Energy Weapons Market Revenue Share (%), by Consumption Analysis 2024 & 2032
- Figure 44: Middle East & Africa US Conducted Energy Weapons Market Revenue (Million), by Import Market Analysis (Value & Volume) 2024 & 2032
- Figure 45: Middle East & Africa US Conducted Energy Weapons Market Revenue Share (%), by Import Market Analysis (Value & Volume) 2024 & 2032
- Figure 46: Middle East & Africa US Conducted Energy Weapons Market Revenue (Million), by Export Market Analysis (Value & Volume) 2024 & 2032
- Figure 47: Middle East & Africa US Conducted Energy Weapons Market Revenue Share (%), by Export Market Analysis (Value & Volume) 2024 & 2032
- Figure 48: Middle East & Africa US Conducted Energy Weapons Market Revenue (Million), by Price Trend Analysis 2024 & 2032
- Figure 49: Middle East & Africa US Conducted Energy Weapons Market Revenue Share (%), by Price Trend Analysis 2024 & 2032
- Figure 50: Middle East & Africa US Conducted Energy Weapons Market Revenue (Million), by Country 2024 & 2032
- Figure 51: Middle East & Africa US Conducted Energy Weapons Market Revenue Share (%), by Country 2024 & 2032
- Figure 52: Asia Pacific US Conducted Energy Weapons Market Revenue (Million), by Production Analysis 2024 & 2032
- Figure 53: Asia Pacific US Conducted Energy Weapons Market Revenue Share (%), by Production Analysis 2024 & 2032
- Figure 54: Asia Pacific US Conducted Energy Weapons Market Revenue (Million), by Consumption Analysis 2024 & 2032
- Figure 55: Asia Pacific US Conducted Energy Weapons Market Revenue Share (%), by Consumption Analysis 2024 & 2032
- Figure 56: Asia Pacific US Conducted Energy Weapons Market Revenue (Million), by Import Market Analysis (Value & Volume) 2024 & 2032
- Figure 57: Asia Pacific US Conducted Energy Weapons Market Revenue Share (%), by Import Market Analysis (Value & Volume) 2024 & 2032
- Figure 58: Asia Pacific US Conducted Energy Weapons Market Revenue (Million), by Export Market Analysis (Value & Volume) 2024 & 2032
- Figure 59: Asia Pacific US Conducted Energy Weapons Market Revenue Share (%), by Export Market Analysis (Value & Volume) 2024 & 2032
- Figure 60: Asia Pacific US Conducted Energy Weapons Market Revenue (Million), by Price Trend Analysis 2024 & 2032
- Figure 61: Asia Pacific US Conducted Energy Weapons Market Revenue Share (%), by Price Trend Analysis 2024 & 2032
- Figure 62: Asia Pacific US Conducted Energy Weapons Market Revenue (Million), by Country 2024 & 2032
- Figure 63: Asia Pacific US Conducted Energy Weapons Market Revenue Share (%), by Country 2024 & 2032
List of Tables
- Table 1: Global US Conducted Energy Weapons Market Revenue Million Forecast, by Region 2019 & 2032
- Table 2: Global US Conducted Energy Weapons Market Revenue Million Forecast, by Production Analysis 2019 & 2032
- Table 3: Global US Conducted Energy Weapons Market Revenue Million Forecast, by Consumption Analysis 2019 & 2032
- Table 4: Global US Conducted Energy Weapons Market Revenue Million Forecast, by Import Market Analysis (Value & Volume) 2019 & 2032
- Table 5: Global US Conducted Energy Weapons Market Revenue Million Forecast, by Export Market Analysis (Value & Volume) 2019 & 2032
- Table 6: Global US Conducted Energy Weapons Market Revenue Million Forecast, by Price Trend Analysis 2019 & 2032
- Table 7: Global US Conducted Energy Weapons Market Revenue Million Forecast, by Region 2019 & 2032
- Table 8: Global US Conducted Energy Weapons Market Revenue Million Forecast, by Country 2019 & 2032
- Table 9: Northeast US Conducted Energy Weapons Market Revenue (Million) Forecast, by Application 2019 & 2032
- Table 10: Southeast US Conducted Energy Weapons Market Revenue (Million) Forecast, by Application 2019 & 2032
- Table 11: Midwest US Conducted Energy Weapons Market Revenue (Million) Forecast, by Application 2019 & 2032
- Table 12: Southwest US Conducted Energy Weapons Market Revenue (Million) Forecast, by Application 2019 & 2032
- Table 13: West US Conducted Energy Weapons Market Revenue (Million) Forecast, by Application 2019 & 2032
- Table 14: Global US Conducted Energy Weapons Market Revenue Million Forecast, by Production Analysis 2019 & 2032
- Table 15: Global US Conducted Energy Weapons Market Revenue Million Forecast, by Consumption Analysis 2019 & 2032
- Table 16: Global US Conducted Energy Weapons Market Revenue Million Forecast, by Import Market Analysis (Value & Volume) 2019 & 2032
- Table 17: Global US Conducted Energy Weapons Market Revenue Million Forecast, by Export Market Analysis (Value & Volume) 2019 & 2032
- Table 18: Global US Conducted Energy Weapons Market Revenue Million Forecast, by Price Trend Analysis 2019 & 2032
- Table 19: Global US Conducted Energy Weapons Market Revenue Million Forecast, by Country 2019 & 2032
- Table 20: United States US Conducted Energy Weapons Market Revenue (Million) Forecast, by Application 2019 & 2032
- Table 21: Canada US Conducted Energy Weapons Market Revenue (Million) Forecast, by Application 2019 & 2032
- Table 22: Mexico US Conducted Energy Weapons Market Revenue (Million) Forecast, by Application 2019 & 2032
- Table 23: Global US Conducted Energy Weapons Market Revenue Million Forecast, by Production Analysis 2019 & 2032
- Table 24: Global US Conducted Energy Weapons Market Revenue Million Forecast, by Consumption Analysis 2019 & 2032
- Table 25: Global US Conducted Energy Weapons Market Revenue Million Forecast, by Import Market Analysis (Value & Volume) 2019 & 2032
- Table 26: Global US Conducted Energy Weapons Market Revenue Million Forecast, by Export Market Analysis (Value & Volume) 2019 & 2032
- Table 27: Global US Conducted Energy Weapons Market Revenue Million Forecast, by Price Trend Analysis 2019 & 2032
- Table 28: Global US Conducted Energy Weapons Market Revenue Million Forecast, by Country 2019 & 2032
- Table 29: Brazil US Conducted Energy Weapons Market Revenue (Million) Forecast, by Application 2019 & 2032
- Table 30: Argentina US Conducted Energy Weapons Market Revenue (Million) Forecast, by Application 2019 & 2032
- Table 31: Rest of South America US Conducted Energy Weapons Market Revenue (Million) Forecast, by Application 2019 & 2032
- Table 32: Global US Conducted Energy Weapons Market Revenue Million Forecast, by Production Analysis 2019 & 2032
- Table 33: Global US Conducted Energy Weapons Market Revenue Million Forecast, by Consumption Analysis 2019 & 2032
- Table 34: Global US Conducted Energy Weapons Market Revenue Million Forecast, by Import Market Analysis (Value & Volume) 2019 & 2032
- Table 35: Global US Conducted Energy Weapons Market Revenue Million Forecast, by Export Market Analysis (Value & Volume) 2019 & 2032
- Table 36: Global US Conducted Energy Weapons Market Revenue Million Forecast, by Price Trend Analysis 2019 & 2032
- Table 37: Global US Conducted Energy Weapons Market Revenue Million Forecast, by Country 2019 & 2032
- Table 38: United Kingdom US Conducted Energy Weapons Market Revenue (Million) Forecast, by Application 2019 & 2032
- Table 39: Germany US Conducted Energy Weapons Market Revenue (Million) Forecast, by Application 2019 & 2032
- Table 40: France US Conducted Energy Weapons Market Revenue (Million) Forecast, by Application 2019 & 2032
- Table 41: Italy US Conducted Energy Weapons Market Revenue (Million) Forecast, by Application 2019 & 2032
- Table 42: Spain US Conducted Energy Weapons Market Revenue (Million) Forecast, by Application 2019 & 2032
- Table 43: Russia US Conducted Energy Weapons Market Revenue (Million) Forecast, by Application 2019 & 2032
- Table 44: Benelux US Conducted Energy Weapons Market Revenue (Million) Forecast, by Application 2019 & 2032
- Table 45: Nordics US Conducted Energy Weapons Market Revenue (Million) Forecast, by Application 2019 & 2032
- Table 46: Rest of Europe US Conducted Energy Weapons Market Revenue (Million) Forecast, by Application 2019 & 2032
- Table 47: Global US Conducted Energy Weapons Market Revenue Million Forecast, by Production Analysis 2019 & 2032
- Table 48: Global US Conducted Energy Weapons Market Revenue Million Forecast, by Consumption Analysis 2019 & 2032
- Table 49: Global US Conducted Energy Weapons Market Revenue Million Forecast, by Import Market Analysis (Value & Volume) 2019 & 2032
- Table 50: Global US Conducted Energy Weapons Market Revenue Million Forecast, by Export Market Analysis (Value & Volume) 2019 & 2032
- Table 51: Global US Conducted Energy Weapons Market Revenue Million Forecast, by Price Trend Analysis 2019 & 2032
- Table 52: Global US Conducted Energy Weapons Market Revenue Million Forecast, by Country 2019 & 2032
- Table 53: Turkey US Conducted Energy Weapons Market Revenue (Million) Forecast, by Application 2019 & 2032
- Table 54: Israel US Conducted Energy Weapons Market Revenue (Million) Forecast, by Application 2019 & 2032
- Table 55: GCC US Conducted Energy Weapons Market Revenue (Million) Forecast, by Application 2019 & 2032
- Table 56: North Africa US Conducted Energy Weapons Market Revenue (Million) Forecast, by Application 2019 & 2032
- Table 57: South Africa US Conducted Energy Weapons Market Revenue (Million) Forecast, by Application 2019 & 2032
- Table 58: Rest of Middle East & Africa US Conducted Energy Weapons Market Revenue (Million) Forecast, by Application 2019 & 2032
- Table 59: Global US Conducted Energy Weapons Market Revenue Million Forecast, by Production Analysis 2019 & 2032
- Table 60: Global US Conducted Energy Weapons Market Revenue Million Forecast, by Consumption Analysis 2019 & 2032
- Table 61: Global US Conducted Energy Weapons Market Revenue Million Forecast, by Import Market Analysis (Value & Volume) 2019 & 2032
- Table 62: Global US Conducted Energy Weapons Market Revenue Million Forecast, by Export Market Analysis (Value & Volume) 2019 & 2032
- Table 63: Global US Conducted Energy Weapons Market Revenue Million Forecast, by Price Trend Analysis 2019 & 2032
- Table 64: Global US Conducted Energy Weapons Market Revenue Million Forecast, by Country 2019 & 2032
- Table 65: China US Conducted Energy Weapons Market Revenue (Million) Forecast, by Application 2019 & 2032
- Table 66: India US Conducted Energy Weapons Market Revenue (Million) Forecast, by Application 2019 & 2032
- Table 67: Japan US Conducted Energy Weapons Market Revenue (Million) Forecast, by Application 2019 & 2032
- Table 68: South Korea US Conducted Energy Weapons Market Revenue (Million) Forecast, by Application 2019 & 2032
- Table 69: ASEAN US Conducted Energy Weapons Market Revenue (Million) Forecast, by Application 2019 & 2032
- Table 70: Oceania US Conducted Energy Weapons Market Revenue (Million) Forecast, by Application 2019 & 2032
- Table 71: Rest of Asia Pacific US Conducted Energy Weapons Market Revenue (Million) Forecast, by Application 2019 & 2032
Frequently Asked Questions
1. What is the projected Compound Annual Growth Rate (CAGR) of the US Conducted Energy Weapons Market?
The projected CAGR is approximately 6.21%.
2. Which companies are prominent players in the US Conducted Energy Weapons Market?
Key companies in the market include SABRE - Security Equipment Corp, Streetwise Security Products, Axon Enterprise Inc, Vipertek, Guard Dog Security, PhaZZer LL, Foxfend.
3. What are the main segments of the US Conducted Energy Weapons Market?
The market segments include Production Analysis, Consumption Analysis, Import Market Analysis (Value & Volume), Export Market Analysis (Value & Volume), Price Trend Analysis.
4. Can you provide details about the market size?
The market size is estimated to be USD 657.12 Million as of 2022.
5. What are some drivers contributing to market growth?
; Increased Seaborne Threats And Ambiguous Maritime Security Policies; Increasing Adoption Of Security Technologies In Bric Countries.
6. What are the notable trends driving market growth?
Increasing Incidents of Civil Unrest Driving Procurement.
7. Are there any restraints impacting market growth?
; High Risk Rate In Ungoverned Zones; Unstructured Security Standards And Technologies.
8. Can you provide examples of recent developments in the market?
N/A
9. What pricing options are available for accessing the report?
Pricing options include single-user, multi-user, and enterprise licenses priced at USD 3800, USD 4500, and USD 5800 respectively.
10. Is the market size provided in terms of value or volume?
The market size is provided in terms of value, measured in Million.
11. Are there any specific market keywords associated with the report?
Yes, the market keyword associated with the report is "US Conducted Energy Weapons Market," which aids in identifying and referencing the specific market segment covered.
12. How do I determine which pricing option suits my needs best?
The pricing options vary based on user requirements and access needs. Individual users may opt for single-user licenses, while businesses requiring broader access may choose multi-user or enterprise licenses for cost-effective access to the report.
13. Are there any additional resources or data provided in the US Conducted Energy Weapons Market report?
While the report offers comprehensive insights, it's advisable to review the specific contents or supplementary materials provided to ascertain if additional resources or data are available.
14. How can I stay updated on further developments or reports in the US Conducted Energy Weapons Market?
To stay informed about further developments, trends, and reports in the US Conducted Energy Weapons Market, consider subscribing to industry newsletters, following relevant companies and organizations, or regularly checking reputable industry news sources and publications.
Methodology
Step 1 - Identification of Relevant Samples Size from Population Database


Step 2 - Approaches for Defining Global Market Size (Value, Volume* & Price*)

Note*: In applicable scenarios
Step 3 - Data Sources
Primary Research
- Web Analytics
- Survey Reports
- Research Institute
- Latest Research Reports
- Opinion Leaders
Secondary Research
- Annual Reports
- White Paper
- Latest Press Release
- Industry Association
- Paid Database
- Investor Presentations

Step 4 - Data Triangulation
Involves using different sources of information in order to increase the validity of a study
These sources are likely to be stakeholders in a program - participants, other researchers, program staff, other community members, and so on.
Then we put all data in single framework & apply various statistical tools to find out the dynamic on the market.
During the analysis stage, feedback from the stakeholder groups would be compared to determine areas of agreement as well as areas of divergence
