

Key Insights
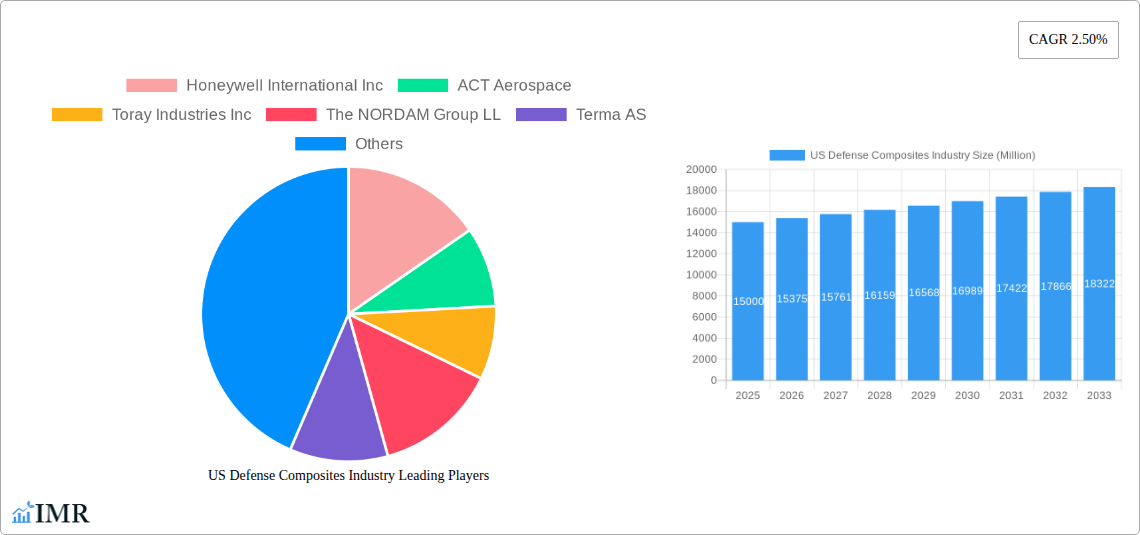
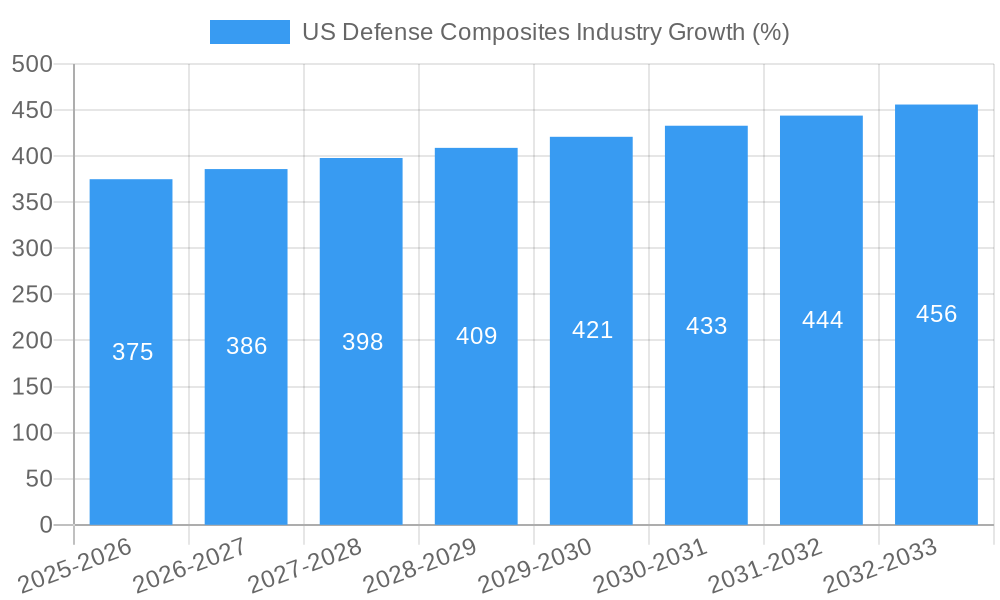
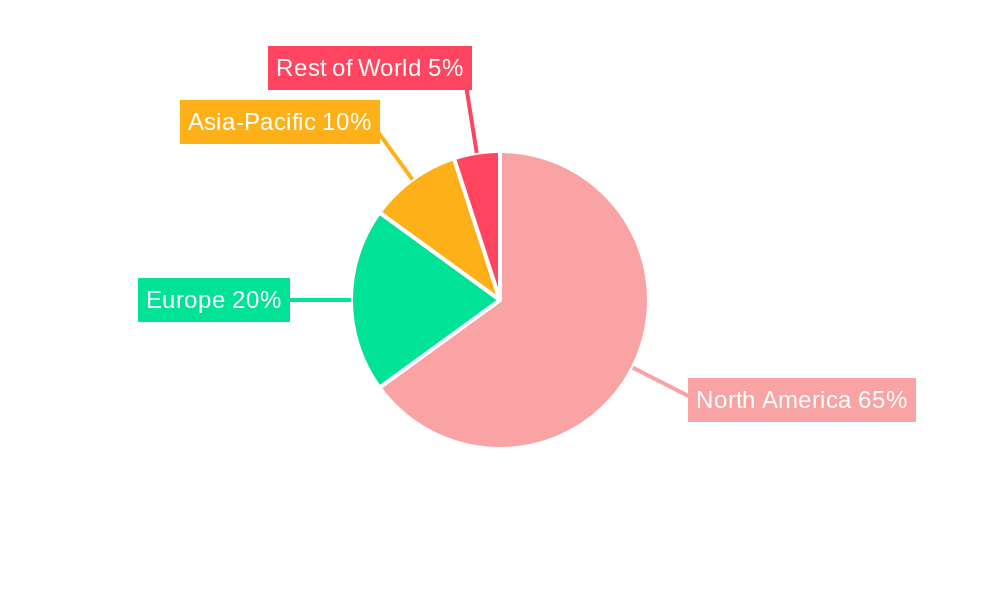
The US defense composites market, encompassing applications in manned and unmanned aircraft, naval ships, land vehicles, and protective equipment, is experiencing steady growth. Driven by increasing demand for lightweight, high-strength materials in advanced defense systems and a continuous push for technological innovation, the market is projected to expand significantly over the forecast period (2025-2033). The adoption of advanced composite materials like thermoset and thermoplastic composites, as well as ceramic matrix composites, is a key trend bolstering this growth. While the market exhibits a relatively modest CAGR of 2.5%, this reflects a stable, continuous expansion rather than explosive growth, typical of a mature but technologically dynamic sector. The regional distribution shows strong concentration in the United States, particularly across various regions like the Northeast, Southeast, Midwest, Southwest, and West, fueled by substantial defense budgets and a robust domestic manufacturing base. Key players like Honeywell, Toray Industries, and Hexcel Corporation are driving innovation and competition, constantly improving material properties and manufacturing processes. Challenges include the high initial cost of composite materials and the complex manufacturing processes requiring specialized expertise. Nevertheless, the long-term benefits in terms of improved performance, weight reduction, and durability are expected to outweigh these drawbacks, securing sustained market expansion.
The segmentation within the US defense composites market reveals varying growth trajectories across different applications. For instance, the unmanned aircraft segment is likely to show the highest growth rate, driven by increasing investment in drone technology and autonomous systems. Conversely, the mature naval ships segment may exhibit slightly slower but consistent growth. The resin type segment demonstrates a preference towards thermoset composites currently, but the thermoplastic composites segment is expected to gain market share over the forecast period due to their improved recyclability and manufacturing advantages. Competition amongst major players is intense, focusing on product innovation, strategic partnerships, and mergers and acquisitions to enhance market presence and technological capabilities. This dynamic environment necessitates continuous adaptation and innovation for companies to maintain a competitive edge. Future market growth hinges on the ongoing investment in defense R&D, advancements in composite materials science, and the increasing integration of composite components into next-generation defense platforms.
This comprehensive report provides an in-depth analysis of the US Defense Composites Industry, covering market dynamics, growth trends, key players, and future outlook. The study period spans from 2019 to 2033, with 2025 serving as the base and estimated year. The forecast period is 2025-2033, and the historical period is 2019-2024. The report analyzes the market across key segments, including application (manned and unmanned aircraft, naval ships, land vehicles, protective equipment, and other applications) and resin type (thermoset composites, thermoplastic composites, and ceramic matrix composites). The total market size is projected to reach xx Million by 2033.
US Defense Composites Industry Market Dynamics & Structure
The US defense composites market is characterized by moderate concentration, with key players like Honeywell International Inc., Hexcel Corporation, and Toray Industries Inc. holding significant market share. Technological innovation, particularly in advanced materials and manufacturing processes, is a primary growth driver. Stringent regulatory frameworks and safety standards influence material selection and manufacturing practices. Competition from traditional materials like metals is present, but composites offer advantages in terms of weight reduction, strength-to-weight ratio, and corrosion resistance. End-user demographics are largely driven by defense budgets and procurement priorities. M&A activity has been moderate in recent years, with several strategic acquisitions aimed at expanding product portfolios and technological capabilities. The market size in 2025 is estimated at 1200 Million.
- Market Concentration: Moderately concentrated, with top 5 players holding approximately 55% market share in 2025.
- Technological Innovation: Focus on lightweight, high-strength materials, improved manufacturing processes (e.g., automated fiber placement).
- Regulatory Landscape: Stringent safety and quality standards (e.g., MIL-STD) influence material selection and manufacturing.
- Competitive Substitutes: Metals (aluminum, steel) remain primary competitors, but composites offer superior performance in many applications.
- M&A Activity: An average of 5-7 significant M&A deals per year in the past 5 years, valued at approximately 150 Million annually.
- Innovation Barriers: High R&D costs, stringent certification requirements, and the need for specialized manufacturing infrastructure.
US Defense Composites Industry Growth Trends & Insights
The US defense composites market exhibits robust growth driven by increasing demand for lightweight, high-performance materials in military and aerospace applications. The adoption rate of advanced composites is accelerating, fueled by technological advancements and favorable government policies promoting domestic manufacturing. The market is experiencing a shift towards more sophisticated composite materials, including carbon fiber-reinforced polymers (CFRP) and advanced ceramic matrix composites (CMCs). The CAGR for the forecast period (2025-2033) is projected at 6%, with market penetration expected to increase from 45% in 2025 to 60% by 2033. This growth is driven by increased defense spending, modernization initiatives across various defense platforms and the strategic shift towards unmanned systems.
Dominant Regions, Countries, or Segments in US Defense Composites Industry
The dominant segment within the US defense composites market is the manned and unmanned aircraft application, driven by the high demand for lightweight, high-strength materials in aircraft structures. This segment is expected to maintain its dominance throughout the forecast period. Geographically, the market is concentrated in regions with significant defense manufacturing capabilities, particularly the Southeastern and Southwestern United States.
Key Drivers for Manned and Unmanned Aircraft Segment:
- Increasing demand for advanced aircraft technologies.
- Focus on reducing aircraft weight for enhanced fuel efficiency.
- Technological advancements in composite materials and manufacturing processes.
Dominance Factors for Southeastern and Southwestern US:
- High concentration of aerospace and defense manufacturers.
- Well-established supply chains and infrastructure.
- Strong government support and investment in defense R&D.
Market Share & Growth Potential: Manned and Unmanned aircraft segment holds 40% market share, with projected growth exceeding 7% CAGR.
US Defense Composites Industry Product Landscape
The US defense composites industry features a diverse range of products, including advanced carbon fiber reinforced polymers (CFRPs), high-temperature resistant ceramic matrix composites (CMCs), and specialized thermoplastic composites. These materials are utilized across various applications, offering significant improvements in weight reduction, strength-to-weight ratio, durability, and stealth capabilities. Continuous advancements in material science and manufacturing techniques enhance product performance and expand application possibilities. Unique selling propositions include superior mechanical properties, resistance to extreme environmental conditions, and enhanced durability. Technological advancements focus on improving fiber strength, optimizing resin systems, and developing cost-effective manufacturing processes.
Key Drivers, Barriers & Challenges in US Defense Composites Industry
Key Drivers: Increased defense budgets, technological advancements in composite materials and manufacturing, growing demand for lightweight and high-performance military equipment, and government initiatives promoting domestic manufacturing are driving the market.
Challenges: High initial material costs, complex manufacturing processes, potential supply chain disruptions, and stringent regulatory compliance requirements pose significant challenges. The impact of supply chain disruptions is estimated to be a 3% decrease in annual growth in the worst-case scenario.
Emerging Opportunities in US Defense Composites Industry
Emerging opportunities lie in the development and adoption of advanced composites in emerging defense applications such as hypersonic vehicles, directed energy weapons systems, and next-generation defense platforms. The utilization of additive manufacturing and 3D printing for composite parts presents significant potential for cost reduction and customization. Furthermore, advancements in bio-inspired composites and self-healing materials offer exciting new avenues for future innovation.
Growth Accelerators in the US Defense Composites Industry
Technological breakthroughs in advanced composite materials, strategic partnerships between material suppliers and defense contractors, and government initiatives to support domestic manufacturing are key catalysts for long-term growth. Expansion into new applications, such as unmanned aerial vehicles (UAVs) and directed energy weapons systems, will further accelerate market expansion.
Key Players Shaping the US Defense Composites Industry Market
- Honeywell International Inc
- ACT Aerospace
- Toray Industries Inc
- The NORDAM Group LL
- Terma AS
- Advanced Composites Inc
- Leading Technology Composites Inc (LTC)
- Huntsman International LLC
- LMI AEROSPACE
- DuPont
- Solvay SA
- CFOAM LLC
- Hexcel Corporation
- Alpine Advanced Materials
- Sherwood Advanced Composite Technologies
Notable Milestones in US Defense Composites Industry Sector
- 2021 (Q3): Hexcel Corporation announced a significant investment in expanding its carbon fiber production capacity.
- 2022 (Q1): Honeywell International Inc. secured a major contract to supply composite components for a new military aircraft program.
- 2023 (Q2): Solvay SA launched a new generation of high-performance thermoplastic composites for aerospace applications. (Further milestones would be added based on actual data).
In-Depth US Defense Composites Industry Market Outlook
The US defense composites market is poised for continued strong growth over the next decade, driven by technological advancements, increased defense spending, and the growing demand for lightweight, high-performance materials in defense systems. Strategic investments in R&D, partnerships, and the exploration of new applications will create significant opportunities for market participants. The focus on sustainability and recyclability of composite materials will also be a key driver shaping the future of the market.
US Defense Composites Industry Segmentation
-
1. Application
- 1.1. Manned and Unmanned Aircraft
- 1.2. Naval Ships
- 1.3. Land Vehicles
- 1.4. Protective Equipment
- 1.5. Other Applications
-
2. Resin Type
- 2.1. Thermoset Composites
- 2.2. Thermoplastic Composites
- 2.3. Ceramic Matrix Composites
US Defense Composites Industry Segmentation By Geography
-
1. North America
- 1.1. United States
- 1.2. Canada
- 1.3. Mexico
-
2. South America
- 2.1. Brazil
- 2.2. Argentina
- 2.3. Rest of South America
-
3. Europe
- 3.1. United Kingdom
- 3.2. Germany
- 3.3. France
- 3.4. Italy
- 3.5. Spain
- 3.6. Russia
- 3.7. Benelux
- 3.8. Nordics
- 3.9. Rest of Europe
-
4. Middle East & Africa
- 4.1. Turkey
- 4.2. Israel
- 4.3. GCC
- 4.4. North Africa
- 4.5. South Africa
- 4.6. Rest of Middle East & Africa
-
5. Asia Pacific
- 5.1. China
- 5.2. India
- 5.3. Japan
- 5.4. South Korea
- 5.5. ASEAN
- 5.6. Oceania
- 5.7. Rest of Asia Pacific
US Defense Composites Industry REPORT HIGHLIGHTS
| Aspects | Details |
|---|---|
| Study Period | 2019-2033 |
| Base Year | 2024 |
| Estimated Year | 2025 |
| Forecast Period | 2025-2033 |
| Historical Period | 2019-2024 |
| Growth Rate | CAGR of 2.50% from 2019-2033 |
| Segmentation |
|
Table of Contents
- 1. Introduction
- 1.1. Research Scope
- 1.2. Market Segmentation
- 1.3. Research Methodology
- 1.4. Definitions and Assumptions
- 2. Executive Summary
- 2.1. Introduction
- 3. Market Dynamics
- 3.1. Introduction
- 3.2. Market Drivers
- 3.3. Market Restrains
- 3.4. Market Trends
- 3.4.1. The Thermoplastic Composites Segment is Expected to Register the Highest Growth Rate During the Forecast Period
- 4. Market Factor Analysis
- 4.1. Porters Five Forces
- 4.2. Supply/Value Chain
- 4.3. PESTEL analysis
- 4.4. Market Entropy
- 4.5. Patent/Trademark Analysis
- 5. Global US Defense Composites Industry Analysis, Insights and Forecast, 2019-2031
- 5.1. Market Analysis, Insights and Forecast - by Application
- 5.1.1. Manned and Unmanned Aircraft
- 5.1.2. Naval Ships
- 5.1.3. Land Vehicles
- 5.1.4. Protective Equipment
- 5.1.5. Other Applications
- 5.2. Market Analysis, Insights and Forecast - by Resin Type
- 5.2.1. Thermoset Composites
- 5.2.2. Thermoplastic Composites
- 5.2.3. Ceramic Matrix Composites
- 5.3. Market Analysis, Insights and Forecast - by Region
- 5.3.1. North America
- 5.3.2. South America
- 5.3.3. Europe
- 5.3.4. Middle East & Africa
- 5.3.5. Asia Pacific
- 5.1. Market Analysis, Insights and Forecast - by Application
- 6. North America US Defense Composites Industry Analysis, Insights and Forecast, 2019-2031
- 6.1. Market Analysis, Insights and Forecast - by Application
- 6.1.1. Manned and Unmanned Aircraft
- 6.1.2. Naval Ships
- 6.1.3. Land Vehicles
- 6.1.4. Protective Equipment
- 6.1.5. Other Applications
- 6.2. Market Analysis, Insights and Forecast - by Resin Type
- 6.2.1. Thermoset Composites
- 6.2.2. Thermoplastic Composites
- 6.2.3. Ceramic Matrix Composites
- 6.1. Market Analysis, Insights and Forecast - by Application
- 7. South America US Defense Composites Industry Analysis, Insights and Forecast, 2019-2031
- 7.1. Market Analysis, Insights and Forecast - by Application
- 7.1.1. Manned and Unmanned Aircraft
- 7.1.2. Naval Ships
- 7.1.3. Land Vehicles
- 7.1.4. Protective Equipment
- 7.1.5. Other Applications
- 7.2. Market Analysis, Insights and Forecast - by Resin Type
- 7.2.1. Thermoset Composites
- 7.2.2. Thermoplastic Composites
- 7.2.3. Ceramic Matrix Composites
- 7.1. Market Analysis, Insights and Forecast - by Application
- 8. Europe US Defense Composites Industry Analysis, Insights and Forecast, 2019-2031
- 8.1. Market Analysis, Insights and Forecast - by Application
- 8.1.1. Manned and Unmanned Aircraft
- 8.1.2. Naval Ships
- 8.1.3. Land Vehicles
- 8.1.4. Protective Equipment
- 8.1.5. Other Applications
- 8.2. Market Analysis, Insights and Forecast - by Resin Type
- 8.2.1. Thermoset Composites
- 8.2.2. Thermoplastic Composites
- 8.2.3. Ceramic Matrix Composites
- 8.1. Market Analysis, Insights and Forecast - by Application
- 9. Middle East & Africa US Defense Composites Industry Analysis, Insights and Forecast, 2019-2031
- 9.1. Market Analysis, Insights and Forecast - by Application
- 9.1.1. Manned and Unmanned Aircraft
- 9.1.2. Naval Ships
- 9.1.3. Land Vehicles
- 9.1.4. Protective Equipment
- 9.1.5. Other Applications
- 9.2. Market Analysis, Insights and Forecast - by Resin Type
- 9.2.1. Thermoset Composites
- 9.2.2. Thermoplastic Composites
- 9.2.3. Ceramic Matrix Composites
- 9.1. Market Analysis, Insights and Forecast - by Application
- 10. Asia Pacific US Defense Composites Industry Analysis, Insights and Forecast, 2019-2031
- 10.1. Market Analysis, Insights and Forecast - by Application
- 10.1.1. Manned and Unmanned Aircraft
- 10.1.2. Naval Ships
- 10.1.3. Land Vehicles
- 10.1.4. Protective Equipment
- 10.1.5. Other Applications
- 10.2. Market Analysis, Insights and Forecast - by Resin Type
- 10.2.1. Thermoset Composites
- 10.2.2. Thermoplastic Composites
- 10.2.3. Ceramic Matrix Composites
- 10.1. Market Analysis, Insights and Forecast - by Application
- 11. Northeast US Defense Composites Industry Analysis, Insights and Forecast, 2019-2031
- 12. Southeast US Defense Composites Industry Analysis, Insights and Forecast, 2019-2031
- 13. Midwest US Defense Composites Industry Analysis, Insights and Forecast, 2019-2031
- 14. Southwest US Defense Composites Industry Analysis, Insights and Forecast, 2019-2031
- 15. West US Defense Composites Industry Analysis, Insights and Forecast, 2019-2031
- 16. Competitive Analysis
- 16.1. Global Market Share Analysis 2024
- 16.2. Company Profiles
- 16.2.1 Honeywell International Inc
- 16.2.1.1. Overview
- 16.2.1.2. Products
- 16.2.1.3. SWOT Analysis
- 16.2.1.4. Recent Developments
- 16.2.1.5. Financials (Based on Availability)
- 16.2.2 ACT Aerospace
- 16.2.2.1. Overview
- 16.2.2.2. Products
- 16.2.2.3. SWOT Analysis
- 16.2.2.4. Recent Developments
- 16.2.2.5. Financials (Based on Availability)
- 16.2.3 Toray Industries Inc
- 16.2.3.1. Overview
- 16.2.3.2. Products
- 16.2.3.3. SWOT Analysis
- 16.2.3.4. Recent Developments
- 16.2.3.5. Financials (Based on Availability)
- 16.2.4 The NORDAM Group LL
- 16.2.4.1. Overview
- 16.2.4.2. Products
- 16.2.4.3. SWOT Analysis
- 16.2.4.4. Recent Developments
- 16.2.4.5. Financials (Based on Availability)
- 16.2.5 Terma AS
- 16.2.5.1. Overview
- 16.2.5.2. Products
- 16.2.5.3. SWOT Analysis
- 16.2.5.4. Recent Developments
- 16.2.5.5. Financials (Based on Availability)
- 16.2.6 Advanced Composites Inc
- 16.2.6.1. Overview
- 16.2.6.2. Products
- 16.2.6.3. SWOT Analysis
- 16.2.6.4. Recent Developments
- 16.2.6.5. Financials (Based on Availability)
- 16.2.7 Leading Technology Composites Inc (LTC)
- 16.2.7.1. Overview
- 16.2.7.2. Products
- 16.2.7.3. SWOT Analysis
- 16.2.7.4. Recent Developments
- 16.2.7.5. Financials (Based on Availability)
- 16.2.8 Huntsman International LLC
- 16.2.8.1. Overview
- 16.2.8.2. Products
- 16.2.8.3. SWOT Analysis
- 16.2.8.4. Recent Developments
- 16.2.8.5. Financials (Based on Availability)
- 16.2.9 LMI AEROSPACE
- 16.2.9.1. Overview
- 16.2.9.2. Products
- 16.2.9.3. SWOT Analysis
- 16.2.9.4. Recent Developments
- 16.2.9.5. Financials (Based on Availability)
- 16.2.10 DuPont
- 16.2.10.1. Overview
- 16.2.10.2. Products
- 16.2.10.3. SWOT Analysis
- 16.2.10.4. Recent Developments
- 16.2.10.5. Financials (Based on Availability)
- 16.2.11 Solvay SA
- 16.2.11.1. Overview
- 16.2.11.2. Products
- 16.2.11.3. SWOT Analysis
- 16.2.11.4. Recent Developments
- 16.2.11.5. Financials (Based on Availability)
- 16.2.12 CFOAM LLC
- 16.2.12.1. Overview
- 16.2.12.2. Products
- 16.2.12.3. SWOT Analysis
- 16.2.12.4. Recent Developments
- 16.2.12.5. Financials (Based on Availability)
- 16.2.13 Hexcel Corporation
- 16.2.13.1. Overview
- 16.2.13.2. Products
- 16.2.13.3. SWOT Analysis
- 16.2.13.4. Recent Developments
- 16.2.13.5. Financials (Based on Availability)
- 16.2.14 Alpine Advanced Materials
- 16.2.14.1. Overview
- 16.2.14.2. Products
- 16.2.14.3. SWOT Analysis
- 16.2.14.4. Recent Developments
- 16.2.14.5. Financials (Based on Availability)
- 16.2.15 Sherwood Advanced Composite Technologies
- 16.2.15.1. Overview
- 16.2.15.2. Products
- 16.2.15.3. SWOT Analysis
- 16.2.15.4. Recent Developments
- 16.2.15.5. Financials (Based on Availability)
- 16.2.1 Honeywell International Inc
List of Figures
- Figure 1: Global US Defense Composites Industry Revenue Breakdown (Million, %) by Region 2024 & 2032
- Figure 2: United states US Defense Composites Industry Revenue (Million), by Country 2024 & 2032
- Figure 3: United states US Defense Composites Industry Revenue Share (%), by Country 2024 & 2032
- Figure 4: North America US Defense Composites Industry Revenue (Million), by Application 2024 & 2032
- Figure 5: North America US Defense Composites Industry Revenue Share (%), by Application 2024 & 2032
- Figure 6: North America US Defense Composites Industry Revenue (Million), by Resin Type 2024 & 2032
- Figure 7: North America US Defense Composites Industry Revenue Share (%), by Resin Type 2024 & 2032
- Figure 8: North America US Defense Composites Industry Revenue (Million), by Country 2024 & 2032
- Figure 9: North America US Defense Composites Industry Revenue Share (%), by Country 2024 & 2032
- Figure 10: South America US Defense Composites Industry Revenue (Million), by Application 2024 & 2032
- Figure 11: South America US Defense Composites Industry Revenue Share (%), by Application 2024 & 2032
- Figure 12: South America US Defense Composites Industry Revenue (Million), by Resin Type 2024 & 2032
- Figure 13: South America US Defense Composites Industry Revenue Share (%), by Resin Type 2024 & 2032
- Figure 14: South America US Defense Composites Industry Revenue (Million), by Country 2024 & 2032
- Figure 15: South America US Defense Composites Industry Revenue Share (%), by Country 2024 & 2032
- Figure 16: Europe US Defense Composites Industry Revenue (Million), by Application 2024 & 2032
- Figure 17: Europe US Defense Composites Industry Revenue Share (%), by Application 2024 & 2032
- Figure 18: Europe US Defense Composites Industry Revenue (Million), by Resin Type 2024 & 2032
- Figure 19: Europe US Defense Composites Industry Revenue Share (%), by Resin Type 2024 & 2032
- Figure 20: Europe US Defense Composites Industry Revenue (Million), by Country 2024 & 2032
- Figure 21: Europe US Defense Composites Industry Revenue Share (%), by Country 2024 & 2032
- Figure 22: Middle East & Africa US Defense Composites Industry Revenue (Million), by Application 2024 & 2032
- Figure 23: Middle East & Africa US Defense Composites Industry Revenue Share (%), by Application 2024 & 2032
- Figure 24: Middle East & Africa US Defense Composites Industry Revenue (Million), by Resin Type 2024 & 2032
- Figure 25: Middle East & Africa US Defense Composites Industry Revenue Share (%), by Resin Type 2024 & 2032
- Figure 26: Middle East & Africa US Defense Composites Industry Revenue (Million), by Country 2024 & 2032
- Figure 27: Middle East & Africa US Defense Composites Industry Revenue Share (%), by Country 2024 & 2032
- Figure 28: Asia Pacific US Defense Composites Industry Revenue (Million), by Application 2024 & 2032
- Figure 29: Asia Pacific US Defense Composites Industry Revenue Share (%), by Application 2024 & 2032
- Figure 30: Asia Pacific US Defense Composites Industry Revenue (Million), by Resin Type 2024 & 2032
- Figure 31: Asia Pacific US Defense Composites Industry Revenue Share (%), by Resin Type 2024 & 2032
- Figure 32: Asia Pacific US Defense Composites Industry Revenue (Million), by Country 2024 & 2032
- Figure 33: Asia Pacific US Defense Composites Industry Revenue Share (%), by Country 2024 & 2032
List of Tables
- Table 1: Global US Defense Composites Industry Revenue Million Forecast, by Region 2019 & 2032
- Table 2: Global US Defense Composites Industry Revenue Million Forecast, by Application 2019 & 2032
- Table 3: Global US Defense Composites Industry Revenue Million Forecast, by Resin Type 2019 & 2032
- Table 4: Global US Defense Composites Industry Revenue Million Forecast, by Region 2019 & 2032
- Table 5: Global US Defense Composites Industry Revenue Million Forecast, by Country 2019 & 2032
- Table 6: Northeast US Defense Composites Industry Revenue (Million) Forecast, by Application 2019 & 2032
- Table 7: Southeast US Defense Composites Industry Revenue (Million) Forecast, by Application 2019 & 2032
- Table 8: Midwest US Defense Composites Industry Revenue (Million) Forecast, by Application 2019 & 2032
- Table 9: Southwest US Defense Composites Industry Revenue (Million) Forecast, by Application 2019 & 2032
- Table 10: West US Defense Composites Industry Revenue (Million) Forecast, by Application 2019 & 2032
- Table 11: Global US Defense Composites Industry Revenue Million Forecast, by Application 2019 & 2032
- Table 12: Global US Defense Composites Industry Revenue Million Forecast, by Resin Type 2019 & 2032
- Table 13: Global US Defense Composites Industry Revenue Million Forecast, by Country 2019 & 2032
- Table 14: United States US Defense Composites Industry Revenue (Million) Forecast, by Application 2019 & 2032
- Table 15: Canada US Defense Composites Industry Revenue (Million) Forecast, by Application 2019 & 2032
- Table 16: Mexico US Defense Composites Industry Revenue (Million) Forecast, by Application 2019 & 2032
- Table 17: Global US Defense Composites Industry Revenue Million Forecast, by Application 2019 & 2032
- Table 18: Global US Defense Composites Industry Revenue Million Forecast, by Resin Type 2019 & 2032
- Table 19: Global US Defense Composites Industry Revenue Million Forecast, by Country 2019 & 2032
- Table 20: Brazil US Defense Composites Industry Revenue (Million) Forecast, by Application 2019 & 2032
- Table 21: Argentina US Defense Composites Industry Revenue (Million) Forecast, by Application 2019 & 2032
- Table 22: Rest of South America US Defense Composites Industry Revenue (Million) Forecast, by Application 2019 & 2032
- Table 23: Global US Defense Composites Industry Revenue Million Forecast, by Application 2019 & 2032
- Table 24: Global US Defense Composites Industry Revenue Million Forecast, by Resin Type 2019 & 2032
- Table 25: Global US Defense Composites Industry Revenue Million Forecast, by Country 2019 & 2032
- Table 26: United Kingdom US Defense Composites Industry Revenue (Million) Forecast, by Application 2019 & 2032
- Table 27: Germany US Defense Composites Industry Revenue (Million) Forecast, by Application 2019 & 2032
- Table 28: France US Defense Composites Industry Revenue (Million) Forecast, by Application 2019 & 2032
- Table 29: Italy US Defense Composites Industry Revenue (Million) Forecast, by Application 2019 & 2032
- Table 30: Spain US Defense Composites Industry Revenue (Million) Forecast, by Application 2019 & 2032
- Table 31: Russia US Defense Composites Industry Revenue (Million) Forecast, by Application 2019 & 2032
- Table 32: Benelux US Defense Composites Industry Revenue (Million) Forecast, by Application 2019 & 2032
- Table 33: Nordics US Defense Composites Industry Revenue (Million) Forecast, by Application 2019 & 2032
- Table 34: Rest of Europe US Defense Composites Industry Revenue (Million) Forecast, by Application 2019 & 2032
- Table 35: Global US Defense Composites Industry Revenue Million Forecast, by Application 2019 & 2032
- Table 36: Global US Defense Composites Industry Revenue Million Forecast, by Resin Type 2019 & 2032
- Table 37: Global US Defense Composites Industry Revenue Million Forecast, by Country 2019 & 2032
- Table 38: Turkey US Defense Composites Industry Revenue (Million) Forecast, by Application 2019 & 2032
- Table 39: Israel US Defense Composites Industry Revenue (Million) Forecast, by Application 2019 & 2032
- Table 40: GCC US Defense Composites Industry Revenue (Million) Forecast, by Application 2019 & 2032
- Table 41: North Africa US Defense Composites Industry Revenue (Million) Forecast, by Application 2019 & 2032
- Table 42: South Africa US Defense Composites Industry Revenue (Million) Forecast, by Application 2019 & 2032
- Table 43: Rest of Middle East & Africa US Defense Composites Industry Revenue (Million) Forecast, by Application 2019 & 2032
- Table 44: Global US Defense Composites Industry Revenue Million Forecast, by Application 2019 & 2032
- Table 45: Global US Defense Composites Industry Revenue Million Forecast, by Resin Type 2019 & 2032
- Table 46: Global US Defense Composites Industry Revenue Million Forecast, by Country 2019 & 2032
- Table 47: China US Defense Composites Industry Revenue (Million) Forecast, by Application 2019 & 2032
- Table 48: India US Defense Composites Industry Revenue (Million) Forecast, by Application 2019 & 2032
- Table 49: Japan US Defense Composites Industry Revenue (Million) Forecast, by Application 2019 & 2032
- Table 50: South Korea US Defense Composites Industry Revenue (Million) Forecast, by Application 2019 & 2032
- Table 51: ASEAN US Defense Composites Industry Revenue (Million) Forecast, by Application 2019 & 2032
- Table 52: Oceania US Defense Composites Industry Revenue (Million) Forecast, by Application 2019 & 2032
- Table 53: Rest of Asia Pacific US Defense Composites Industry Revenue (Million) Forecast, by Application 2019 & 2032
Frequently Asked Questions
1. What is the projected Compound Annual Growth Rate (CAGR) of the US Defense Composites Industry?
The projected CAGR is approximately 2.50%.
2. Which companies are prominent players in the US Defense Composites Industry?
Key companies in the market include Honeywell International Inc, ACT Aerospace, Toray Industries Inc, The NORDAM Group LL, Terma AS, Advanced Composites Inc, Leading Technology Composites Inc (LTC), Huntsman International LLC, LMI AEROSPACE, DuPont, Solvay SA, CFOAM LLC, Hexcel Corporation, Alpine Advanced Materials, Sherwood Advanced Composite Technologies.
3. What are the main segments of the US Defense Composites Industry?
The market segments include Application, Resin Type.
4. Can you provide details about the market size?
The market size is estimated to be USD XX Million as of 2022.
5. What are some drivers contributing to market growth?
N/A
6. What are the notable trends driving market growth?
The Thermoplastic Composites Segment is Expected to Register the Highest Growth Rate During the Forecast Period.
7. Are there any restraints impacting market growth?
N/A
8. Can you provide examples of recent developments in the market?
N/A
9. What pricing options are available for accessing the report?
Pricing options include single-user, multi-user, and enterprise licenses priced at USD 3800, USD 4500, and USD 5800 respectively.
10. Is the market size provided in terms of value or volume?
The market size is provided in terms of value, measured in Million.
11. Are there any specific market keywords associated with the report?
Yes, the market keyword associated with the report is "US Defense Composites Industry," which aids in identifying and referencing the specific market segment covered.
12. How do I determine which pricing option suits my needs best?
The pricing options vary based on user requirements and access needs. Individual users may opt for single-user licenses, while businesses requiring broader access may choose multi-user or enterprise licenses for cost-effective access to the report.
13. Are there any additional resources or data provided in the US Defense Composites Industry report?
While the report offers comprehensive insights, it's advisable to review the specific contents or supplementary materials provided to ascertain if additional resources or data are available.
14. How can I stay updated on further developments or reports in the US Defense Composites Industry?
To stay informed about further developments, trends, and reports in the US Defense Composites Industry, consider subscribing to industry newsletters, following relevant companies and organizations, or regularly checking reputable industry news sources and publications.
Methodology
Step 1 - Identification of Relevant Samples Size from Population Database


Step 2 - Approaches for Defining Global Market Size (Value, Volume* & Price*)

Note*: In applicable scenarios
Step 3 - Data Sources
Primary Research
- Web Analytics
- Survey Reports
- Research Institute
- Latest Research Reports
- Opinion Leaders
Secondary Research
- Annual Reports
- White Paper
- Latest Press Release
- Industry Association
- Paid Database
- Investor Presentations

Step 4 - Data Triangulation
Involves using different sources of information in order to increase the validity of a study
These sources are likely to be stakeholders in a program - participants, other researchers, program staff, other community members, and so on.
Then we put all data in single framework & apply various statistical tools to find out the dynamic on the market.
During the analysis stage, feedback from the stakeholder groups would be compared to determine areas of agreement as well as areas of divergence
