

Key Insights
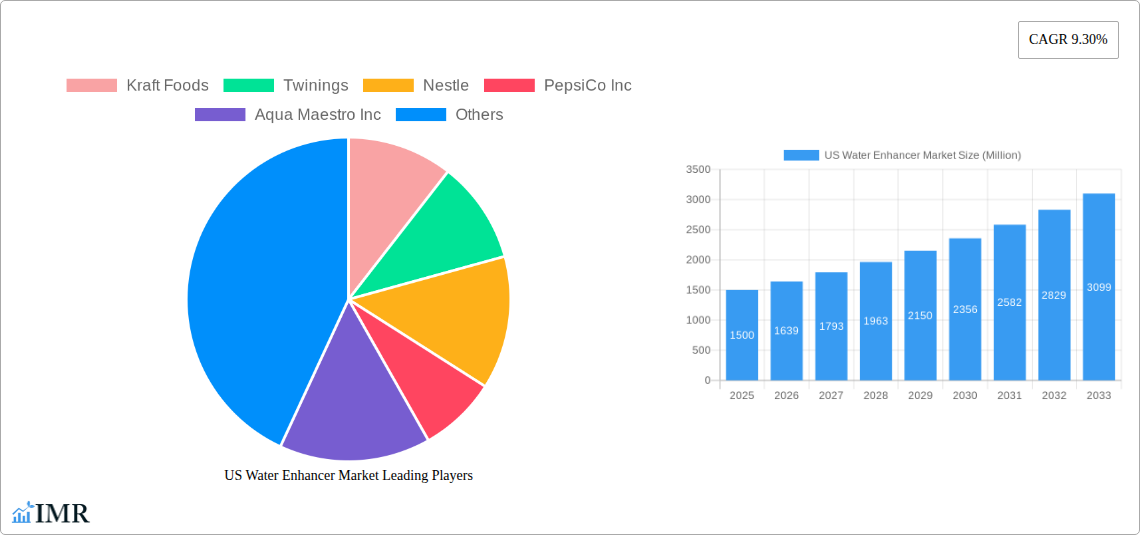
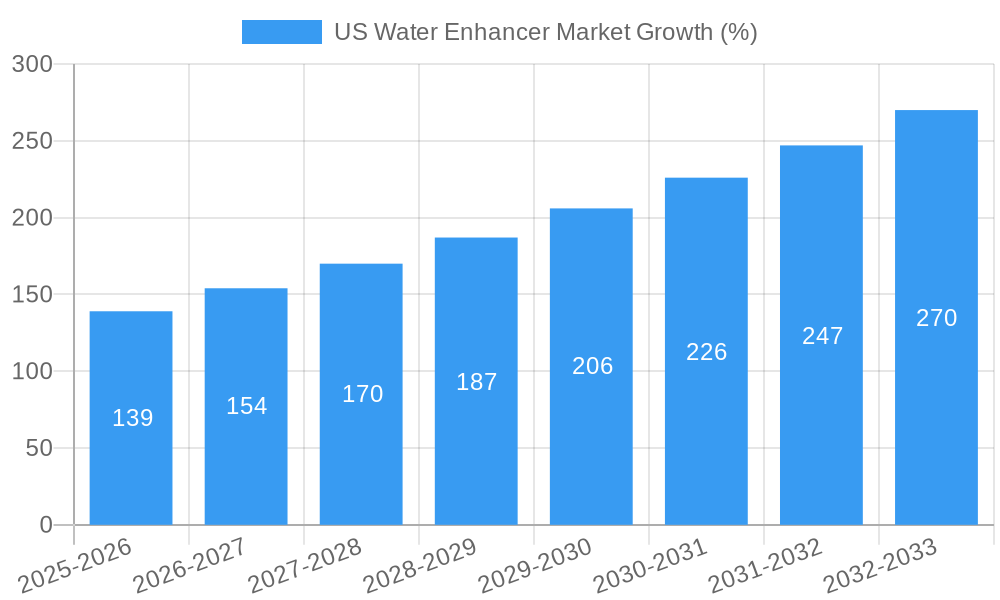
The US water enhancer market, valued at approximately $1.5 billion in 2025, is projected to experience robust growth, exhibiting a Compound Annual Growth Rate (CAGR) of 9.3% from 2025 to 2033. This expansion is fueled by several key drivers. The rising consumer awareness of the importance of hydration and the increasing preference for healthier, low-calorie beverage options are significantly contributing to market growth. Consumers are actively seeking alternatives to sugary sodas and juices, driving demand for water enhancers that offer both flavor and health benefits. The growing popularity of functional beverages, incorporating vitamins, minerals, and antioxidants, further bolsters market expansion. The convenience offered by readily available water enhancers in various retail channels, including pharmacies, health stores, supermarkets, convenience stores, and online platforms, also contributes to market accessibility and sales. The market is witnessing innovation in flavors, formats (powder, liquid concentrates), and functional ingredients, catering to diverse consumer preferences and health goals. While pricing and competition among established brands present some challenges, the overall market outlook remains positive, driven by sustained consumer demand for healthier beverage options.
The market segmentation reveals a dynamic landscape. The online channel is anticipated to show significant growth due to the rising e-commerce penetration and increased online shopping habits. However, traditional retail channels like pharmacies and health stores continue to hold a substantial market share, given the direct connection with health-conscious consumers. Regional variations exist, with higher consumption potentially in regions with warmer climates and a greater focus on health and wellness. Leading brands like Kraft Foods, Nestle, PepsiCo, and Coca-Cola are key players, constantly innovating and expanding their product portfolios to maintain market dominance. However, smaller, specialized brands focusing on niche markets (e.g., organic or specific functional benefits) are also emerging, adding to the market’s vibrancy and competitiveness. Overall, the US water enhancer market presents a lucrative opportunity for both established players and new entrants, emphasizing the need for continuous innovation and strategic marketing to capture market share.
US Water Enhancer Market: A Comprehensive Analysis (2019-2033)
This in-depth report provides a comprehensive analysis of the US water enhancer market, offering invaluable insights for industry professionals, investors, and strategic decision-makers. The report covers the period 2019-2033, with a focus on the forecast period 2025-2033 (base year: 2025, estimated year: 2025). The analysis delves into market dynamics, growth trends, regional dominance, product landscape, key players, and emerging opportunities within the broader beverage and health & wellness sectors. The report also segments the market by distribution channel, providing granular analysis of performance across Pharmacy and Health Stores, Convenience Stores, Hypermarkets/Supermarkets, Online Channels, and Other Distribution Channels.
US Water Enhancer Market Market Dynamics & Structure
The US water enhancer market exhibits a moderately consolidated structure, with key players like Kraft Foods, Nestle, PepsiCo Inc, and The Coca-Cola Company holding significant market share (estimated at xx% collectively in 2025). However, smaller, specialized players like Aqua Maestro Inc and True Citrus are also gaining traction through innovative product offerings and targeted marketing strategies. Market concentration is expected to remain relatively stable during the forecast period, although potential M&A activity could reshape the competitive landscape. Technological innovation, particularly in natural and functional ingredient development, plays a crucial role in driving market growth. Stringent regulatory frameworks governing food and beverage safety and labeling significantly influence product formulation and marketing claims. The market also faces competition from alternative hydration options, including ready-to-drink beverages and sports drinks. Consumer demographics, with a growing health-conscious population seeking low-calorie and functional beverages, are major influencers. The number of M&A deals in this sector averaged xx per year during the historical period (2019-2024).
- Market Concentration: Moderately consolidated, with top players holding xx% market share in 2025.
- Technological Innovation: Focus on natural ingredients, functional benefits, and sustainable packaging.
- Regulatory Framework: Stringent regulations regarding labeling, safety, and health claims.
- Competitive Substitutes: Ready-to-drink beverages, sports drinks, and other hydration options.
- End-User Demographics: Growth driven by health-conscious consumers seeking healthier hydration options.
- M&A Trends: An average of xx M&A deals per year between 2019 and 2024.
US Water Enhancer Market Growth Trends & Insights
The US water enhancer market is poised for steady growth throughout the forecast period. The market size is estimated at $xx million in 2025, exhibiting a CAGR of xx% from 2025 to 2033, driven by increasing consumer demand for healthier and more flavorful hydration options. Market penetration is currently at xx%, with significant potential for growth, particularly among younger demographics. Technological disruptions, such as the introduction of innovative flavor profiles and functional ingredients (e.g., electrolytes, vitamins), are boosting adoption rates. Consumer behavior shifts towards healthier lifestyles and a preference for customization are further fueling market expansion. The increasing availability of water enhancers through diverse distribution channels is also contributing to market growth.
Dominant Regions, Countries, or Segments in US Water Enhancer Market
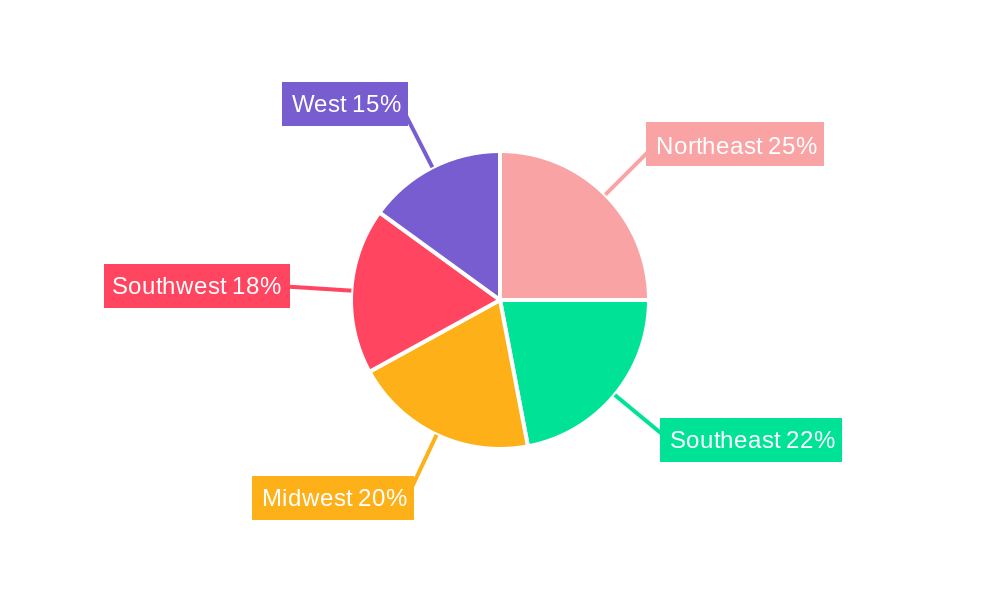
The Hypermarket/Supermarket segment currently holds the largest market share within the US water enhancer market, driven by extensive product availability, competitive pricing, and convenient purchasing experience. However, the Online Channel is demonstrating the fastest growth rate, fueled by increasing e-commerce penetration and the convenience of home delivery. This segment's growth is being facilitated by advancements in online retail infrastructure and increasing adoption of online shopping by health-conscious consumers. The Pharmacy and Health Store channel also enjoys a significant share, leveraging its association with health and wellness.
- Hypermarkets/Supermarkets: Largest market share due to wide availability and competitive pricing.
- Online Channel: Fastest-growing segment due to e-commerce expansion and home delivery convenience.
- Pharmacy and Health Stores: Significant share due to association with health and wellness.
- Convenience Stores: Moderate growth potential due to increasing demand for on-the-go hydration solutions.
US Water Enhancer Market Product Landscape
The US water enhancer market showcases a diverse product landscape, encompassing various flavors, functional ingredients, and formats. Innovations focus on natural sweeteners, zero-calorie options, and unique flavor combinations to cater to evolving consumer preferences. Companies are increasingly incorporating functional ingredients like electrolytes, vitamins, and antioxidants to enhance product appeal and differentiate their offerings. Performance metrics are centered around taste, convenience, and health benefits.
Key Drivers, Barriers & Challenges in US Water Enhancer Market
Key Drivers: Growing health consciousness, demand for healthier hydration alternatives, increasing disposable incomes, and innovation in flavor profiles and functional ingredients.
Challenges: Intense competition from established beverage players, fluctuating raw material costs, stringent regulatory requirements for labeling and health claims, and potential supply chain disruptions.
Emerging Opportunities in US Water Enhancer Market
Emerging opportunities lie in the expansion of functional water enhancers with added health benefits (e.g., immunity-boosting ingredients), personalized flavor options, and the development of sustainable and eco-friendly packaging. Untapped markets include specialized niches like sports nutrition and elderly care.
Growth Accelerators in the US Water Enhancer Market Industry
Technological advancements in flavor creation and ingredient sourcing, strategic partnerships with health and wellness brands, and expanding into new distribution channels (e.g., direct-to-consumer models) are key growth accelerators for the US water enhancer market.
Key Players Shaping the US Water Enhancer Market Market
- Kraft Foods
- Twinings
- Nestle
- PepsiCo Inc
- Aqua Maestro Inc
- True Citrus
- The Coca-Cola Company
- AriZona Beverages USA LLC
- Avitae
Notable Milestones in US Water Enhancer Market Sector
- 2020: Launch of a new line of organic water enhancers by True Citrus.
- 2022: Acquisition of a smaller water enhancer brand by Nestle.
- 2023: Introduction of a new range of functional water enhancers with added electrolytes by PepsiCo. (Further milestones would be added based on data)
In-Depth US Water Enhancer Market Market Outlook
The US water enhancer market is poised for significant growth over the next decade, driven by continuous innovation in product formulation, expanding distribution channels, and a sustained consumer focus on health and wellness. Strategic partnerships and aggressive marketing campaigns will play crucial roles in shaping market dynamics and capturing a larger share of the expanding hydration beverage market. The potential for further market segmentation based on specific dietary needs and health goals also presents significant opportunities for growth and innovation.
US Water Enhancer Market Segmentation
-
1. Distribution Channel
- 1.1. Pharmacy and Health Store
- 1.2. Convenience Store
- 1.3. Hypermarket/Supermarket
- 1.4. Online Channel
- 1.5. Other Distribution Channel
US Water Enhancer Market Segmentation By Geography
-
1. North America
- 1.1. United States
- 1.2. Canada
- 1.3. Mexico
-
2. South America
- 2.1. Brazil
- 2.2. Argentina
- 2.3. Rest of South America
-
3. Europe
- 3.1. United Kingdom
- 3.2. Germany
- 3.3. France
- 3.4. Italy
- 3.5. Spain
- 3.6. Russia
- 3.7. Benelux
- 3.8. Nordics
- 3.9. Rest of Europe
-
4. Middle East & Africa
- 4.1. Turkey
- 4.2. Israel
- 4.3. GCC
- 4.4. North Africa
- 4.5. South Africa
- 4.6. Rest of Middle East & Africa
-
5. Asia Pacific
- 5.1. China
- 5.2. India
- 5.3. Japan
- 5.4. South Korea
- 5.5. ASEAN
- 5.6. Oceania
- 5.7. Rest of Asia Pacific
US Water Enhancer Market REPORT HIGHLIGHTS
| Aspects | Details |
|---|---|
| Study Period | 2019-2033 |
| Base Year | 2024 |
| Estimated Year | 2025 |
| Forecast Period | 2025-2033 |
| Historical Period | 2019-2024 |
| Growth Rate | CAGR of 9.30% from 2019-2033 |
| Segmentation |
|
Table of Contents
- 1. Introduction
- 1.1. Research Scope
- 1.2. Market Segmentation
- 1.3. Research Methodology
- 1.4. Definitions and Assumptions
- 2. Executive Summary
- 2.1. Introduction
- 3. Market Dynamics
- 3.1. Introduction
- 3.2. Market Drivers
- 3.2.1. Rising Demand for Functional Beverages; Increasing Health Consciousness
- 3.3. Market Restrains
- 3.3.1. High prices for premium or specialized water enhancers can limit their appeal to cost-conscious consumers
- 3.4. Market Trends
- 3.4.1. Consumers are increasingly seeking clean-label products with natural ingredients
- 4. Market Factor Analysis
- 4.1. Porters Five Forces
- 4.2. Supply/Value Chain
- 4.3. PESTEL analysis
- 4.4. Market Entropy
- 4.5. Patent/Trademark Analysis
- 5. Global US Water Enhancer Market Analysis, Insights and Forecast, 2019-2031
- 5.1. Market Analysis, Insights and Forecast - by Distribution Channel
- 5.1.1. Pharmacy and Health Store
- 5.1.2. Convenience Store
- 5.1.3. Hypermarket/Supermarket
- 5.1.4. Online Channel
- 5.1.5. Other Distribution Channel
- 5.2. Market Analysis, Insights and Forecast - by Region
- 5.2.1. North America
- 5.2.2. South America
- 5.2.3. Europe
- 5.2.4. Middle East & Africa
- 5.2.5. Asia Pacific
- 5.1. Market Analysis, Insights and Forecast - by Distribution Channel
- 6. North America US Water Enhancer Market Analysis, Insights and Forecast, 2019-2031
- 6.1. Market Analysis, Insights and Forecast - by Distribution Channel
- 6.1.1. Pharmacy and Health Store
- 6.1.2. Convenience Store
- 6.1.3. Hypermarket/Supermarket
- 6.1.4. Online Channel
- 6.1.5. Other Distribution Channel
- 6.1. Market Analysis, Insights and Forecast - by Distribution Channel
- 7. South America US Water Enhancer Market Analysis, Insights and Forecast, 2019-2031
- 7.1. Market Analysis, Insights and Forecast - by Distribution Channel
- 7.1.1. Pharmacy and Health Store
- 7.1.2. Convenience Store
- 7.1.3. Hypermarket/Supermarket
- 7.1.4. Online Channel
- 7.1.5. Other Distribution Channel
- 7.1. Market Analysis, Insights and Forecast - by Distribution Channel
- 8. Europe US Water Enhancer Market Analysis, Insights and Forecast, 2019-2031
- 8.1. Market Analysis, Insights and Forecast - by Distribution Channel
- 8.1.1. Pharmacy and Health Store
- 8.1.2. Convenience Store
- 8.1.3. Hypermarket/Supermarket
- 8.1.4. Online Channel
- 8.1.5. Other Distribution Channel
- 8.1. Market Analysis, Insights and Forecast - by Distribution Channel
- 9. Middle East & Africa US Water Enhancer Market Analysis, Insights and Forecast, 2019-2031
- 9.1. Market Analysis, Insights and Forecast - by Distribution Channel
- 9.1.1. Pharmacy and Health Store
- 9.1.2. Convenience Store
- 9.1.3. Hypermarket/Supermarket
- 9.1.4. Online Channel
- 9.1.5. Other Distribution Channel
- 9.1. Market Analysis, Insights and Forecast - by Distribution Channel
- 10. Asia Pacific US Water Enhancer Market Analysis, Insights and Forecast, 2019-2031
- 10.1. Market Analysis, Insights and Forecast - by Distribution Channel
- 10.1.1. Pharmacy and Health Store
- 10.1.2. Convenience Store
- 10.1.3. Hypermarket/Supermarket
- 10.1.4. Online Channel
- 10.1.5. Other Distribution Channel
- 10.1. Market Analysis, Insights and Forecast - by Distribution Channel
- 11. Northeast US Water Enhancer Market Analysis, Insights and Forecast, 2019-2031
- 12. Southeast US Water Enhancer Market Analysis, Insights and Forecast, 2019-2031
- 13. Midwest US Water Enhancer Market Analysis, Insights and Forecast, 2019-2031
- 14. Southwest US Water Enhancer Market Analysis, Insights and Forecast, 2019-2031
- 15. West US Water Enhancer Market Analysis, Insights and Forecast, 2019-2031
- 16. Competitive Analysis
- 16.1. Global Market Share Analysis 2024
- 16.2. Company Profiles
- 16.2.1 Kraft Foods
- 16.2.1.1. Overview
- 16.2.1.2. Products
- 16.2.1.3. SWOT Analysis
- 16.2.1.4. Recent Developments
- 16.2.1.5. Financials (Based on Availability)
- 16.2.2 Twinings
- 16.2.2.1. Overview
- 16.2.2.2. Products
- 16.2.2.3. SWOT Analysis
- 16.2.2.4. Recent Developments
- 16.2.2.5. Financials (Based on Availability)
- 16.2.3 Nestle
- 16.2.3.1. Overview
- 16.2.3.2. Products
- 16.2.3.3. SWOT Analysis
- 16.2.3.4. Recent Developments
- 16.2.3.5. Financials (Based on Availability)
- 16.2.4 PepsiCo Inc
- 16.2.4.1. Overview
- 16.2.4.2. Products
- 16.2.4.3. SWOT Analysis
- 16.2.4.4. Recent Developments
- 16.2.4.5. Financials (Based on Availability)
- 16.2.5 Aqua Maestro Inc
- 16.2.5.1. Overview
- 16.2.5.2. Products
- 16.2.5.3. SWOT Analysis
- 16.2.5.4. Recent Developments
- 16.2.5.5. Financials (Based on Availability)
- 16.2.6 True Citrus
- 16.2.6.1. Overview
- 16.2.6.2. Products
- 16.2.6.3. SWOT Analysis
- 16.2.6.4. Recent Developments
- 16.2.6.5. Financials (Based on Availability)
- 16.2.7 The Coca-Cola Company
- 16.2.7.1. Overview
- 16.2.7.2. Products
- 16.2.7.3. SWOT Analysis
- 16.2.7.4. Recent Developments
- 16.2.7.5. Financials (Based on Availability)
- 16.2.8 AriZona Beverages USA LLC*List Not Exhaustive
- 16.2.8.1. Overview
- 16.2.8.2. Products
- 16.2.8.3. SWOT Analysis
- 16.2.8.4. Recent Developments
- 16.2.8.5. Financials (Based on Availability)
- 16.2.9 Avitae
- 16.2.9.1. Overview
- 16.2.9.2. Products
- 16.2.9.3. SWOT Analysis
- 16.2.9.4. Recent Developments
- 16.2.9.5. Financials (Based on Availability)
- 16.2.1 Kraft Foods
List of Figures
- Figure 1: Global US Water Enhancer Market Revenue Breakdown (Million, %) by Region 2024 & 2032
- Figure 2: United states US Water Enhancer Market Revenue (Million), by Country 2024 & 2032
- Figure 3: United states US Water Enhancer Market Revenue Share (%), by Country 2024 & 2032
- Figure 4: North America US Water Enhancer Market Revenue (Million), by Distribution Channel 2024 & 2032
- Figure 5: North America US Water Enhancer Market Revenue Share (%), by Distribution Channel 2024 & 2032
- Figure 6: North America US Water Enhancer Market Revenue (Million), by Country 2024 & 2032
- Figure 7: North America US Water Enhancer Market Revenue Share (%), by Country 2024 & 2032
- Figure 8: South America US Water Enhancer Market Revenue (Million), by Distribution Channel 2024 & 2032
- Figure 9: South America US Water Enhancer Market Revenue Share (%), by Distribution Channel 2024 & 2032
- Figure 10: South America US Water Enhancer Market Revenue (Million), by Country 2024 & 2032
- Figure 11: South America US Water Enhancer Market Revenue Share (%), by Country 2024 & 2032
- Figure 12: Europe US Water Enhancer Market Revenue (Million), by Distribution Channel 2024 & 2032
- Figure 13: Europe US Water Enhancer Market Revenue Share (%), by Distribution Channel 2024 & 2032
- Figure 14: Europe US Water Enhancer Market Revenue (Million), by Country 2024 & 2032
- Figure 15: Europe US Water Enhancer Market Revenue Share (%), by Country 2024 & 2032
- Figure 16: Middle East & Africa US Water Enhancer Market Revenue (Million), by Distribution Channel 2024 & 2032
- Figure 17: Middle East & Africa US Water Enhancer Market Revenue Share (%), by Distribution Channel 2024 & 2032
- Figure 18: Middle East & Africa US Water Enhancer Market Revenue (Million), by Country 2024 & 2032
- Figure 19: Middle East & Africa US Water Enhancer Market Revenue Share (%), by Country 2024 & 2032
- Figure 20: Asia Pacific US Water Enhancer Market Revenue (Million), by Distribution Channel 2024 & 2032
- Figure 21: Asia Pacific US Water Enhancer Market Revenue Share (%), by Distribution Channel 2024 & 2032
- Figure 22: Asia Pacific US Water Enhancer Market Revenue (Million), by Country 2024 & 2032
- Figure 23: Asia Pacific US Water Enhancer Market Revenue Share (%), by Country 2024 & 2032
List of Tables
- Table 1: Global US Water Enhancer Market Revenue Million Forecast, by Region 2019 & 2032
- Table 2: Global US Water Enhancer Market Revenue Million Forecast, by Distribution Channel 2019 & 2032
- Table 3: Global US Water Enhancer Market Revenue Million Forecast, by Region 2019 & 2032
- Table 4: Global US Water Enhancer Market Revenue Million Forecast, by Country 2019 & 2032
- Table 5: Northeast US Water Enhancer Market Revenue (Million) Forecast, by Application 2019 & 2032
- Table 6: Southeast US Water Enhancer Market Revenue (Million) Forecast, by Application 2019 & 2032
- Table 7: Midwest US Water Enhancer Market Revenue (Million) Forecast, by Application 2019 & 2032
- Table 8: Southwest US Water Enhancer Market Revenue (Million) Forecast, by Application 2019 & 2032
- Table 9: West US Water Enhancer Market Revenue (Million) Forecast, by Application 2019 & 2032
- Table 10: Global US Water Enhancer Market Revenue Million Forecast, by Distribution Channel 2019 & 2032
- Table 11: Global US Water Enhancer Market Revenue Million Forecast, by Country 2019 & 2032
- Table 12: United States US Water Enhancer Market Revenue (Million) Forecast, by Application 2019 & 2032
- Table 13: Canada US Water Enhancer Market Revenue (Million) Forecast, by Application 2019 & 2032
- Table 14: Mexico US Water Enhancer Market Revenue (Million) Forecast, by Application 2019 & 2032
- Table 15: Global US Water Enhancer Market Revenue Million Forecast, by Distribution Channel 2019 & 2032
- Table 16: Global US Water Enhancer Market Revenue Million Forecast, by Country 2019 & 2032
- Table 17: Brazil US Water Enhancer Market Revenue (Million) Forecast, by Application 2019 & 2032
- Table 18: Argentina US Water Enhancer Market Revenue (Million) Forecast, by Application 2019 & 2032
- Table 19: Rest of South America US Water Enhancer Market Revenue (Million) Forecast, by Application 2019 & 2032
- Table 20: Global US Water Enhancer Market Revenue Million Forecast, by Distribution Channel 2019 & 2032
- Table 21: Global US Water Enhancer Market Revenue Million Forecast, by Country 2019 & 2032
- Table 22: United Kingdom US Water Enhancer Market Revenue (Million) Forecast, by Application 2019 & 2032
- Table 23: Germany US Water Enhancer Market Revenue (Million) Forecast, by Application 2019 & 2032
- Table 24: France US Water Enhancer Market Revenue (Million) Forecast, by Application 2019 & 2032
- Table 25: Italy US Water Enhancer Market Revenue (Million) Forecast, by Application 2019 & 2032
- Table 26: Spain US Water Enhancer Market Revenue (Million) Forecast, by Application 2019 & 2032
- Table 27: Russia US Water Enhancer Market Revenue (Million) Forecast, by Application 2019 & 2032
- Table 28: Benelux US Water Enhancer Market Revenue (Million) Forecast, by Application 2019 & 2032
- Table 29: Nordics US Water Enhancer Market Revenue (Million) Forecast, by Application 2019 & 2032
- Table 30: Rest of Europe US Water Enhancer Market Revenue (Million) Forecast, by Application 2019 & 2032
- Table 31: Global US Water Enhancer Market Revenue Million Forecast, by Distribution Channel 2019 & 2032
- Table 32: Global US Water Enhancer Market Revenue Million Forecast, by Country 2019 & 2032
- Table 33: Turkey US Water Enhancer Market Revenue (Million) Forecast, by Application 2019 & 2032
- Table 34: Israel US Water Enhancer Market Revenue (Million) Forecast, by Application 2019 & 2032
- Table 35: GCC US Water Enhancer Market Revenue (Million) Forecast, by Application 2019 & 2032
- Table 36: North Africa US Water Enhancer Market Revenue (Million) Forecast, by Application 2019 & 2032
- Table 37: South Africa US Water Enhancer Market Revenue (Million) Forecast, by Application 2019 & 2032
- Table 38: Rest of Middle East & Africa US Water Enhancer Market Revenue (Million) Forecast, by Application 2019 & 2032
- Table 39: Global US Water Enhancer Market Revenue Million Forecast, by Distribution Channel 2019 & 2032
- Table 40: Global US Water Enhancer Market Revenue Million Forecast, by Country 2019 & 2032
- Table 41: China US Water Enhancer Market Revenue (Million) Forecast, by Application 2019 & 2032
- Table 42: India US Water Enhancer Market Revenue (Million) Forecast, by Application 2019 & 2032
- Table 43: Japan US Water Enhancer Market Revenue (Million) Forecast, by Application 2019 & 2032
- Table 44: South Korea US Water Enhancer Market Revenue (Million) Forecast, by Application 2019 & 2032
- Table 45: ASEAN US Water Enhancer Market Revenue (Million) Forecast, by Application 2019 & 2032
- Table 46: Oceania US Water Enhancer Market Revenue (Million) Forecast, by Application 2019 & 2032
- Table 47: Rest of Asia Pacific US Water Enhancer Market Revenue (Million) Forecast, by Application 2019 & 2032
Frequently Asked Questions
1. What is the projected Compound Annual Growth Rate (CAGR) of the US Water Enhancer Market?
The projected CAGR is approximately 9.30%.
2. Which companies are prominent players in the US Water Enhancer Market?
Key companies in the market include Kraft Foods, Twinings, Nestle, PepsiCo Inc, Aqua Maestro Inc, True Citrus, The Coca-Cola Company, AriZona Beverages USA LLC*List Not Exhaustive, Avitae.
3. What are the main segments of the US Water Enhancer Market?
The market segments include Distribution Channel .
4. Can you provide details about the market size?
The market size is estimated to be USD XX Million as of 2022.
5. What are some drivers contributing to market growth?
Rising Demand for Functional Beverages; Increasing Health Consciousness.
6. What are the notable trends driving market growth?
Consumers are increasingly seeking clean-label products with natural ingredients.
7. Are there any restraints impacting market growth?
High prices for premium or specialized water enhancers can limit their appeal to cost-conscious consumers.
8. Can you provide examples of recent developments in the market?
N/A
9. What pricing options are available for accessing the report?
Pricing options include single-user, multi-user, and enterprise licenses priced at USD 3800, USD 4500, and USD 5800 respectively.
10. Is the market size provided in terms of value or volume?
The market size is provided in terms of value, measured in Million.
11. Are there any specific market keywords associated with the report?
Yes, the market keyword associated with the report is "US Water Enhancer Market," which aids in identifying and referencing the specific market segment covered.
12. How do I determine which pricing option suits my needs best?
The pricing options vary based on user requirements and access needs. Individual users may opt for single-user licenses, while businesses requiring broader access may choose multi-user or enterprise licenses for cost-effective access to the report.
13. Are there any additional resources or data provided in the US Water Enhancer Market report?
While the report offers comprehensive insights, it's advisable to review the specific contents or supplementary materials provided to ascertain if additional resources or data are available.
14. How can I stay updated on further developments or reports in the US Water Enhancer Market?
To stay informed about further developments, trends, and reports in the US Water Enhancer Market, consider subscribing to industry newsletters, following relevant companies and organizations, or regularly checking reputable industry news sources and publications.
Methodology
Step 1 - Identification of Relevant Samples Size from Population Database


Step 2 - Approaches for Defining Global Market Size (Value, Volume* & Price*)

Note*: In applicable scenarios
Step 3 - Data Sources
Primary Research
- Web Analytics
- Survey Reports
- Research Institute
- Latest Research Reports
- Opinion Leaders
Secondary Research
- Annual Reports
- White Paper
- Latest Press Release
- Industry Association
- Paid Database
- Investor Presentations

Step 4 - Data Triangulation
Involves using different sources of information in order to increase the validity of a study
These sources are likely to be stakeholders in a program - participants, other researchers, program staff, other community members, and so on.
Then we put all data in single framework & apply various statistical tools to find out the dynamic on the market.
During the analysis stage, feedback from the stakeholder groups would be compared to determine areas of agreement as well as areas of divergence
