

Key Insights
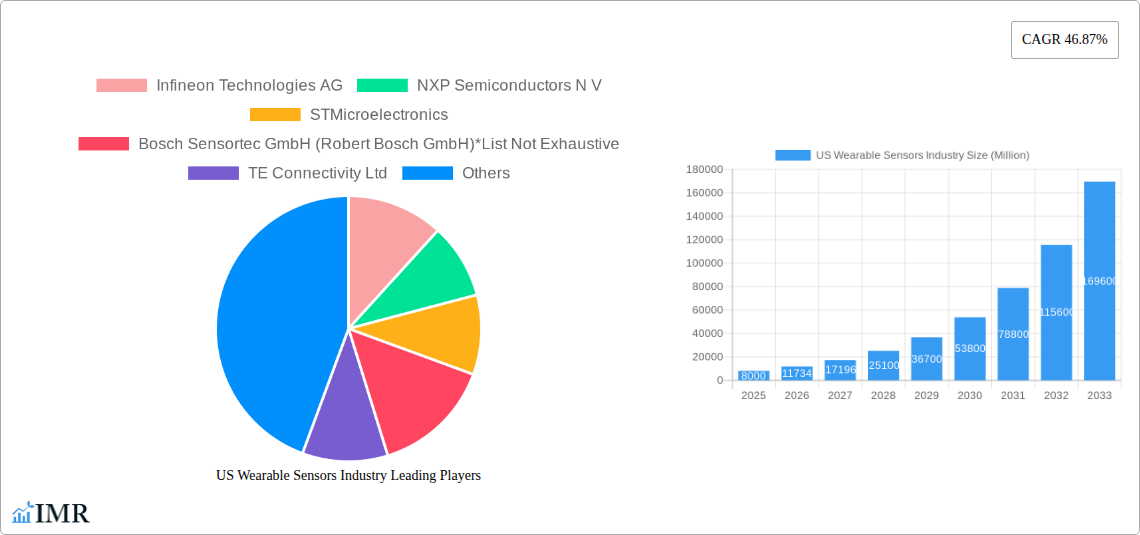
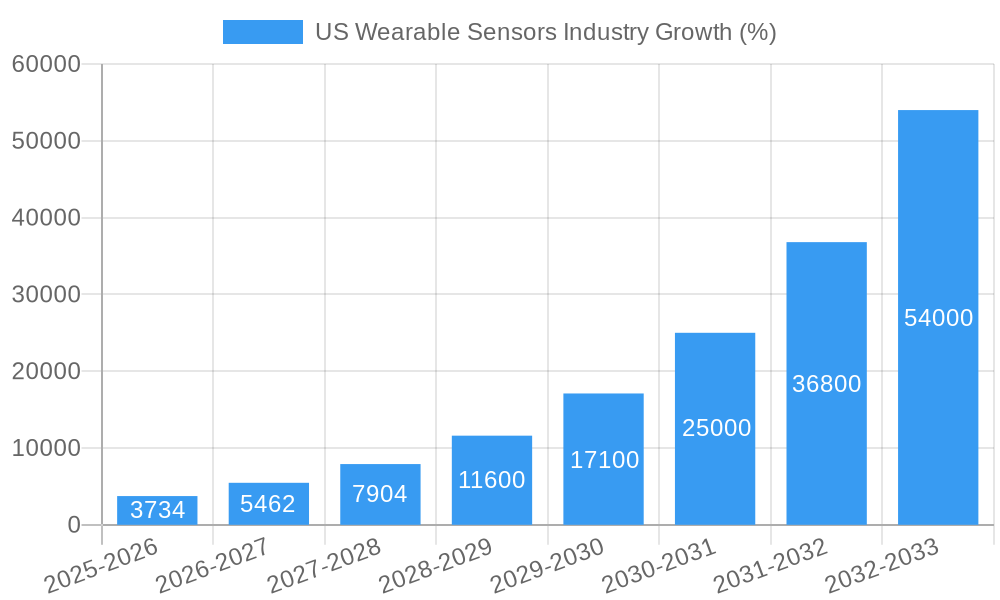
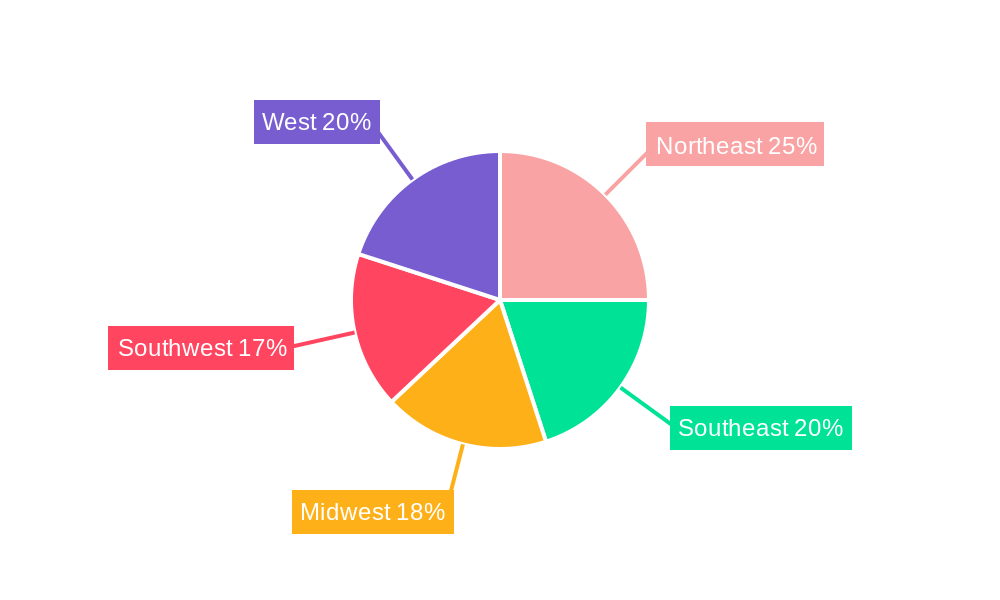
The US wearable sensor market is experiencing robust growth, fueled by increasing demand for health and wellness monitoring, safety applications, and home rehabilitation solutions. The market, currently valued at an estimated $8 billion in 2025, is projected to expand at a Compound Annual Growth Rate (CAGR) of 46.87% from 2025 to 2033. This significant growth is driven by several key factors, including the rising adoption of smartphones and other connected devices, advancements in sensor technology leading to smaller, more energy-efficient devices, and increased consumer awareness of personal health and safety. The health and wellness segment, encompassing applications like fitness trackers, heart rate monitors, and sleep trackers, dominates the market, but other segments like safety monitoring for elderly care and home rehabilitation are experiencing rapid growth, indicating a diversification of applications beyond fitness tracking. The diverse range of sensor types, including health, environmental, MEMS, and motion sensors, further contributes to market expansion, while wristwear and bodywear remain the dominant device categories. Regional analysis reveals significant market potential across the United States, with varying growth rates likely across the Northeast, Southeast, Midwest, Southwest, and West regions reflecting differences in demographics and technological adoption rates. Competition is fierce, with established players like Infineon Technologies, NXP Semiconductors, STMicroelectronics, and Bosch Sensortec, alongside other significant companies, vying for market share through innovation and strategic partnerships.
The continued miniaturization and cost reduction of sensors, coupled with the development of sophisticated data analytics capabilities, will further drive market growth. However, challenges remain, including concerns around data privacy and security, the need for improved battery life in wearable devices, and potential regulatory hurdles. Despite these challenges, the long-term outlook for the US wearable sensor market remains exceptionally positive, with significant opportunities for growth across various applications and technological advancements. The integration of wearable sensors into broader IoT ecosystems promises to create new market segments and drive even further expansion in the coming years.
US Wearable Sensors Market Report: 2019-2033
This comprehensive report provides a detailed analysis of the US wearable sensors market, encompassing market dynamics, growth trends, dominant segments, product landscape, key players, and future outlook. The study period covers 2019-2033, with 2025 as the base and estimated year. The forecast period spans 2025-2033, and the historical period is 2019-2024. This report is invaluable for industry professionals, investors, and strategic decision-makers seeking to understand and capitalize on opportunities within this rapidly evolving market. The report analyzes the parent market of "Wearable Technology" and its child market "Wearable Sensors" offering a granular view of the US landscape.
Expected Market Size (Million Units): xx (2025)
US Wearable Sensors Industry Market Dynamics & Structure
This section delves into the competitive landscape of the US wearable sensors market, examining market concentration, technological innovation, regulatory influences, and market dynamics. We analyze the interplay of various factors shaping market structure, including mergers and acquisitions (M&A) activity.
- Market Concentration: The US wearable sensors market exhibits a moderately concentrated structure, with key players holding significant market share. However, the entry of smaller, specialized companies is also noteworthy. We estimate the top 5 players hold approximately xx% market share in 2025.
- Technological Innovation: Continuous advancements in sensor technology, miniaturization, power efficiency, and wireless communication are key drivers. The integration of AI and machine learning is revolutionizing data analysis and application development. Barriers to innovation include high R&D costs and the need for regulatory compliance.
- Regulatory Frameworks: Regulations regarding data privacy, medical device approvals (for health-related applications), and cybersecurity are significant considerations. Compliance requirements influence product development and market entry strategies.
- Competitive Product Substitutes: While wearable sensors dominate in certain applications, alternative technologies like implantable sensors present competition in niche areas. The competitive landscape includes ongoing battles for improved accuracy and reduced cost.
- End-User Demographics: The increasing health consciousness of consumers, coupled with the aging population, drives growth in health and wellness applications. Other key demographics include athletes, industrial workers, and individuals requiring safety monitoring.
- M&A Trends: The market has witnessed a moderate level of M&A activity in recent years, driven by strategic expansion, technological acquisition, and market consolidation. We project xx M&A deals in the forecast period.
US Wearable Sensors Industry Growth Trends & Insights
This section presents a detailed analysis of the market's growth trajectory, including historical data and future projections. We explore adoption rates, technological advancements, and shifting consumer preferences that influence market evolution. The analysis leverages comprehensive market research data and statistical modeling to provide insights into the market size and CAGR for each segment.
(This section will contain 600 words of analysis based on the provided data and additional research. It will include specific CAGR values, market penetration rates, and detailed explanation of market trends.)
Dominant Regions, Countries, or Segments in US Wearable Sensors Industry
This section identifies the leading regions, countries, and market segments within the US wearable sensor industry, focusing on their growth drivers and factors contributing to their dominance.
By Application:
- Health and Wellness: This segment is the largest, driven by rising health consciousness, fitness tracking trends, and advancements in remote patient monitoring. Market share: xx% in 2025.
- Safety Monitoring: Growth is driven by increasing demand for worker safety in industries like construction and manufacturing. Market share: xx% in 2025.
- Home Rehabilitation: The aging population and rising incidence of chronic diseases fuel growth in this segment. Market share: xx% in 2025.
By Type:
- Health Sensors: Dominated by biometric sensors, this segment benefits from technological advancements and growing health applications. Market share: xx% in 2025.
- MEMS Sensors: Miniaturization and cost-effectiveness drive the growth of MEMS sensors across various applications. Market share: xx% in 2025.
By Device:
- Wristwear: Smartwatches and fitness trackers contribute significantly to this segment's dominance. Market share: xx% in 2025.
(This section will contain 600 words of analysis further detailing regional and segment dominance factors, including quantitative data on market shares and growth potential.)
US Wearable Sensors Industry Product Landscape
The US wearable sensors market showcases a diverse range of products featuring advanced functionalities and improved performance metrics. Innovations include smaller, more energy-efficient sensors, improved data accuracy, and integration with sophisticated software for data analysis and personalized insights. Unique selling propositions often center on enhanced comfort, improved wearability, and data-driven insights for enhanced user experience. Technological advancements are particularly focused on improving sensor miniaturization, data processing speed, and power consumption.
Key Drivers, Barriers & Challenges in US Wearable Sensors Industry
Key Drivers:
- Increasing demand for health and wellness monitoring.
- Advancements in sensor technology, miniaturization, and power efficiency.
- Growing adoption of IoT and smart devices.
- Increased government funding for research and development.
Challenges & Restraints:
- High R&D costs and time-to-market challenges.
- Data privacy concerns and regulatory hurdles.
- Interoperability issues and data standardization.
- Competition from established and emerging players.
- Supply chain disruptions.
Emerging Opportunities in US Wearable Sensors Industry
Emerging opportunities include the expansion of wearable sensors into new applications, such as environmental monitoring and industrial safety. The development of advanced analytics and AI-driven solutions for data interpretation creates new avenues for personalized health management and predictive diagnostics. The growing demand for improved accuracy and personalized experiences offers opportunities to develop sensors with enhanced capabilities.
Growth Accelerators in the US Wearable Sensors Industry
Long-term growth in the US wearable sensors market will be driven by several factors, including continued technological advancements, the development of new applications for sensors, and the expansion of the market into new demographics and industries. Strategic partnerships between sensor manufacturers, technology companies, and healthcare providers will play a significant role in accelerating market growth.
Key Players Shaping the US Wearable Sensors Industry Market
- Infineon Technologies AG
- NXP Semiconductors N.V.
- STMicroelectronics
- Bosch Sensortec GmbH (Robert Bosch GmbH)
- TE Connectivity Ltd
- Texas Instruments Incorporated
- Analog Devices Inc
- Freescale Semiconductor Inc
- InvenSense Inc
- Panasonic Corporation
Notable Milestones in US Wearable Sensors Industry Sector
- September 2020: Apple launched the Apple Watch Series 6, introducing blood oxygen monitoring capabilities and expanding the market for health-focused wearables.
- January 2021: NeuTigers launched CovidDeep, a clinically validated solution using wearable sensor data for COVID-19 triage, demonstrating the potential of wearable sensors in healthcare applications.
In-Depth US Wearable Sensors Industry Market Outlook
The US wearable sensors market is poised for significant growth in the coming years, driven by technological advancements, expanding applications, and increased consumer adoption. Strategic opportunities exist for companies to develop innovative products, forge strategic partnerships, and tap into emerging markets. The long-term potential is substantial, offering considerable returns for investors and stakeholders.
US Wearable Sensors Industry Segmentation
-
1. Type
- 1.1. Health Sensors
- 1.2. Environmental Sensors
- 1.3. MEMS Sensors
- 1.4. Motion Sensors
- 1.5. Others
-
2. Device
- 2.1. Wristwear
- 2.2. Bodywear and Footwear
- 2.3. Others
-
3. Application
- 3.1. Health and Wellness
- 3.2. Safety Monitoring
- 3.3. Home Rehabilitation
- 3.4. Others
US Wearable Sensors Industry Segmentation By Geography
-
1. North America
- 1.1. United States
- 1.2. Canada
- 1.3. Mexico
-
2. South America
- 2.1. Brazil
- 2.2. Argentina
- 2.3. Rest of South America
-
3. Europe
- 3.1. United Kingdom
- 3.2. Germany
- 3.3. France
- 3.4. Italy
- 3.5. Spain
- 3.6. Russia
- 3.7. Benelux
- 3.8. Nordics
- 3.9. Rest of Europe
-
4. Middle East & Africa
- 4.1. Turkey
- 4.2. Israel
- 4.3. GCC
- 4.4. North Africa
- 4.5. South Africa
- 4.6. Rest of Middle East & Africa
-
5. Asia Pacific
- 5.1. China
- 5.2. India
- 5.3. Japan
- 5.4. South Korea
- 5.5. ASEAN
- 5.6. Oceania
- 5.7. Rest of Asia Pacific
US Wearable Sensors Industry REPORT HIGHLIGHTS
| Aspects | Details |
|---|---|
| Study Period | 2019-2033 |
| Base Year | 2024 |
| Estimated Year | 2025 |
| Forecast Period | 2025-2033 |
| Historical Period | 2019-2024 |
| Growth Rate | CAGR of 46.87% from 2019-2033 |
| Segmentation |
|
Table of Contents
- 1. Introduction
- 1.1. Research Scope
- 1.2. Market Segmentation
- 1.3. Research Methodology
- 1.4. Definitions and Assumptions
- 2. Executive Summary
- 2.1. Introduction
- 3. Market Dynamics
- 3.1. Introduction
- 3.2. Market Drivers
- 3.2.1. Rapid technological developments and miniaturization of sensors; Increasing applications in the industrial sector
- 3.3. Market Restrains
- 3.3.1. High initial costs for large scale implementation in industries
- 3.4. Market Trends
- 3.4.1. Increase in demand of wearable fitness devices is driving the market
- 4. Market Factor Analysis
- 4.1. Porters Five Forces
- 4.2. Supply/Value Chain
- 4.3. PESTEL analysis
- 4.4. Market Entropy
- 4.5. Patent/Trademark Analysis
- 5. Global US Wearable Sensors Industry Analysis, Insights and Forecast, 2019-2031
- 5.1. Market Analysis, Insights and Forecast - by Type
- 5.1.1. Health Sensors
- 5.1.2. Environmental Sensors
- 5.1.3. MEMS Sensors
- 5.1.4. Motion Sensors
- 5.1.5. Others
- 5.2. Market Analysis, Insights and Forecast - by Device
- 5.2.1. Wristwear
- 5.2.2. Bodywear and Footwear
- 5.2.3. Others
- 5.3. Market Analysis, Insights and Forecast - by Application
- 5.3.1. Health and Wellness
- 5.3.2. Safety Monitoring
- 5.3.3. Home Rehabilitation
- 5.3.4. Others
- 5.4. Market Analysis, Insights and Forecast - by Region
- 5.4.1. North America
- 5.4.2. South America
- 5.4.3. Europe
- 5.4.4. Middle East & Africa
- 5.4.5. Asia Pacific
- 5.1. Market Analysis, Insights and Forecast - by Type
- 6. North America US Wearable Sensors Industry Analysis, Insights and Forecast, 2019-2031
- 6.1. Market Analysis, Insights and Forecast - by Type
- 6.1.1. Health Sensors
- 6.1.2. Environmental Sensors
- 6.1.3. MEMS Sensors
- 6.1.4. Motion Sensors
- 6.1.5. Others
- 6.2. Market Analysis, Insights and Forecast - by Device
- 6.2.1. Wristwear
- 6.2.2. Bodywear and Footwear
- 6.2.3. Others
- 6.3. Market Analysis, Insights and Forecast - by Application
- 6.3.1. Health and Wellness
- 6.3.2. Safety Monitoring
- 6.3.3. Home Rehabilitation
- 6.3.4. Others
- 6.1. Market Analysis, Insights and Forecast - by Type
- 7. South America US Wearable Sensors Industry Analysis, Insights and Forecast, 2019-2031
- 7.1. Market Analysis, Insights and Forecast - by Type
- 7.1.1. Health Sensors
- 7.1.2. Environmental Sensors
- 7.1.3. MEMS Sensors
- 7.1.4. Motion Sensors
- 7.1.5. Others
- 7.2. Market Analysis, Insights and Forecast - by Device
- 7.2.1. Wristwear
- 7.2.2. Bodywear and Footwear
- 7.2.3. Others
- 7.3. Market Analysis, Insights and Forecast - by Application
- 7.3.1. Health and Wellness
- 7.3.2. Safety Monitoring
- 7.3.3. Home Rehabilitation
- 7.3.4. Others
- 7.1. Market Analysis, Insights and Forecast - by Type
- 8. Europe US Wearable Sensors Industry Analysis, Insights and Forecast, 2019-2031
- 8.1. Market Analysis, Insights and Forecast - by Type
- 8.1.1. Health Sensors
- 8.1.2. Environmental Sensors
- 8.1.3. MEMS Sensors
- 8.1.4. Motion Sensors
- 8.1.5. Others
- 8.2. Market Analysis, Insights and Forecast - by Device
- 8.2.1. Wristwear
- 8.2.2. Bodywear and Footwear
- 8.2.3. Others
- 8.3. Market Analysis, Insights and Forecast - by Application
- 8.3.1. Health and Wellness
- 8.3.2. Safety Monitoring
- 8.3.3. Home Rehabilitation
- 8.3.4. Others
- 8.1. Market Analysis, Insights and Forecast - by Type
- 9. Middle East & Africa US Wearable Sensors Industry Analysis, Insights and Forecast, 2019-2031
- 9.1. Market Analysis, Insights and Forecast - by Type
- 9.1.1. Health Sensors
- 9.1.2. Environmental Sensors
- 9.1.3. MEMS Sensors
- 9.1.4. Motion Sensors
- 9.1.5. Others
- 9.2. Market Analysis, Insights and Forecast - by Device
- 9.2.1. Wristwear
- 9.2.2. Bodywear and Footwear
- 9.2.3. Others
- 9.3. Market Analysis, Insights and Forecast - by Application
- 9.3.1. Health and Wellness
- 9.3.2. Safety Monitoring
- 9.3.3. Home Rehabilitation
- 9.3.4. Others
- 9.1. Market Analysis, Insights and Forecast - by Type
- 10. Asia Pacific US Wearable Sensors Industry Analysis, Insights and Forecast, 2019-2031
- 10.1. Market Analysis, Insights and Forecast - by Type
- 10.1.1. Health Sensors
- 10.1.2. Environmental Sensors
- 10.1.3. MEMS Sensors
- 10.1.4. Motion Sensors
- 10.1.5. Others
- 10.2. Market Analysis, Insights and Forecast - by Device
- 10.2.1. Wristwear
- 10.2.2. Bodywear and Footwear
- 10.2.3. Others
- 10.3. Market Analysis, Insights and Forecast - by Application
- 10.3.1. Health and Wellness
- 10.3.2. Safety Monitoring
- 10.3.3. Home Rehabilitation
- 10.3.4. Others
- 10.1. Market Analysis, Insights and Forecast - by Type
- 11. Northeast US Wearable Sensors Industry Analysis, Insights and Forecast, 2019-2031
- 12. Southeast US Wearable Sensors Industry Analysis, Insights and Forecast, 2019-2031
- 13. Midwest US Wearable Sensors Industry Analysis, Insights and Forecast, 2019-2031
- 14. Southwest US Wearable Sensors Industry Analysis, Insights and Forecast, 2019-2031
- 15. West US Wearable Sensors Industry Analysis, Insights and Forecast, 2019-2031
- 16. Competitive Analysis
- 16.1. Global Market Share Analysis 2024
- 16.2. Company Profiles
- 16.2.1 Infineon Technologies AG
- 16.2.1.1. Overview
- 16.2.1.2. Products
- 16.2.1.3. SWOT Analysis
- 16.2.1.4. Recent Developments
- 16.2.1.5. Financials (Based on Availability)
- 16.2.2 NXP Semiconductors N V
- 16.2.2.1. Overview
- 16.2.2.2. Products
- 16.2.2.3. SWOT Analysis
- 16.2.2.4. Recent Developments
- 16.2.2.5. Financials (Based on Availability)
- 16.2.3 STMicroelectronics
- 16.2.3.1. Overview
- 16.2.3.2. Products
- 16.2.3.3. SWOT Analysis
- 16.2.3.4. Recent Developments
- 16.2.3.5. Financials (Based on Availability)
- 16.2.4 Bosch Sensortec GmbH (Robert Bosch GmbH)*List Not Exhaustive
- 16.2.4.1. Overview
- 16.2.4.2. Products
- 16.2.4.3. SWOT Analysis
- 16.2.4.4. Recent Developments
- 16.2.4.5. Financials (Based on Availability)
- 16.2.5 TE Connectivity Ltd
- 16.2.5.1. Overview
- 16.2.5.2. Products
- 16.2.5.3. SWOT Analysis
- 16.2.5.4. Recent Developments
- 16.2.5.5. Financials (Based on Availability)
- 16.2.6 Texas Instruments Incorporated
- 16.2.6.1. Overview
- 16.2.6.2. Products
- 16.2.6.3. SWOT Analysis
- 16.2.6.4. Recent Developments
- 16.2.6.5. Financials (Based on Availability)
- 16.2.7 Analog Devices Inc
- 16.2.7.1. Overview
- 16.2.7.2. Products
- 16.2.7.3. SWOT Analysis
- 16.2.7.4. Recent Developments
- 16.2.7.5. Financials (Based on Availability)
- 16.2.8 Freescale Semiconductor Inc
- 16.2.8.1. Overview
- 16.2.8.2. Products
- 16.2.8.3. SWOT Analysis
- 16.2.8.4. Recent Developments
- 16.2.8.5. Financials (Based on Availability)
- 16.2.9 InvenSense Inc
- 16.2.9.1. Overview
- 16.2.9.2. Products
- 16.2.9.3. SWOT Analysis
- 16.2.9.4. Recent Developments
- 16.2.9.5. Financials (Based on Availability)
- 16.2.10 Panasonic Corporation
- 16.2.10.1. Overview
- 16.2.10.2. Products
- 16.2.10.3. SWOT Analysis
- 16.2.10.4. Recent Developments
- 16.2.10.5. Financials (Based on Availability)
- 16.2.1 Infineon Technologies AG
List of Figures
- Figure 1: Global US Wearable Sensors Industry Revenue Breakdown (Million, %) by Region 2024 & 2032
- Figure 2: United states US Wearable Sensors Industry Revenue (Million), by Country 2024 & 2032
- Figure 3: United states US Wearable Sensors Industry Revenue Share (%), by Country 2024 & 2032
- Figure 4: North America US Wearable Sensors Industry Revenue (Million), by Type 2024 & 2032
- Figure 5: North America US Wearable Sensors Industry Revenue Share (%), by Type 2024 & 2032
- Figure 6: North America US Wearable Sensors Industry Revenue (Million), by Device 2024 & 2032
- Figure 7: North America US Wearable Sensors Industry Revenue Share (%), by Device 2024 & 2032
- Figure 8: North America US Wearable Sensors Industry Revenue (Million), by Application 2024 & 2032
- Figure 9: North America US Wearable Sensors Industry Revenue Share (%), by Application 2024 & 2032
- Figure 10: North America US Wearable Sensors Industry Revenue (Million), by Country 2024 & 2032
- Figure 11: North America US Wearable Sensors Industry Revenue Share (%), by Country 2024 & 2032
- Figure 12: South America US Wearable Sensors Industry Revenue (Million), by Type 2024 & 2032
- Figure 13: South America US Wearable Sensors Industry Revenue Share (%), by Type 2024 & 2032
- Figure 14: South America US Wearable Sensors Industry Revenue (Million), by Device 2024 & 2032
- Figure 15: South America US Wearable Sensors Industry Revenue Share (%), by Device 2024 & 2032
- Figure 16: South America US Wearable Sensors Industry Revenue (Million), by Application 2024 & 2032
- Figure 17: South America US Wearable Sensors Industry Revenue Share (%), by Application 2024 & 2032
- Figure 18: South America US Wearable Sensors Industry Revenue (Million), by Country 2024 & 2032
- Figure 19: South America US Wearable Sensors Industry Revenue Share (%), by Country 2024 & 2032
- Figure 20: Europe US Wearable Sensors Industry Revenue (Million), by Type 2024 & 2032
- Figure 21: Europe US Wearable Sensors Industry Revenue Share (%), by Type 2024 & 2032
- Figure 22: Europe US Wearable Sensors Industry Revenue (Million), by Device 2024 & 2032
- Figure 23: Europe US Wearable Sensors Industry Revenue Share (%), by Device 2024 & 2032
- Figure 24: Europe US Wearable Sensors Industry Revenue (Million), by Application 2024 & 2032
- Figure 25: Europe US Wearable Sensors Industry Revenue Share (%), by Application 2024 & 2032
- Figure 26: Europe US Wearable Sensors Industry Revenue (Million), by Country 2024 & 2032
- Figure 27: Europe US Wearable Sensors Industry Revenue Share (%), by Country 2024 & 2032
- Figure 28: Middle East & Africa US Wearable Sensors Industry Revenue (Million), by Type 2024 & 2032
- Figure 29: Middle East & Africa US Wearable Sensors Industry Revenue Share (%), by Type 2024 & 2032
- Figure 30: Middle East & Africa US Wearable Sensors Industry Revenue (Million), by Device 2024 & 2032
- Figure 31: Middle East & Africa US Wearable Sensors Industry Revenue Share (%), by Device 2024 & 2032
- Figure 32: Middle East & Africa US Wearable Sensors Industry Revenue (Million), by Application 2024 & 2032
- Figure 33: Middle East & Africa US Wearable Sensors Industry Revenue Share (%), by Application 2024 & 2032
- Figure 34: Middle East & Africa US Wearable Sensors Industry Revenue (Million), by Country 2024 & 2032
- Figure 35: Middle East & Africa US Wearable Sensors Industry Revenue Share (%), by Country 2024 & 2032
- Figure 36: Asia Pacific US Wearable Sensors Industry Revenue (Million), by Type 2024 & 2032
- Figure 37: Asia Pacific US Wearable Sensors Industry Revenue Share (%), by Type 2024 & 2032
- Figure 38: Asia Pacific US Wearable Sensors Industry Revenue (Million), by Device 2024 & 2032
- Figure 39: Asia Pacific US Wearable Sensors Industry Revenue Share (%), by Device 2024 & 2032
- Figure 40: Asia Pacific US Wearable Sensors Industry Revenue (Million), by Application 2024 & 2032
- Figure 41: Asia Pacific US Wearable Sensors Industry Revenue Share (%), by Application 2024 & 2032
- Figure 42: Asia Pacific US Wearable Sensors Industry Revenue (Million), by Country 2024 & 2032
- Figure 43: Asia Pacific US Wearable Sensors Industry Revenue Share (%), by Country 2024 & 2032
List of Tables
- Table 1: Global US Wearable Sensors Industry Revenue Million Forecast, by Region 2019 & 2032
- Table 2: Global US Wearable Sensors Industry Revenue Million Forecast, by Type 2019 & 2032
- Table 3: Global US Wearable Sensors Industry Revenue Million Forecast, by Device 2019 & 2032
- Table 4: Global US Wearable Sensors Industry Revenue Million Forecast, by Application 2019 & 2032
- Table 5: Global US Wearable Sensors Industry Revenue Million Forecast, by Region 2019 & 2032
- Table 6: Global US Wearable Sensors Industry Revenue Million Forecast, by Country 2019 & 2032
- Table 7: Northeast US Wearable Sensors Industry Revenue (Million) Forecast, by Application 2019 & 2032
- Table 8: Southeast US Wearable Sensors Industry Revenue (Million) Forecast, by Application 2019 & 2032
- Table 9: Midwest US Wearable Sensors Industry Revenue (Million) Forecast, by Application 2019 & 2032
- Table 10: Southwest US Wearable Sensors Industry Revenue (Million) Forecast, by Application 2019 & 2032
- Table 11: West US Wearable Sensors Industry Revenue (Million) Forecast, by Application 2019 & 2032
- Table 12: Global US Wearable Sensors Industry Revenue Million Forecast, by Type 2019 & 2032
- Table 13: Global US Wearable Sensors Industry Revenue Million Forecast, by Device 2019 & 2032
- Table 14: Global US Wearable Sensors Industry Revenue Million Forecast, by Application 2019 & 2032
- Table 15: Global US Wearable Sensors Industry Revenue Million Forecast, by Country 2019 & 2032
- Table 16: United States US Wearable Sensors Industry Revenue (Million) Forecast, by Application 2019 & 2032
- Table 17: Canada US Wearable Sensors Industry Revenue (Million) Forecast, by Application 2019 & 2032
- Table 18: Mexico US Wearable Sensors Industry Revenue (Million) Forecast, by Application 2019 & 2032
- Table 19: Global US Wearable Sensors Industry Revenue Million Forecast, by Type 2019 & 2032
- Table 20: Global US Wearable Sensors Industry Revenue Million Forecast, by Device 2019 & 2032
- Table 21: Global US Wearable Sensors Industry Revenue Million Forecast, by Application 2019 & 2032
- Table 22: Global US Wearable Sensors Industry Revenue Million Forecast, by Country 2019 & 2032
- Table 23: Brazil US Wearable Sensors Industry Revenue (Million) Forecast, by Application 2019 & 2032
- Table 24: Argentina US Wearable Sensors Industry Revenue (Million) Forecast, by Application 2019 & 2032
- Table 25: Rest of South America US Wearable Sensors Industry Revenue (Million) Forecast, by Application 2019 & 2032
- Table 26: Global US Wearable Sensors Industry Revenue Million Forecast, by Type 2019 & 2032
- Table 27: Global US Wearable Sensors Industry Revenue Million Forecast, by Device 2019 & 2032
- Table 28: Global US Wearable Sensors Industry Revenue Million Forecast, by Application 2019 & 2032
- Table 29: Global US Wearable Sensors Industry Revenue Million Forecast, by Country 2019 & 2032
- Table 30: United Kingdom US Wearable Sensors Industry Revenue (Million) Forecast, by Application 2019 & 2032
- Table 31: Germany US Wearable Sensors Industry Revenue (Million) Forecast, by Application 2019 & 2032
- Table 32: France US Wearable Sensors Industry Revenue (Million) Forecast, by Application 2019 & 2032
- Table 33: Italy US Wearable Sensors Industry Revenue (Million) Forecast, by Application 2019 & 2032
- Table 34: Spain US Wearable Sensors Industry Revenue (Million) Forecast, by Application 2019 & 2032
- Table 35: Russia US Wearable Sensors Industry Revenue (Million) Forecast, by Application 2019 & 2032
- Table 36: Benelux US Wearable Sensors Industry Revenue (Million) Forecast, by Application 2019 & 2032
- Table 37: Nordics US Wearable Sensors Industry Revenue (Million) Forecast, by Application 2019 & 2032
- Table 38: Rest of Europe US Wearable Sensors Industry Revenue (Million) Forecast, by Application 2019 & 2032
- Table 39: Global US Wearable Sensors Industry Revenue Million Forecast, by Type 2019 & 2032
- Table 40: Global US Wearable Sensors Industry Revenue Million Forecast, by Device 2019 & 2032
- Table 41: Global US Wearable Sensors Industry Revenue Million Forecast, by Application 2019 & 2032
- Table 42: Global US Wearable Sensors Industry Revenue Million Forecast, by Country 2019 & 2032
- Table 43: Turkey US Wearable Sensors Industry Revenue (Million) Forecast, by Application 2019 & 2032
- Table 44: Israel US Wearable Sensors Industry Revenue (Million) Forecast, by Application 2019 & 2032
- Table 45: GCC US Wearable Sensors Industry Revenue (Million) Forecast, by Application 2019 & 2032
- Table 46: North Africa US Wearable Sensors Industry Revenue (Million) Forecast, by Application 2019 & 2032
- Table 47: South Africa US Wearable Sensors Industry Revenue (Million) Forecast, by Application 2019 & 2032
- Table 48: Rest of Middle East & Africa US Wearable Sensors Industry Revenue (Million) Forecast, by Application 2019 & 2032
- Table 49: Global US Wearable Sensors Industry Revenue Million Forecast, by Type 2019 & 2032
- Table 50: Global US Wearable Sensors Industry Revenue Million Forecast, by Device 2019 & 2032
- Table 51: Global US Wearable Sensors Industry Revenue Million Forecast, by Application 2019 & 2032
- Table 52: Global US Wearable Sensors Industry Revenue Million Forecast, by Country 2019 & 2032
- Table 53: China US Wearable Sensors Industry Revenue (Million) Forecast, by Application 2019 & 2032
- Table 54: India US Wearable Sensors Industry Revenue (Million) Forecast, by Application 2019 & 2032
- Table 55: Japan US Wearable Sensors Industry Revenue (Million) Forecast, by Application 2019 & 2032
- Table 56: South Korea US Wearable Sensors Industry Revenue (Million) Forecast, by Application 2019 & 2032
- Table 57: ASEAN US Wearable Sensors Industry Revenue (Million) Forecast, by Application 2019 & 2032
- Table 58: Oceania US Wearable Sensors Industry Revenue (Million) Forecast, by Application 2019 & 2032
- Table 59: Rest of Asia Pacific US Wearable Sensors Industry Revenue (Million) Forecast, by Application 2019 & 2032
Frequently Asked Questions
1. What is the projected Compound Annual Growth Rate (CAGR) of the US Wearable Sensors Industry?
The projected CAGR is approximately 46.87%.
2. Which companies are prominent players in the US Wearable Sensors Industry?
Key companies in the market include Infineon Technologies AG, NXP Semiconductors N V, STMicroelectronics, Bosch Sensortec GmbH (Robert Bosch GmbH)*List Not Exhaustive, TE Connectivity Ltd, Texas Instruments Incorporated, Analog Devices Inc, Freescale Semiconductor Inc, InvenSense Inc, Panasonic Corporation.
3. What are the main segments of the US Wearable Sensors Industry?
The market segments include Type, Device, Application.
4. Can you provide details about the market size?
The market size is estimated to be USD XX Million as of 2022.
5. What are some drivers contributing to market growth?
Rapid technological developments and miniaturization of sensors; Increasing applications in the industrial sector.
6. What are the notable trends driving market growth?
Increase in demand of wearable fitness devices is driving the market.
7. Are there any restraints impacting market growth?
High initial costs for large scale implementation in industries.
8. Can you provide examples of recent developments in the market?
September 2020: Apple launched the Apple watch series 6, which is the latest smartwatch that enables blood oxygen monitoring and measures oxygen saturation in the blood for a better understanding of fitness and wellness.
9. What pricing options are available for accessing the report?
Pricing options include single-user, multi-user, and enterprise licenses priced at USD 3800, USD 4500, and USD 5800 respectively.
10. Is the market size provided in terms of value or volume?
The market size is provided in terms of value, measured in Million.
11. Are there any specific market keywords associated with the report?
Yes, the market keyword associated with the report is "US Wearable Sensors Industry," which aids in identifying and referencing the specific market segment covered.
12. How do I determine which pricing option suits my needs best?
The pricing options vary based on user requirements and access needs. Individual users may opt for single-user licenses, while businesses requiring broader access may choose multi-user or enterprise licenses for cost-effective access to the report.
13. Are there any additional resources or data provided in the US Wearable Sensors Industry report?
While the report offers comprehensive insights, it's advisable to review the specific contents or supplementary materials provided to ascertain if additional resources or data are available.
14. How can I stay updated on further developments or reports in the US Wearable Sensors Industry?
To stay informed about further developments, trends, and reports in the US Wearable Sensors Industry, consider subscribing to industry newsletters, following relevant companies and organizations, or regularly checking reputable industry news sources and publications.
Methodology
Step 1 - Identification of Relevant Samples Size from Population Database


Step 2 - Approaches for Defining Global Market Size (Value, Volume* & Price*)

Note*: In applicable scenarios
Step 3 - Data Sources
Primary Research
- Web Analytics
- Survey Reports
- Research Institute
- Latest Research Reports
- Opinion Leaders
Secondary Research
- Annual Reports
- White Paper
- Latest Press Release
- Industry Association
- Paid Database
- Investor Presentations

Step 4 - Data Triangulation
Involves using different sources of information in order to increase the validity of a study
These sources are likely to be stakeholders in a program - participants, other researchers, program staff, other community members, and so on.
Then we put all data in single framework & apply various statistical tools to find out the dynamic on the market.
During the analysis stage, feedback from the stakeholder groups would be compared to determine areas of agreement as well as areas of divergence
