

Key Insights
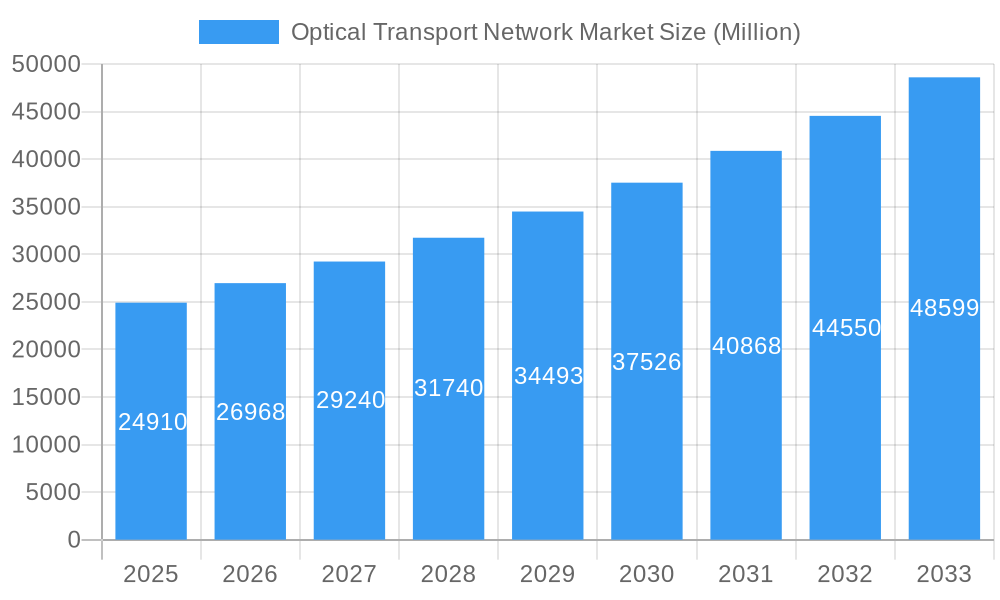
The Optical Transport Network (OTN) market is experiencing robust growth, projected to reach $24.91 billion in 2025 and maintain a Compound Annual Growth Rate (CAGR) of 8.41% from 2025 to 2033. This expansion is fueled by several key factors. The increasing demand for high-bandwidth applications, such as 5G deployment, cloud computing, and the proliferation of data centers, is driving the need for advanced OTN solutions capable of handling massive data volumes and ensuring low latency. Furthermore, the ongoing migration to higher-capacity wavelengths (e.g., 400G and 800G) and the adoption of coherent optical technologies like DWDM are significantly boosting market growth. Technological advancements, such as improved optical amplifiers and flexible grid technologies, are enabling greater network efficiency and scalability, further contributing to the market's expansion. The rising adoption of OTN services in diverse sectors, including IT and telecom, healthcare, and government, is also a key driver. While challenges exist, such as the high initial investment costs associated with OTN infrastructure upgrades, the long-term benefits in terms of network capacity and reliability outweigh these concerns for many businesses.
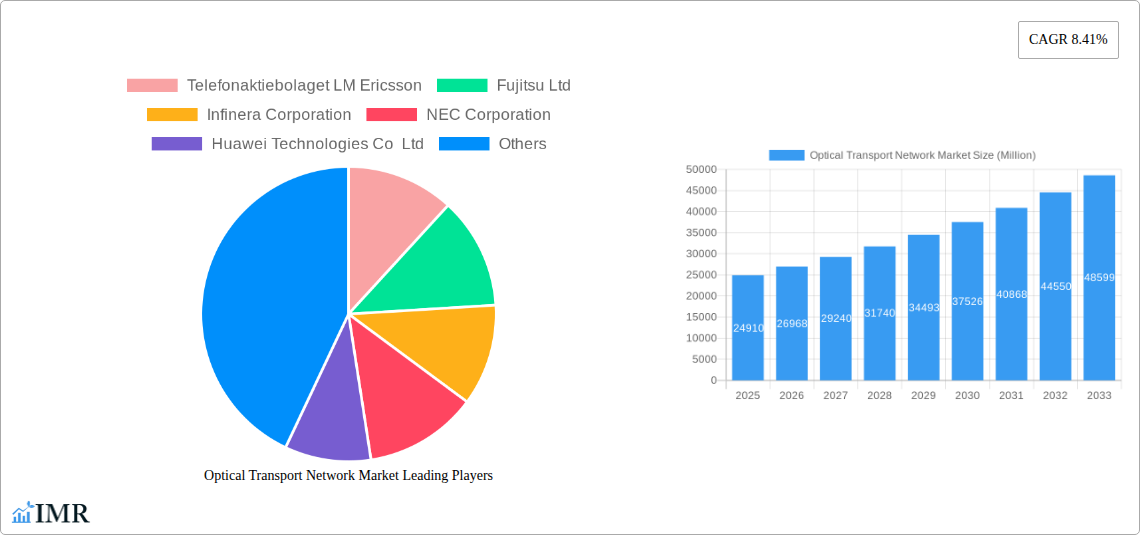
Optical Transport Network Market Market Size (In Billion)
The market segmentation reveals a diverse landscape. WDM and DWDM technologies are currently dominating the technology segment, but other technologies, such as those supporting flexible grid architectures, are poised for substantial growth. The service offering segment is expected to hold a significant market share, driven by the increasing demand for managed OTN services from businesses seeking to reduce operational complexity. The North American region is anticipated to retain a substantial market share due to the high concentration of data centers and advanced technological infrastructure. However, rapid growth is expected in the Asia-Pacific region, driven by the surging demand for improved digital infrastructure in developing economies. Key players like Ericsson, Fujitsu, Infinera, NEC, Huawei, ZTE, Cisco, Nokia, Yokogawa, and Ciena are actively shaping the market through innovation and strategic partnerships, further intensifying competition and fostering market growth. The overall outlook for the OTN market remains exceptionally positive, promising substantial opportunities for stakeholders in the coming years.
Optical Transport Network Market Company Market Share
Optical Transport Network Market: A Comprehensive Report (2019-2033)
This in-depth report provides a comprehensive analysis of the Optical Transport Network (OTN) market, encompassing market dynamics, growth trends, regional dominance, product landscape, key players, and future outlook. The study period covers 2019-2033, with 2025 as the base and estimated year. The report segments the market by technology (WDM, DWDM, other technologies), offering (service, network design, component), and end-user vertical (IT and Telecom, Healthcare, Government, other end-user verticals). The market is valued at xx Million units in 2025 and is projected to reach xx Million units by 2033.
Optical Transport Network Market Dynamics & Structure
The Optical Transport Network market is characterized by a moderately concentrated landscape with a few major players holding significant market share. Technological innovation, particularly in high-capacity coherent optical transmission and software-defined networking (SDN), is a key driver. Regulatory frameworks impacting network infrastructure deployment and spectrum allocation influence market growth. The market experiences competitive pressure from alternative technologies like microwave backhaul, but OTN’s advantages in long-haul, high-bandwidth transmission maintain its dominance. M&A activity has been moderate, with strategic acquisitions aimed at expanding technology portfolios and geographic reach.
- Market Concentration: The top 5 players hold approximately xx% of the market share in 2025.
- Technological Innovation: Advancements in coherent detection, advanced modulation formats (e.g., 800G, 1.6T), and flexible grid technologies are driving growth.
- Regulatory Landscape: Government policies and spectrum allocation significantly impact network deployment and market expansion.
- Competitive Substitutes: Microwave backhaul and satellite communication pose some competition, particularly in shorter distances.
- End-User Demographics: The IT and Telecom sector remains the dominant end-user, followed by the Government sector.
- M&A Trends: xx M&A deals were recorded in the past 5 years, mostly focused on technology integration and expansion into new markets.
Optical Transport Network Market Growth Trends & Insights
The Optical Transport Network market experienced significant growth between 2019 and 2024, driven by increasing demand for high-bandwidth connectivity across various sectors. The market size expanded from xx Million units in 2019 to xx Million units in 2024, registering a CAGR of xx%. This growth is fueled by the proliferation of cloud computing, 5G network deployments, and the growing adoption of data-intensive applications. Technological disruptions such as the introduction of 800G and beyond coherent optical technologies are further accelerating market expansion. Consumer behavior shifts toward higher bandwidth consumption and reliance on cloud services are also key drivers. The market penetration rate of OTN in the global telecommunications infrastructure is expected to reach xx% by 2033.
Dominant Regions, Countries, or Segments in Optical Transport Network Market
North America and Europe are currently the dominant regions in the OTN market, driven by mature telecommunications infrastructure and high adoption rates of advanced technologies. Within these regions, the IT and Telecom sector is the leading end-user vertical. Asia-Pacific is experiencing rapid growth, fueled by substantial investments in network infrastructure and the expansion of 5G networks. The WDM and DWDM technologies dominate the market, while the component segment shows strong growth due to increasing demand for high-performance optical components.
- Key Drivers:
- North America & Europe: High broadband penetration, strong regulatory support, and significant investment in network upgrades.
- Asia-Pacific: Rapid growth of data centers, expanding 5G infrastructure, and increasing government investments in digital infrastructure.
- Dominant Segments:
- Technology: WDM and DWDM technology holds the largest market share due to their maturity and widespread adoption.
- Offering: The component segment is experiencing fast growth owing to the increasing demand for advanced optical components.
- End-user: The IT and Telecom sector remains the leading end-user of OTN, driven by the increasing demand for high-bandwidth connectivity.
Optical Transport Network Market Product Landscape
The OTN product landscape is characterized by continuous innovation in coherent optical transmission technology, with a focus on higher spectral efficiency and capacity. Products include various optical transponders, multiplexers, and ROADMs (Reconfigurable Optical Add-Drop Multiplexers) with advanced features like flexible grid, and support for various modulation formats. These advancements allow network operators to optimize their networks for various applications, ranging from long-haul backbone networks to metro access networks. The key selling propositions focus on improved spectral efficiency, reduced latency, and enhanced network flexibility.
Key Drivers, Barriers & Challenges in Optical Transport Network Market
Key Drivers: The increasing demand for high-bandwidth connectivity, driven by cloud computing, 5G, and data-intensive applications, is the primary driver. Furthermore, advancements in coherent optical technology and the adoption of software-defined networking are accelerating market growth. Government initiatives to promote digital infrastructure development also play a significant role.
Key Challenges: High initial investment costs for OTN infrastructure pose a barrier to adoption, particularly in developing regions. Competition from alternative technologies and supply chain disruptions due to global events also present challenges. Furthermore, regulatory complexities and the need for skilled workforce can slow down market growth.
Emerging Opportunities in Optical Transport Network Market
Emerging opportunities lie in the expansion of 5G networks, the growth of cloud computing, and the increasing adoption of the Internet of Things (IoT). Untapped markets in developing regions present significant potential. Innovative applications in areas such as submarine cable systems and data center interconnects offer further growth avenues. The adoption of open standards and software-defined networking (SDN) can lead to greater network flexibility and efficiency.
Growth Accelerators in the Optical Transport Network Market Industry
Long-term growth will be driven by continuous technological advancements, particularly in coherent optics and flexible grid technologies. Strategic partnerships between equipment vendors and network operators will facilitate faster adoption. Government initiatives and investments in broadband infrastructure, especially in developing economies, will further propel market expansion. The integration of OTN with other technologies, such as SDN and NFV, will unlock new capabilities and efficiencies.
Key Players Shaping the Optical Transport Network Market Market
Notable Milestones in Optical Transport Network Market Sector
- June 2022: Infinera and NEC Corporation collaborated on Neutral Networks' NEXT fiber optic network, utilizing Infinera's ICE6 technology, marking a significant project in Mexico and the US.
- September 2022: NEC Corporation launched its "SpectralWave WX Series" of open specifications-compliant optical transport products, furthering All-Optical Network expansion.
- December 2022: Huawei introduced several all-optical rail transportation network solutions, including a next-generation urban rail bearer network, enhancing efficiency and latency.
In-Depth Optical Transport Network Market Market Outlook
The future of the Optical Transport Network market looks promising, driven by the continued demand for high-bandwidth connectivity and the ongoing advancements in coherent optical technology. Strategic partnerships and mergers & acquisitions will play an important role in shaping the competitive landscape. The focus on software-defined networking and the integration of OTN with other network technologies will drive innovation and efficiency. Expansion into untapped markets and the development of new applications will further fuel market growth. The market is expected to maintain a healthy CAGR throughout the forecast period (2025-2033).
Optical Transport Network Market Segmentation
-
1. Technology
- 1.1. WDM
- 1.2. DWDM
- 1.3. Other Technologies
-
2. Offering
-
2.1. Service
- 2.1.1. Network Maintenance and Support
- 2.1.2. Network Design
-
2.2. Component
- 2.2.1. Optical Transport
- 2.2.2. Optical Switch
- 2.2.3. Optical Platform
-
2.1. Service
-
3. End-user Vertical
- 3.1. IT and Telecom
- 3.2. Healthcare
- 3.3. Government
- 3.4. Other End-user Verticals
Optical Transport Network Market Segmentation By Geography
- 1. North America
- 2. Europe
- 3. Asia
- 4. Australia and New Zealand
- 5. Latin America
- 6. Middle East and Africa
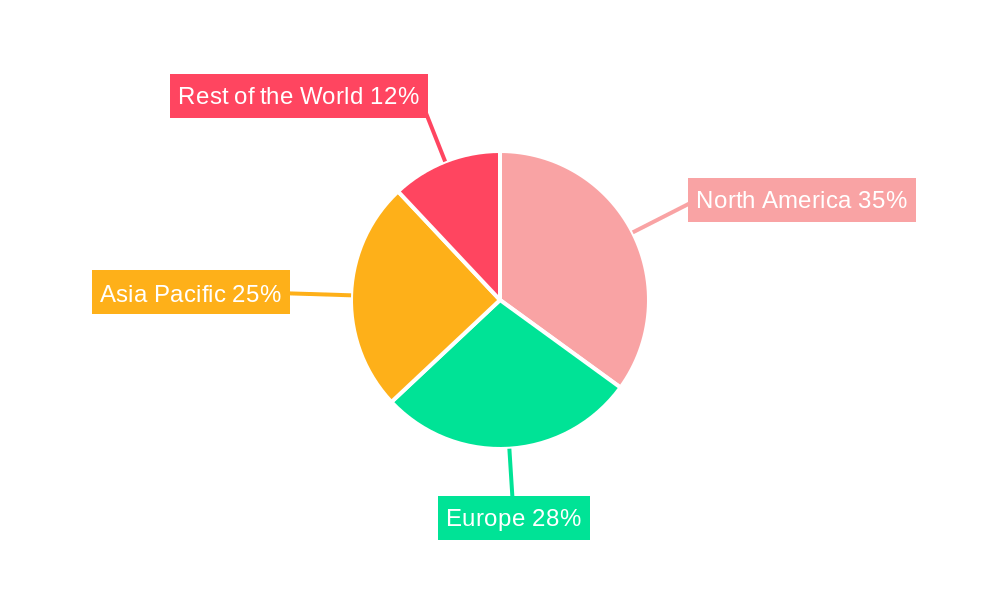
Optical Transport Network Market Regional Market Share
Geographic Coverage of Optical Transport Network Market
Optical Transport Network Market REPORT HIGHLIGHTS
| Aspects | Details |
|---|---|
| Study Period | 2020-2034 |
| Base Year | 2025 |
| Estimated Year | 2026 |
| Forecast Period | 2026-2034 |
| Historical Period | 2020-2025 |
| Growth Rate | CAGR of 8.41% from 2020-2034 |
| Segmentation |
|
Table of Contents
- 1. Introduction
- 1.1. Research Scope
- 1.2. Market Segmentation
- 1.3. Research Objective
- 1.4. Definitions and Assumptions
- 2. Executive Summary
- 2.1. Market Snapshot
- 3. Market Dynamics
- 3.1. Market Drivers
- 3.2. Market Restrains
- 3.3. Market Trends
- 3.4. Market Opportunities
- 4. Market Factor Analysis
- 4.1. Porters Five Forces
- 4.1.1. Bargaining Power of Suppliers
- 4.1.2. Bargaining Power of Buyers
- 4.1.3. Threat of New Entrants
- 4.1.4. Threat of Substitutes
- 4.1.5. Competitive Rivalry
- 4.2. PESTEL analysis
- 4.3. BCG Analysis
- 4.3.1. Stars (High Growth, High Market Share)
- 4.3.2. Cash Cows (Low Growth, High Market Share)
- 4.3.3. Question Mark (High Growth, Low Market Share)
- 4.3.4. Dogs (Low Growth, Low Market Share)
- 4.4. Ansoff Matrix Analysis
- 4.5. Supply Chain Analysis
- 4.6. Regulatory Landscape
- 4.7. Current Market Potential and Opportunity Assessment (TAM–SAM–SOM Framework)
- 4.8. IMR Analyst Note
- 4.1. Porters Five Forces
- 5. Market Analysis, Insights and Forecast 2021-2033
- 5.1. Market Analysis, Insights and Forecast - by Technology
- 5.1.1. WDM
- 5.1.2. DWDM
- 5.1.3. Other Technologies
- 5.2. Market Analysis, Insights and Forecast - by Offering
- 5.2.1. Service
- 5.2.1.1. Network Maintenance and Support
- 5.2.1.2. Network Design
- 5.2.2. Component
- 5.2.2.1. Optical Transport
- 5.2.2.2. Optical Switch
- 5.2.2.3. Optical Platform
- 5.2.1. Service
- 5.3. Market Analysis, Insights and Forecast - by End-user Vertical
- 5.3.1. IT and Telecom
- 5.3.2. Healthcare
- 5.3.3. Government
- 5.3.4. Other End-user Verticals
- 5.4. Market Analysis, Insights and Forecast - by Region
- 5.4.1. North America
- 5.4.2. Europe
- 5.4.3. Asia
- 5.4.4. Australia and New Zealand
- 5.4.5. Latin America
- 5.4.6. Middle East and Africa
- 5.1. Market Analysis, Insights and Forecast - by Technology
- 6. Global Optical Transport Network Market Analysis, Insights and Forecast, 2021-2033
- 6.1. Market Analysis, Insights and Forecast - by Technology
- 6.1.1. WDM
- 6.1.2. DWDM
- 6.1.3. Other Technologies
- 6.2. Market Analysis, Insights and Forecast - by Offering
- 6.2.1. Service
- 6.2.1.1. Network Maintenance and Support
- 6.2.1.2. Network Design
- 6.2.2. Component
- 6.2.2.1. Optical Transport
- 6.2.2.2. Optical Switch
- 6.2.2.3. Optical Platform
- 6.2.1. Service
- 6.3. Market Analysis, Insights and Forecast - by End-user Vertical
- 6.3.1. IT and Telecom
- 6.3.2. Healthcare
- 6.3.3. Government
- 6.3.4. Other End-user Verticals
- 6.1. Market Analysis, Insights and Forecast - by Technology
- 7. North America Optical Transport Network Market Analysis, Insights and Forecast, 2020-2032
- 7.1. Market Analysis, Insights and Forecast - by Technology
- 7.1.1. WDM
- 7.1.2. DWDM
- 7.1.3. Other Technologies
- 7.2. Market Analysis, Insights and Forecast - by Offering
- 7.2.1. Service
- 7.2.1.1. Network Maintenance and Support
- 7.2.1.2. Network Design
- 7.2.2. Component
- 7.2.2.1. Optical Transport
- 7.2.2.2. Optical Switch
- 7.2.2.3. Optical Platform
- 7.2.1. Service
- 7.3. Market Analysis, Insights and Forecast - by End-user Vertical
- 7.3.1. IT and Telecom
- 7.3.2. Healthcare
- 7.3.3. Government
- 7.3.4. Other End-user Verticals
- 7.1. Market Analysis, Insights and Forecast - by Technology
- 8. Europe Optical Transport Network Market Analysis, Insights and Forecast, 2020-2032
- 8.1. Market Analysis, Insights and Forecast - by Technology
- 8.1.1. WDM
- 8.1.2. DWDM
- 8.1.3. Other Technologies
- 8.2. Market Analysis, Insights and Forecast - by Offering
- 8.2.1. Service
- 8.2.1.1. Network Maintenance and Support
- 8.2.1.2. Network Design
- 8.2.2. Component
- 8.2.2.1. Optical Transport
- 8.2.2.2. Optical Switch
- 8.2.2.3. Optical Platform
- 8.2.1. Service
- 8.3. Market Analysis, Insights and Forecast - by End-user Vertical
- 8.3.1. IT and Telecom
- 8.3.2. Healthcare
- 8.3.3. Government
- 8.3.4. Other End-user Verticals
- 8.1. Market Analysis, Insights and Forecast - by Technology
- 9. Asia Optical Transport Network Market Analysis, Insights and Forecast, 2020-2032
- 9.1. Market Analysis, Insights and Forecast - by Technology
- 9.1.1. WDM
- 9.1.2. DWDM
- 9.1.3. Other Technologies
- 9.2. Market Analysis, Insights and Forecast - by Offering
- 9.2.1. Service
- 9.2.1.1. Network Maintenance and Support
- 9.2.1.2. Network Design
- 9.2.2. Component
- 9.2.2.1. Optical Transport
- 9.2.2.2. Optical Switch
- 9.2.2.3. Optical Platform
- 9.2.1. Service
- 9.3. Market Analysis, Insights and Forecast - by End-user Vertical
- 9.3.1. IT and Telecom
- 9.3.2. Healthcare
- 9.3.3. Government
- 9.3.4. Other End-user Verticals
- 9.1. Market Analysis, Insights and Forecast - by Technology
- 10. Australia and New Zealand Optical Transport Network Market Analysis, Insights and Forecast, 2020-2032
- 10.1. Market Analysis, Insights and Forecast - by Technology
- 10.1.1. WDM
- 10.1.2. DWDM
- 10.1.3. Other Technologies
- 10.2. Market Analysis, Insights and Forecast - by Offering
- 10.2.1. Service
- 10.2.1.1. Network Maintenance and Support
- 10.2.1.2. Network Design
- 10.2.2. Component
- 10.2.2.1. Optical Transport
- 10.2.2.2. Optical Switch
- 10.2.2.3. Optical Platform
- 10.2.1. Service
- 10.3. Market Analysis, Insights and Forecast - by End-user Vertical
- 10.3.1. IT and Telecom
- 10.3.2. Healthcare
- 10.3.3. Government
- 10.3.4. Other End-user Verticals
- 10.1. Market Analysis, Insights and Forecast - by Technology
- 11. Latin America Optical Transport Network Market Analysis, Insights and Forecast, 2020-2032
- 11.1. Market Analysis, Insights and Forecast - by Technology
- 11.1.1. WDM
- 11.1.2. DWDM
- 11.1.3. Other Technologies
- 11.2. Market Analysis, Insights and Forecast - by Offering
- 11.2.1. Service
- 11.2.1.1. Network Maintenance and Support
- 11.2.1.2. Network Design
- 11.2.2. Component
- 11.2.2.1. Optical Transport
- 11.2.2.2. Optical Switch
- 11.2.2.3. Optical Platform
- 11.2.1. Service
- 11.3. Market Analysis, Insights and Forecast - by End-user Vertical
- 11.3.1. IT and Telecom
- 11.3.2. Healthcare
- 11.3.3. Government
- 11.3.4. Other End-user Verticals
- 11.1. Market Analysis, Insights and Forecast - by Technology
- 12. Middle East and Africa Optical Transport Network Market Analysis, Insights and Forecast, 2020-2032
- 12.1. Market Analysis, Insights and Forecast - by Technology
- 12.1.1. WDM
- 12.1.2. DWDM
- 12.1.3. Other Technologies
- 12.2. Market Analysis, Insights and Forecast - by Offering
- 12.2.1. Service
- 12.2.1.1. Network Maintenance and Support
- 12.2.1.2. Network Design
- 12.2.2. Component
- 12.2.2.1. Optical Transport
- 12.2.2.2. Optical Switch
- 12.2.2.3. Optical Platform
- 12.2.1. Service
- 12.3. Market Analysis, Insights and Forecast - by End-user Vertical
- 12.3.1. IT and Telecom
- 12.3.2. Healthcare
- 12.3.3. Government
- 12.3.4. Other End-user Verticals
- 12.1. Market Analysis, Insights and Forecast - by Technology
- 13. Competitive Analysis
- 13.1. Company Profiles
- 13.1.1 Telefonaktiebolaget LM Ericsson
- 13.1.1.1. Company Overview
- 13.1.1.2. Products
- 13.1.1.3. Company Financials
- 13.1.1.4. SWOT Analysis
- 13.1.2 Fujitsu Ltd
- 13.1.2.1. Company Overview
- 13.1.2.2. Products
- 13.1.2.3. Company Financials
- 13.1.2.4. SWOT Analysis
- 13.1.3 Infinera Corporation
- 13.1.3.1. Company Overview
- 13.1.3.2. Products
- 13.1.3.3. Company Financials
- 13.1.3.4. SWOT Analysis
- 13.1.4 NEC Corporation
- 13.1.4.1. Company Overview
- 13.1.4.2. Products
- 13.1.4.3. Company Financials
- 13.1.4.4. SWOT Analysis
- 13.1.5 Huawei Technologies Co Ltd
- 13.1.5.1. Company Overview
- 13.1.5.2. Products
- 13.1.5.3. Company Financials
- 13.1.5.4. SWOT Analysis
- 13.1.6 ZTE Corporation
- 13.1.6.1. Company Overview
- 13.1.6.2. Products
- 13.1.6.3. Company Financials
- 13.1.6.4. SWOT Analysis
- 13.1.7 Cisco Systems Incorporation
- 13.1.7.1. Company Overview
- 13.1.7.2. Products
- 13.1.7.3. Company Financials
- 13.1.7.4. SWOT Analysis
- 13.1.8 Nokia Corporation
- 13.1.8.1. Company Overview
- 13.1.8.2. Products
- 13.1.8.3. Company Financials
- 13.1.8.4. SWOT Analysis
- 13.1.9 Yokogawa Electric Corporation*List Not Exhaustive
- 13.1.9.1. Company Overview
- 13.1.9.2. Products
- 13.1.9.3. Company Financials
- 13.1.9.4. SWOT Analysis
- 13.1.10 Ciena Corporation
- 13.1.10.1. Company Overview
- 13.1.10.2. Products
- 13.1.10.3. Company Financials
- 13.1.10.4. SWOT Analysis
- 13.1.1 Telefonaktiebolaget LM Ericsson
- 13.2. Market Entropy
- 13.2.1 Company's Key Areas Served
- 13.2.2 Recent Developments
- 13.3. Company Market Share Analysis 2025
- 13.3.1 Top 5 Companies Market Share Analysis
- 13.3.2 Top 3 Companies Market Share Analysis
- 13.4. List of Potential Customers
- 14. Research Methodology
List of Figures
- Figure 1: Global Optical Transport Network Market Revenue Breakdown (Million, %) by Region 2025 & 2033
- Figure 2: North America Optical Transport Network Market Revenue (Million), by Technology 2025 & 2033
- Figure 3: North America Optical Transport Network Market Revenue Share (%), by Technology 2025 & 2033
- Figure 4: North America Optical Transport Network Market Revenue (Million), by Offering 2025 & 2033
- Figure 5: North America Optical Transport Network Market Revenue Share (%), by Offering 2025 & 2033
- Figure 6: North America Optical Transport Network Market Revenue (Million), by End-user Vertical 2025 & 2033
- Figure 7: North America Optical Transport Network Market Revenue Share (%), by End-user Vertical 2025 & 2033
- Figure 8: North America Optical Transport Network Market Revenue (Million), by Country 2025 & 2033
- Figure 9: North America Optical Transport Network Market Revenue Share (%), by Country 2025 & 2033
- Figure 10: Europe Optical Transport Network Market Revenue (Million), by Technology 2025 & 2033
- Figure 11: Europe Optical Transport Network Market Revenue Share (%), by Technology 2025 & 2033
- Figure 12: Europe Optical Transport Network Market Revenue (Million), by Offering 2025 & 2033
- Figure 13: Europe Optical Transport Network Market Revenue Share (%), by Offering 2025 & 2033
- Figure 14: Europe Optical Transport Network Market Revenue (Million), by End-user Vertical 2025 & 2033
- Figure 15: Europe Optical Transport Network Market Revenue Share (%), by End-user Vertical 2025 & 2033
- Figure 16: Europe Optical Transport Network Market Revenue (Million), by Country 2025 & 2033
- Figure 17: Europe Optical Transport Network Market Revenue Share (%), by Country 2025 & 2033
- Figure 18: Asia Optical Transport Network Market Revenue (Million), by Technology 2025 & 2033
- Figure 19: Asia Optical Transport Network Market Revenue Share (%), by Technology 2025 & 2033
- Figure 20: Asia Optical Transport Network Market Revenue (Million), by Offering 2025 & 2033
- Figure 21: Asia Optical Transport Network Market Revenue Share (%), by Offering 2025 & 2033
- Figure 22: Asia Optical Transport Network Market Revenue (Million), by End-user Vertical 2025 & 2033
- Figure 23: Asia Optical Transport Network Market Revenue Share (%), by End-user Vertical 2025 & 2033
- Figure 24: Asia Optical Transport Network Market Revenue (Million), by Country 2025 & 2033
- Figure 25: Asia Optical Transport Network Market Revenue Share (%), by Country 2025 & 2033
- Figure 26: Australia and New Zealand Optical Transport Network Market Revenue (Million), by Technology 2025 & 2033
- Figure 27: Australia and New Zealand Optical Transport Network Market Revenue Share (%), by Technology 2025 & 2033
- Figure 28: Australia and New Zealand Optical Transport Network Market Revenue (Million), by Offering 2025 & 2033
- Figure 29: Australia and New Zealand Optical Transport Network Market Revenue Share (%), by Offering 2025 & 2033
- Figure 30: Australia and New Zealand Optical Transport Network Market Revenue (Million), by End-user Vertical 2025 & 2033
- Figure 31: Australia and New Zealand Optical Transport Network Market Revenue Share (%), by End-user Vertical 2025 & 2033
- Figure 32: Australia and New Zealand Optical Transport Network Market Revenue (Million), by Country 2025 & 2033
- Figure 33: Australia and New Zealand Optical Transport Network Market Revenue Share (%), by Country 2025 & 2033
- Figure 34: Latin America Optical Transport Network Market Revenue (Million), by Technology 2025 & 2033
- Figure 35: Latin America Optical Transport Network Market Revenue Share (%), by Technology 2025 & 2033
- Figure 36: Latin America Optical Transport Network Market Revenue (Million), by Offering 2025 & 2033
- Figure 37: Latin America Optical Transport Network Market Revenue Share (%), by Offering 2025 & 2033
- Figure 38: Latin America Optical Transport Network Market Revenue (Million), by End-user Vertical 2025 & 2033
- Figure 39: Latin America Optical Transport Network Market Revenue Share (%), by End-user Vertical 2025 & 2033
- Figure 40: Latin America Optical Transport Network Market Revenue (Million), by Country 2025 & 2033
- Figure 41: Latin America Optical Transport Network Market Revenue Share (%), by Country 2025 & 2033
- Figure 42: Middle East and Africa Optical Transport Network Market Revenue (Million), by Technology 2025 & 2033
- Figure 43: Middle East and Africa Optical Transport Network Market Revenue Share (%), by Technology 2025 & 2033
- Figure 44: Middle East and Africa Optical Transport Network Market Revenue (Million), by Offering 2025 & 2033
- Figure 45: Middle East and Africa Optical Transport Network Market Revenue Share (%), by Offering 2025 & 2033
- Figure 46: Middle East and Africa Optical Transport Network Market Revenue (Million), by End-user Vertical 2025 & 2033
- Figure 47: Middle East and Africa Optical Transport Network Market Revenue Share (%), by End-user Vertical 2025 & 2033
- Figure 48: Middle East and Africa Optical Transport Network Market Revenue (Million), by Country 2025 & 2033
- Figure 49: Middle East and Africa Optical Transport Network Market Revenue Share (%), by Country 2025 & 2033
List of Tables
- Table 1: Global Optical Transport Network Market Revenue Million Forecast, by Technology 2020 & 2033
- Table 2: Global Optical Transport Network Market Revenue Million Forecast, by Offering 2020 & 2033
- Table 3: Global Optical Transport Network Market Revenue Million Forecast, by End-user Vertical 2020 & 2033
- Table 4: Global Optical Transport Network Market Revenue Million Forecast, by Region 2020 & 2033
- Table 5: Global Optical Transport Network Market Revenue Million Forecast, by Technology 2020 & 2033
- Table 6: Global Optical Transport Network Market Revenue Million Forecast, by Offering 2020 & 2033
- Table 7: Global Optical Transport Network Market Revenue Million Forecast, by End-user Vertical 2020 & 2033
- Table 8: Global Optical Transport Network Market Revenue Million Forecast, by Country 2020 & 2033
- Table 9: Global Optical Transport Network Market Revenue Million Forecast, by Technology 2020 & 2033
- Table 10: Global Optical Transport Network Market Revenue Million Forecast, by Offering 2020 & 2033
- Table 11: Global Optical Transport Network Market Revenue Million Forecast, by End-user Vertical 2020 & 2033
- Table 12: Global Optical Transport Network Market Revenue Million Forecast, by Country 2020 & 2033
- Table 13: Global Optical Transport Network Market Revenue Million Forecast, by Technology 2020 & 2033
- Table 14: Global Optical Transport Network Market Revenue Million Forecast, by Offering 2020 & 2033
- Table 15: Global Optical Transport Network Market Revenue Million Forecast, by End-user Vertical 2020 & 2033
- Table 16: Global Optical Transport Network Market Revenue Million Forecast, by Country 2020 & 2033
- Table 17: Global Optical Transport Network Market Revenue Million Forecast, by Technology 2020 & 2033
- Table 18: Global Optical Transport Network Market Revenue Million Forecast, by Offering 2020 & 2033
- Table 19: Global Optical Transport Network Market Revenue Million Forecast, by End-user Vertical 2020 & 2033
- Table 20: Global Optical Transport Network Market Revenue Million Forecast, by Country 2020 & 2033
- Table 21: Global Optical Transport Network Market Revenue Million Forecast, by Technology 2020 & 2033
- Table 22: Global Optical Transport Network Market Revenue Million Forecast, by Offering 2020 & 2033
- Table 23: Global Optical Transport Network Market Revenue Million Forecast, by End-user Vertical 2020 & 2033
- Table 24: Global Optical Transport Network Market Revenue Million Forecast, by Country 2020 & 2033
- Table 25: Global Optical Transport Network Market Revenue Million Forecast, by Technology 2020 & 2033
- Table 26: Global Optical Transport Network Market Revenue Million Forecast, by Offering 2020 & 2033
- Table 27: Global Optical Transport Network Market Revenue Million Forecast, by End-user Vertical 2020 & 2033
- Table 28: Global Optical Transport Network Market Revenue Million Forecast, by Country 2020 & 2033
Frequently Asked Questions
1. What is the projected Compound Annual Growth Rate (CAGR) of the Optical Transport Network Market?
The projected CAGR is approximately 8.41%.
2. Which companies are prominent players in the Optical Transport Network Market?
Key companies in the market include Telefonaktiebolaget LM Ericsson, Fujitsu Ltd, Infinera Corporation, NEC Corporation, Huawei Technologies Co Ltd, ZTE Corporation, Cisco Systems Incorporation, Nokia Corporation, Yokogawa Electric Corporation*List Not Exhaustive, Ciena Corporation.
3. What are the main segments of the Optical Transport Network Market?
The market segments include Technology, Offering, End-user Vertical.
4. Can you provide details about the market size?
The market size is estimated to be USD 24.91 Million as of 2022.
5. What are some drivers contributing to market growth?
Increasing Internet Penetration with Demand for High-speed Internet; Technological Innovations by OTN Solution Providers.
6. What are the notable trends driving market growth?
IT and Telecom Sector to Drive the Market.
7. Are there any restraints impacting market growth?
Dearth of Skillful Workforce to Add New Solutions in Existing Network.
8. Can you provide examples of recent developments in the market?
December 2022: Huawei introduced several all-optical rail transportation network solutions, including the next-generation urban rail bearer network, urban rail cloud optical network, and railway all-optical backbone network solutions. In response to the network requirements and problems of the urban rail cloud era, Huawei has developed a next-generation urban rail bearer network solution called the urban rail cloud optical network. Cloud-based services use 10G single-wavelength transmission to the control center in a single hop, eliminating intermediate node transmission latency. End-to-end latency is less than 1 millisecond, ensuring a high-quality service experience.
9. What pricing options are available for accessing the report?
Pricing options include single-user, multi-user, and enterprise licenses priced at USD 4750, USD 5250, and USD 8750 respectively.
10. Is the market size provided in terms of value or volume?
The market size is provided in terms of value, measured in Million.
11. Are there any specific market keywords associated with the report?
Yes, the market keyword associated with the report is "Optical Transport Network Market," which aids in identifying and referencing the specific market segment covered.
12. How do I determine which pricing option suits my needs best?
The pricing options vary based on user requirements and access needs. Individual users may opt for single-user licenses, while businesses requiring broader access may choose multi-user or enterprise licenses for cost-effective access to the report.
13. Are there any additional resources or data provided in the Optical Transport Network Market report?
While the report offers comprehensive insights, it's advisable to review the specific contents or supplementary materials provided to ascertain if additional resources or data are available.
14. How can I stay updated on further developments or reports in the Optical Transport Network Market?
To stay informed about further developments, trends, and reports in the Optical Transport Network Market, consider subscribing to industry newsletters, following relevant companies and organizations, or regularly checking reputable industry news sources and publications.
Methodology
Step 1 - Identification of Relevant Samples Size from Population Database


Step 2 - Approaches for Defining Global Market Size (Value, Volume* & Price*)

Note*: In applicable scenarios
Step 3 - Data Sources
Primary Research
- Web Analytics
- Survey Reports
- Research Institute
- Latest Research Reports
- Opinion Leaders
Secondary Research
- Annual Reports
- White Paper
- Latest Press Release
- Industry Association
- Paid Database
- Investor Presentations

Step 4 - Data Triangulation
Involves using different sources of information in order to increase the validity of a study
These sources are likely to be stakeholders in a program - participants, other researchers, program staff, other community members, and so on.
Then we put all data in single framework & apply various statistical tools to find out the dynamic on the market.
During the analysis stage, feedback from the stakeholder groups would be compared to determine areas of agreement as well as areas of divergence