

Key Insights
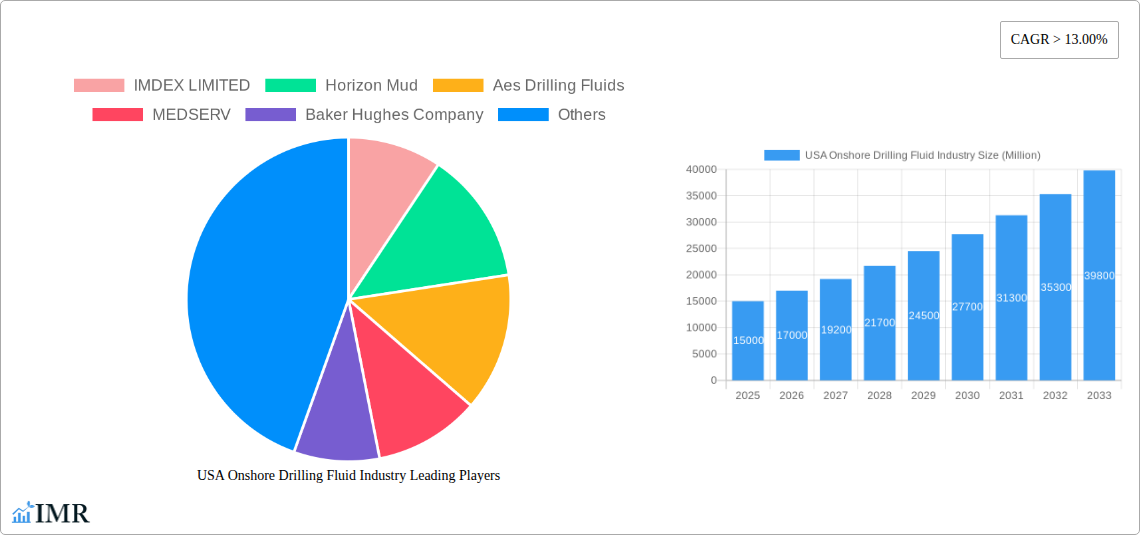
The USA onshore drilling fluid market is experiencing robust growth, driven by increasing oil and gas exploration and production activities. The market's Compound Annual Growth Rate (CAGR) exceeding 13% from 2019 to 2024 indicates a significant upward trajectory. This expansion is fueled by several key factors. Firstly, the resurgence in domestic shale oil and gas production, particularly in regions like the Permian Basin and Eagle Ford Shale, necessitates a substantial increase in drilling fluid demand. Secondly, technological advancements in drilling fluids, leading to improved efficiency, reduced environmental impact, and enhanced well performance, contribute to market growth. The shift towards environmentally friendly, water-based drilling fluids is also a major driver, responding to increasing regulatory scrutiny and public awareness of environmental sustainability. However, the market faces certain restraints, including fluctuations in oil and gas prices, which directly impact exploration and production budgets. Moreover, the availability of skilled labor and potential supply chain disruptions can pose challenges to consistent market expansion. The market is segmented by fluid type (water-based, oil-based, synthetic-based), application (conventional drilling, unconventional drilling), and region (e.g., Permian Basin, Eagle Ford Shale, Bakken Shale). Major players in the market include established multinational corporations like Schlumberger, Baker Hughes, and Halliburton, alongside smaller regional service providers. Competition is intense, with companies focusing on innovation, cost-efficiency, and service quality to gain market share.
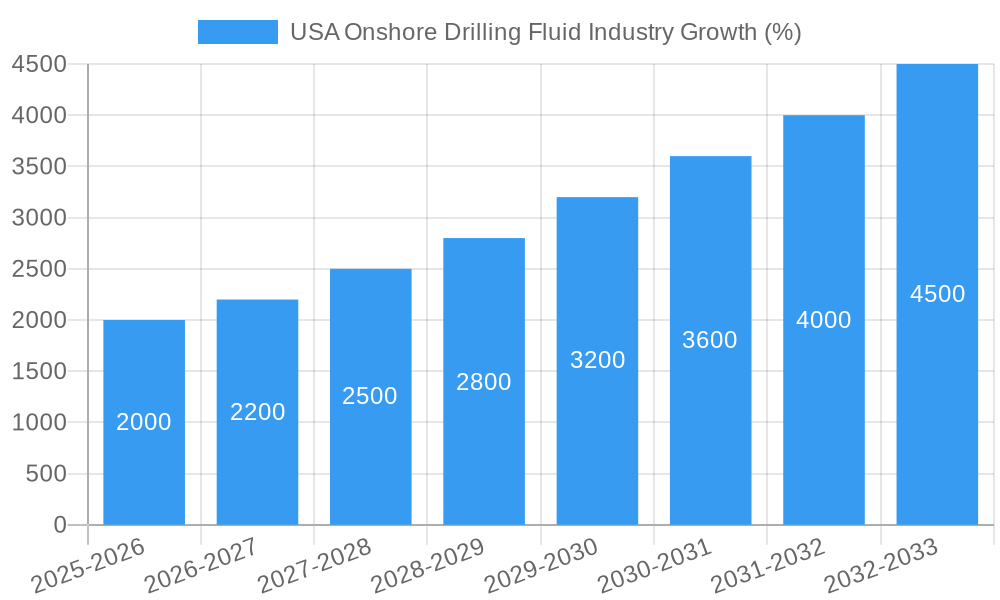
The forecast period (2025-2033) anticipates continued market growth, albeit potentially at a slightly moderated pace compared to the historical period. Sustained investment in domestic energy production, technological innovation resulting in more efficient and environmentally friendly drilling fluids, and ongoing exploration activities across various shale plays will continue to propel the market forward. However, economic volatility and potential regulatory changes could influence the growth trajectory. To mitigate risks, companies are likely to focus on diversifying their product portfolios, strategic partnerships, and technological advancements to ensure a sustained presence within this dynamic market. The competitive landscape will remain highly contested, emphasizing the importance of operational excellence, customer relationships, and innovative service offerings. Precise market sizing for 2025 requires deeper industry-specific data, but based on the CAGR and general industry trends, a reasonable estimate can be derived and should be accompanied by an appropriate disclaimer acknowledging the estimation approach.
This comprehensive report provides an in-depth analysis of the USA onshore drilling fluid industry, encompassing market dynamics, growth trends, competitive landscape, and future outlook. The report covers the period from 2019 to 2033, with a focus on the forecast period 2025-2033 and a base year of 2025. The study segments the market and provides granular insights into leading companies, including IMDEX LIMITED, Horizon Mud, Aes Drilling Fluids, MEDSERV, Baker Hughes Company, Schlumberger Limited, Newpark Resources Inc, Weatherford, National Oilwell Varco, Francis Drilling Fluids Ltd, Oleon Americas Inc (Avril Group), Q'max Solutions Inc, Unique Drilling Fluids Inc, Sunwest Fluids LLC, McAda Drilling Fluids, Geo Drilling Fluids Inc, and CES Energy Solutions Corp. This report is crucial for industry professionals, investors, and strategic decision-makers seeking a clear understanding of this dynamic market.
USA Onshore Drilling Fluid Industry Market Dynamics & Structure
This section analyzes the structure and dynamics of the USA onshore drilling fluid market, considering market concentration, technological innovation, regulatory influences, competitive substitutes, and merger & acquisition (M&A) activity. The analysis covers the period from 2019-2024, highlighting key trends and providing insights into future market developments.
- Market Concentration: The market is moderately concentrated, with the top 5 players holding approximately xx% of the market share in 2024. Smaller, regional players account for the remaining share.
- Technological Innovation: Technological advancements, particularly in environmentally friendly drilling fluids and enhanced performance additives, are significant drivers of market growth. However, high R&D costs and stringent regulatory approvals pose barriers to innovation.
- Regulatory Framework: Stringent environmental regulations regarding waste disposal and fluid composition are shaping industry practices. Compliance costs are a considerable factor influencing market dynamics.
- Competitive Product Substitutes: The emergence of alternative drilling technologies and fluids is posing competitive pressure to traditional products. This includes water-based muds and synthetic-based muds.
- End-User Demographics: The market is primarily driven by the oil and gas exploration and production activities in various shale formations across the US. Shifts in energy demand directly impact the market.
- M&A Trends: The industry has witnessed a moderate number of M&A activities in recent years (xx deals in 2019-2024). These deals were primarily focused on expanding geographic reach and technological capabilities.
USA Onshore Drilling Fluid Industry Growth Trends & Insights
This section explores the growth trajectory of the USA onshore drilling fluid market from 2019 to 2033. The analysis leverages secondary data sources, including industry reports, company publications and government data.
The market size witnessed a fluctuation during the historical period (2019-2024), primarily due to oil price volatility and the pandemic. However, a steady recovery is observed with an estimated market size of $xx million in 2025. A positive outlook is anticipated for the forecast period (2025-2033), with a projected CAGR of xx%. This growth is driven by increased drilling activities in key shale plays, technological advancements, and continuous improvements in drilling fluid efficiency and environmental performance. The adoption rate of enhanced drilling fluids and sustainable solutions is expected to increase significantly during the forecast period. Consumer behavior, influenced by sustainability concerns, is increasingly favoring environmentally friendly drilling fluid solutions.
Dominant Regions, Countries, or Segments in USA Onshore Drilling Fluid Industry
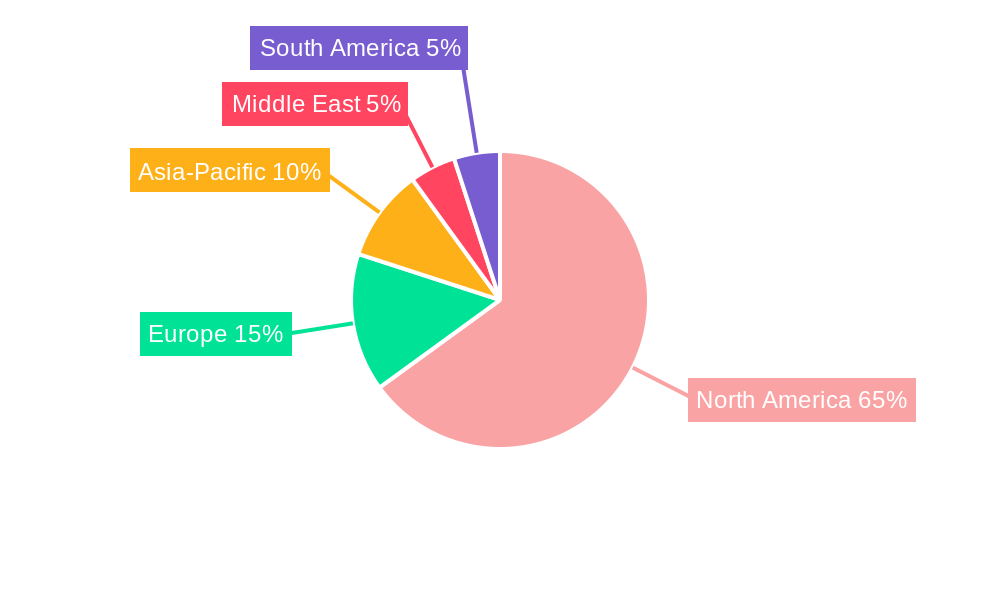
The Permian Basin and Eagle Ford Shale regions are dominant in the US onshore drilling fluid market due to their high levels of oil and gas production activity. These regions benefit from established infrastructure, skilled workforce, and favorable regulatory environments. Other significant shale regions, such as the Bakken and Marcellus, also contribute substantially.
- Key Drivers:
- Favorable Government Policies promoting domestic energy production.
- Extensive Infrastructure for drilling and transportation of materials.
- Abundant Oil and Gas Reserves.
- High levels of private and public investment in exploration and production.
These regions hold a combined market share of approximately xx% in 2025, expected to grow to xx% by 2033. The growth potential in these regions is influenced by factors such as continued exploration and production activities and the adoption of advanced drilling technologies. Other regions are anticipated to exhibit moderate growth driven by renewed exploration activities in under-explored areas and exploration of unconventional resources.
USA Onshore Drilling Fluid Industry Product Landscape
The USA onshore drilling fluid market offers a wide range of products, including water-based muds (WBM), oil-based muds (OBM), synthetic-based muds (SBM), and specialized drilling fluids tailored to specific geological formations and drilling conditions. Recent product innovations focus on improving drilling efficiency, reducing environmental impact, and enhancing wellbore stability. These innovations include enhanced rheological properties, optimized filtration control, and environmentally friendly additives. Key selling propositions include reduced environmental footprint, improved drilling performance, and cost savings due to increased efficiency. Technological advancements in nanotechnology and biopolymers are driving the development of next-generation drilling fluids.
Key Drivers, Barriers & Challenges in USA Onshore Drilling Fluid Industry
Key Drivers:
The growth of the USA onshore drilling fluid market is driven by several factors, including:
- Increasing demand for oil and gas.
- Technological advancements in drilling fluids.
- Government incentives for domestic energy production.
- Exploration and production in shale basins.
Key Challenges and Restraints:
Several challenges and restraints impact the market’s growth:
- Environmental regulations and stricter waste disposal guidelines.
- Fluctuations in oil and gas prices, significantly affecting investment decisions.
- Competition from alternative drilling technologies and substitutes.
- Supply chain disruptions and price volatility of raw materials.
- Skilled labor shortages in some regions.
Emerging Opportunities in USA Onshore Drilling Fluid Industry
Emerging opportunities include:
- Development and adoption of environmentally friendly drilling fluids with reduced environmental impact.
- Growing demand for specialized fluids for unconventional drilling operations.
- Leveraging digitalization and data analytics for optimizing drilling fluid performance.
- Expansion into emerging shale plays and under-explored regions.
Growth Accelerators in the USA Onshore Drilling Fluid Industry Industry
Long-term growth will be driven by:
Strategic partnerships and collaborations between drilling fluid providers and oil and gas companies fostering innovation and technological advancements. Investments in research and development of next-generation drilling fluids that address environmental concerns and improve drilling efficiency. Expansion into international markets offering significant potential for growth and diversification.
Key Players Shaping the USA Onshore Drilling Fluid Industry Market
- IMDEX LIMITED
- Horizon Mud
- Aes Drilling Fluids
- MEDSERV
- Baker Hughes Company
- Schlumberger Limited
- Newpark Resources Inc
- Weatherford
- National Oilwell Varco
- Francis Drilling Fluids Ltd
- Oleon Americas Inc (Avril Group)
- Q'max Solutions Inc
- Unique Drilling Fluids Inc
- Sunwest Fluids LLC
- McAda Drilling Fluids
- Geo Drilling Fluids Inc
- CES Energy Solutions Corp
- List Not Exhaustive
Notable Milestones in USA Onshore Drilling Fluid Industry Sector
- 2020, Q4: Introduction of a new environmentally friendly drilling fluid by Newpark Resources Inc.
- 2021, Q2: Merger between two smaller drilling fluid companies in the Permian Basin.
- 2022, Q3: Launch of a new high-performance drilling fluid by Baker Hughes Company.
- 2023, Q1: Significant investment in R&D by Schlumberger Limited for developing sustainable drilling solutions.
In-Depth USA Onshore Drilling Fluid Industry Market Outlook
The future of the USA onshore drilling fluid industry looks promising, driven by sustained growth in oil and gas exploration and production, and further advancements in drilling fluid technology. Strategic partnerships, investments in R&D, and a focus on sustainability are set to shape market dynamics. The industry presents significant opportunities for companies to capitalize on, particularly those focused on innovative and environmentally conscious solutions. Market expansion into new shale plays and further integration of digital technologies will play a vital role in the market's continued evolution and growth.
USA Onshore Drilling Fluid Industry Segmentation
-
1. Additive Type
- 1.1. Protective Chemicals
- 1.2. Fluid Viscosifiers
- 1.3. Weighting Agents
- 1.4. Wetting Agents
- 1.5. Lost Circulation Materials
- 1.6. Thinners
- 1.7. Rheology Modifiers
- 1.8. Surfactants
- 1.9. Alkalinity and pH Control Materials
- 1.10. Shale Stabilizers
- 1.11. Other Additive Types
-
2. Product Type
- 2.1. Oil-based Drilling Fluid
- 2.2. Synthetic-based Drilling Fluid
- 2.3. Water-based Drilling Fluid
-
3. Basin
- 3.1. Permian
- 3.2. Eagle Ford
- 3.3. Niobrara
- 3.4. Bakken
- 3.5. Appalachia
- 3.6. Other Basins
USA Onshore Drilling Fluid Industry Segmentation By Geography
-
1. North America
- 1.1. United States
- 1.2. Canada
- 1.3. Mexico
-
2. South America
- 2.1. Brazil
- 2.2. Argentina
- 2.3. Rest of South America
-
3. Europe
- 3.1. United Kingdom
- 3.2. Germany
- 3.3. France
- 3.4. Italy
- 3.5. Spain
- 3.6. Russia
- 3.7. Benelux
- 3.8. Nordics
- 3.9. Rest of Europe
-
4. Middle East & Africa
- 4.1. Turkey
- 4.2. Israel
- 4.3. GCC
- 4.4. North Africa
- 4.5. South Africa
- 4.6. Rest of Middle East & Africa
-
5. Asia Pacific
- 5.1. China
- 5.2. India
- 5.3. Japan
- 5.4. South Korea
- 5.5. ASEAN
- 5.6. Oceania
- 5.7. Rest of Asia Pacific
USA Onshore Drilling Fluid Industry REPORT HIGHLIGHTS
| Aspects | Details |
|---|---|
| Study Period | 2019-2033 |
| Base Year | 2024 |
| Estimated Year | 2025 |
| Forecast Period | 2025-2033 |
| Historical Period | 2019-2024 |
| Growth Rate | CAGR of > 13.00% from 2019-2033 |
| Segmentation |
|
Table of Contents
- 1. Introduction
- 1.1. Research Scope
- 1.2. Market Segmentation
- 1.3. Research Methodology
- 1.4. Definitions and Assumptions
- 2. Executive Summary
- 2.1. Introduction
- 3. Market Dynamics
- 3.1. Introduction
- 3.2. Market Drivers
- 3.2.1. ; Low Breakeven Price and High Crude Oil Price; Increasing Demand for Longer Lateral Length; Continuous Growth in Demand from Permian Basin
- 3.3. Market Restrains
- 3.3.1. ; Low Breakeven Price and High Crude Oil Price; Increasing Demand for Longer Lateral Length; Continuous Growth in Demand from Permian Basin
- 3.4. Market Trends
- 3.4.1. Continuous Growth in Demand from Permian Basin
- 4. Market Factor Analysis
- 4.1. Porters Five Forces
- 4.2. Supply/Value Chain
- 4.3. PESTEL analysis
- 4.4. Market Entropy
- 4.5. Patent/Trademark Analysis
- 5. Global USA Onshore Drilling Fluid Industry Analysis, Insights and Forecast, 2019-2031
- 5.1. Market Analysis, Insights and Forecast - by Additive Type
- 5.1.1. Protective Chemicals
- 5.1.2. Fluid Viscosifiers
- 5.1.3. Weighting Agents
- 5.1.4. Wetting Agents
- 5.1.5. Lost Circulation Materials
- 5.1.6. Thinners
- 5.1.7. Rheology Modifiers
- 5.1.8. Surfactants
- 5.1.9. Alkalinity and pH Control Materials
- 5.1.10. Shale Stabilizers
- 5.1.11. Other Additive Types
- 5.2. Market Analysis, Insights and Forecast - by Product Type
- 5.2.1. Oil-based Drilling Fluid
- 5.2.2. Synthetic-based Drilling Fluid
- 5.2.3. Water-based Drilling Fluid
- 5.3. Market Analysis, Insights and Forecast - by Basin
- 5.3.1. Permian
- 5.3.2. Eagle Ford
- 5.3.3. Niobrara
- 5.3.4. Bakken
- 5.3.5. Appalachia
- 5.3.6. Other Basins
- 5.4. Market Analysis, Insights and Forecast - by Region
- 5.4.1. North America
- 5.4.2. South America
- 5.4.3. Europe
- 5.4.4. Middle East & Africa
- 5.4.5. Asia Pacific
- 5.1. Market Analysis, Insights and Forecast - by Additive Type
- 6. North America USA Onshore Drilling Fluid Industry Analysis, Insights and Forecast, 2019-2031
- 6.1. Market Analysis, Insights and Forecast - by Additive Type
- 6.1.1. Protective Chemicals
- 6.1.2. Fluid Viscosifiers
- 6.1.3. Weighting Agents
- 6.1.4. Wetting Agents
- 6.1.5. Lost Circulation Materials
- 6.1.6. Thinners
- 6.1.7. Rheology Modifiers
- 6.1.8. Surfactants
- 6.1.9. Alkalinity and pH Control Materials
- 6.1.10. Shale Stabilizers
- 6.1.11. Other Additive Types
- 6.2. Market Analysis, Insights and Forecast - by Product Type
- 6.2.1. Oil-based Drilling Fluid
- 6.2.2. Synthetic-based Drilling Fluid
- 6.2.3. Water-based Drilling Fluid
- 6.3. Market Analysis, Insights and Forecast - by Basin
- 6.3.1. Permian
- 6.3.2. Eagle Ford
- 6.3.3. Niobrara
- 6.3.4. Bakken
- 6.3.5. Appalachia
- 6.3.6. Other Basins
- 6.1. Market Analysis, Insights and Forecast - by Additive Type
- 7. South America USA Onshore Drilling Fluid Industry Analysis, Insights and Forecast, 2019-2031
- 7.1. Market Analysis, Insights and Forecast - by Additive Type
- 7.1.1. Protective Chemicals
- 7.1.2. Fluid Viscosifiers
- 7.1.3. Weighting Agents
- 7.1.4. Wetting Agents
- 7.1.5. Lost Circulation Materials
- 7.1.6. Thinners
- 7.1.7. Rheology Modifiers
- 7.1.8. Surfactants
- 7.1.9. Alkalinity and pH Control Materials
- 7.1.10. Shale Stabilizers
- 7.1.11. Other Additive Types
- 7.2. Market Analysis, Insights and Forecast - by Product Type
- 7.2.1. Oil-based Drilling Fluid
- 7.2.2. Synthetic-based Drilling Fluid
- 7.2.3. Water-based Drilling Fluid
- 7.3. Market Analysis, Insights and Forecast - by Basin
- 7.3.1. Permian
- 7.3.2. Eagle Ford
- 7.3.3. Niobrara
- 7.3.4. Bakken
- 7.3.5. Appalachia
- 7.3.6. Other Basins
- 7.1. Market Analysis, Insights and Forecast - by Additive Type
- 8. Europe USA Onshore Drilling Fluid Industry Analysis, Insights and Forecast, 2019-2031
- 8.1. Market Analysis, Insights and Forecast - by Additive Type
- 8.1.1. Protective Chemicals
- 8.1.2. Fluid Viscosifiers
- 8.1.3. Weighting Agents
- 8.1.4. Wetting Agents
- 8.1.5. Lost Circulation Materials
- 8.1.6. Thinners
- 8.1.7. Rheology Modifiers
- 8.1.8. Surfactants
- 8.1.9. Alkalinity and pH Control Materials
- 8.1.10. Shale Stabilizers
- 8.1.11. Other Additive Types
- 8.2. Market Analysis, Insights and Forecast - by Product Type
- 8.2.1. Oil-based Drilling Fluid
- 8.2.2. Synthetic-based Drilling Fluid
- 8.2.3. Water-based Drilling Fluid
- 8.3. Market Analysis, Insights and Forecast - by Basin
- 8.3.1. Permian
- 8.3.2. Eagle Ford
- 8.3.3. Niobrara
- 8.3.4. Bakken
- 8.3.5. Appalachia
- 8.3.6. Other Basins
- 8.1. Market Analysis, Insights and Forecast - by Additive Type
- 9. Middle East & Africa USA Onshore Drilling Fluid Industry Analysis, Insights and Forecast, 2019-2031
- 9.1. Market Analysis, Insights and Forecast - by Additive Type
- 9.1.1. Protective Chemicals
- 9.1.2. Fluid Viscosifiers
- 9.1.3. Weighting Agents
- 9.1.4. Wetting Agents
- 9.1.5. Lost Circulation Materials
- 9.1.6. Thinners
- 9.1.7. Rheology Modifiers
- 9.1.8. Surfactants
- 9.1.9. Alkalinity and pH Control Materials
- 9.1.10. Shale Stabilizers
- 9.1.11. Other Additive Types
- 9.2. Market Analysis, Insights and Forecast - by Product Type
- 9.2.1. Oil-based Drilling Fluid
- 9.2.2. Synthetic-based Drilling Fluid
- 9.2.3. Water-based Drilling Fluid
- 9.3. Market Analysis, Insights and Forecast - by Basin
- 9.3.1. Permian
- 9.3.2. Eagle Ford
- 9.3.3. Niobrara
- 9.3.4. Bakken
- 9.3.5. Appalachia
- 9.3.6. Other Basins
- 9.1. Market Analysis, Insights and Forecast - by Additive Type
- 10. Asia Pacific USA Onshore Drilling Fluid Industry Analysis, Insights and Forecast, 2019-2031
- 10.1. Market Analysis, Insights and Forecast - by Additive Type
- 10.1.1. Protective Chemicals
- 10.1.2. Fluid Viscosifiers
- 10.1.3. Weighting Agents
- 10.1.4. Wetting Agents
- 10.1.5. Lost Circulation Materials
- 10.1.6. Thinners
- 10.1.7. Rheology Modifiers
- 10.1.8. Surfactants
- 10.1.9. Alkalinity and pH Control Materials
- 10.1.10. Shale Stabilizers
- 10.1.11. Other Additive Types
- 10.2. Market Analysis, Insights and Forecast - by Product Type
- 10.2.1. Oil-based Drilling Fluid
- 10.2.2. Synthetic-based Drilling Fluid
- 10.2.3. Water-based Drilling Fluid
- 10.3. Market Analysis, Insights and Forecast - by Basin
- 10.3.1. Permian
- 10.3.2. Eagle Ford
- 10.3.3. Niobrara
- 10.3.4. Bakken
- 10.3.5. Appalachia
- 10.3.6. Other Basins
- 10.1. Market Analysis, Insights and Forecast - by Additive Type
- 11. Competitive Analysis
- 11.1. Global Market Share Analysis 2024
- 11.2. Company Profiles
- 11.2.1 IMDEX LIMITED
- 11.2.1.1. Overview
- 11.2.1.2. Products
- 11.2.1.3. SWOT Analysis
- 11.2.1.4. Recent Developments
- 11.2.1.5. Financials (Based on Availability)
- 11.2.2 Horizon Mud
- 11.2.2.1. Overview
- 11.2.2.2. Products
- 11.2.2.3. SWOT Analysis
- 11.2.2.4. Recent Developments
- 11.2.2.5. Financials (Based on Availability)
- 11.2.3 Aes Drilling Fluids
- 11.2.3.1. Overview
- 11.2.3.2. Products
- 11.2.3.3. SWOT Analysis
- 11.2.3.4. Recent Developments
- 11.2.3.5. Financials (Based on Availability)
- 11.2.4 MEDSERV
- 11.2.4.1. Overview
- 11.2.4.2. Products
- 11.2.4.3. SWOT Analysis
- 11.2.4.4. Recent Developments
- 11.2.4.5. Financials (Based on Availability)
- 11.2.5 Baker Hughes Company
- 11.2.5.1. Overview
- 11.2.5.2. Products
- 11.2.5.3. SWOT Analysis
- 11.2.5.4. Recent Developments
- 11.2.5.5. Financials (Based on Availability)
- 11.2.6 Schlumberger Limited
- 11.2.6.1. Overview
- 11.2.6.2. Products
- 11.2.6.3. SWOT Analysis
- 11.2.6.4. Recent Developments
- 11.2.6.5. Financials (Based on Availability)
- 11.2.7 Newpark Resources Inc
- 11.2.7.1. Overview
- 11.2.7.2. Products
- 11.2.7.3. SWOT Analysis
- 11.2.7.4. Recent Developments
- 11.2.7.5. Financials (Based on Availability)
- 11.2.8 Weatherford
- 11.2.8.1. Overview
- 11.2.8.2. Products
- 11.2.8.3. SWOT Analysis
- 11.2.8.4. Recent Developments
- 11.2.8.5. Financials (Based on Availability)
- 11.2.9 National Oilwell Varco
- 11.2.9.1. Overview
- 11.2.9.2. Products
- 11.2.9.3. SWOT Analysis
- 11.2.9.4. Recent Developments
- 11.2.9.5. Financials (Based on Availability)
- 11.2.10 Francis Drilling Fluids Ltd
- 11.2.10.1. Overview
- 11.2.10.2. Products
- 11.2.10.3. SWOT Analysis
- 11.2.10.4. Recent Developments
- 11.2.10.5. Financials (Based on Availability)
- 11.2.11 Oleon Americas Inc (Avril Group)
- 11.2.11.1. Overview
- 11.2.11.2. Products
- 11.2.11.3. SWOT Analysis
- 11.2.11.4. Recent Developments
- 11.2.11.5. Financials (Based on Availability)
- 11.2.12 Q'max Solutions Inc
- 11.2.12.1. Overview
- 11.2.12.2. Products
- 11.2.12.3. SWOT Analysis
- 11.2.12.4. Recent Developments
- 11.2.12.5. Financials (Based on Availability)
- 11.2.13 Unique Drilling Fluids Inc
- 11.2.13.1. Overview
- 11.2.13.2. Products
- 11.2.13.3. SWOT Analysis
- 11.2.13.4. Recent Developments
- 11.2.13.5. Financials (Based on Availability)
- 11.2.14 Sunwest Fluids LLC
- 11.2.14.1. Overview
- 11.2.14.2. Products
- 11.2.14.3. SWOT Analysis
- 11.2.14.4. Recent Developments
- 11.2.14.5. Financials (Based on Availability)
- 11.2.15 McAda Drilling Fluids
- 11.2.15.1. Overview
- 11.2.15.2. Products
- 11.2.15.3. SWOT Analysis
- 11.2.15.4. Recent Developments
- 11.2.15.5. Financials (Based on Availability)
- 11.2.16 Geo Drilling Fluids Inc
- 11.2.16.1. Overview
- 11.2.16.2. Products
- 11.2.16.3. SWOT Analysis
- 11.2.16.4. Recent Developments
- 11.2.16.5. Financials (Based on Availability)
- 11.2.17 CES Energy Solutions Corp *List Not Exhaustive
- 11.2.17.1. Overview
- 11.2.17.2. Products
- 11.2.17.3. SWOT Analysis
- 11.2.17.4. Recent Developments
- 11.2.17.5. Financials (Based on Availability)
- 11.2.1 IMDEX LIMITED
List of Figures
- Figure 1: Global USA Onshore Drilling Fluid Industry Revenue Breakdown (Million, %) by Region 2024 & 2032
- Figure 2: North America USA Onshore Drilling Fluid Industry Revenue (Million), by Additive Type 2024 & 2032
- Figure 3: North America USA Onshore Drilling Fluid Industry Revenue Share (%), by Additive Type 2024 & 2032
- Figure 4: North America USA Onshore Drilling Fluid Industry Revenue (Million), by Product Type 2024 & 2032
- Figure 5: North America USA Onshore Drilling Fluid Industry Revenue Share (%), by Product Type 2024 & 2032
- Figure 6: North America USA Onshore Drilling Fluid Industry Revenue (Million), by Basin 2024 & 2032
- Figure 7: North America USA Onshore Drilling Fluid Industry Revenue Share (%), by Basin 2024 & 2032
- Figure 8: North America USA Onshore Drilling Fluid Industry Revenue (Million), by Country 2024 & 2032
- Figure 9: North America USA Onshore Drilling Fluid Industry Revenue Share (%), by Country 2024 & 2032
- Figure 10: South America USA Onshore Drilling Fluid Industry Revenue (Million), by Additive Type 2024 & 2032
- Figure 11: South America USA Onshore Drilling Fluid Industry Revenue Share (%), by Additive Type 2024 & 2032
- Figure 12: South America USA Onshore Drilling Fluid Industry Revenue (Million), by Product Type 2024 & 2032
- Figure 13: South America USA Onshore Drilling Fluid Industry Revenue Share (%), by Product Type 2024 & 2032
- Figure 14: South America USA Onshore Drilling Fluid Industry Revenue (Million), by Basin 2024 & 2032
- Figure 15: South America USA Onshore Drilling Fluid Industry Revenue Share (%), by Basin 2024 & 2032
- Figure 16: South America USA Onshore Drilling Fluid Industry Revenue (Million), by Country 2024 & 2032
- Figure 17: South America USA Onshore Drilling Fluid Industry Revenue Share (%), by Country 2024 & 2032
- Figure 18: Europe USA Onshore Drilling Fluid Industry Revenue (Million), by Additive Type 2024 & 2032
- Figure 19: Europe USA Onshore Drilling Fluid Industry Revenue Share (%), by Additive Type 2024 & 2032
- Figure 20: Europe USA Onshore Drilling Fluid Industry Revenue (Million), by Product Type 2024 & 2032
- Figure 21: Europe USA Onshore Drilling Fluid Industry Revenue Share (%), by Product Type 2024 & 2032
- Figure 22: Europe USA Onshore Drilling Fluid Industry Revenue (Million), by Basin 2024 & 2032
- Figure 23: Europe USA Onshore Drilling Fluid Industry Revenue Share (%), by Basin 2024 & 2032
- Figure 24: Europe USA Onshore Drilling Fluid Industry Revenue (Million), by Country 2024 & 2032
- Figure 25: Europe USA Onshore Drilling Fluid Industry Revenue Share (%), by Country 2024 & 2032
- Figure 26: Middle East & Africa USA Onshore Drilling Fluid Industry Revenue (Million), by Additive Type 2024 & 2032
- Figure 27: Middle East & Africa USA Onshore Drilling Fluid Industry Revenue Share (%), by Additive Type 2024 & 2032
- Figure 28: Middle East & Africa USA Onshore Drilling Fluid Industry Revenue (Million), by Product Type 2024 & 2032
- Figure 29: Middle East & Africa USA Onshore Drilling Fluid Industry Revenue Share (%), by Product Type 2024 & 2032
- Figure 30: Middle East & Africa USA Onshore Drilling Fluid Industry Revenue (Million), by Basin 2024 & 2032
- Figure 31: Middle East & Africa USA Onshore Drilling Fluid Industry Revenue Share (%), by Basin 2024 & 2032
- Figure 32: Middle East & Africa USA Onshore Drilling Fluid Industry Revenue (Million), by Country 2024 & 2032
- Figure 33: Middle East & Africa USA Onshore Drilling Fluid Industry Revenue Share (%), by Country 2024 & 2032
- Figure 34: Asia Pacific USA Onshore Drilling Fluid Industry Revenue (Million), by Additive Type 2024 & 2032
- Figure 35: Asia Pacific USA Onshore Drilling Fluid Industry Revenue Share (%), by Additive Type 2024 & 2032
- Figure 36: Asia Pacific USA Onshore Drilling Fluid Industry Revenue (Million), by Product Type 2024 & 2032
- Figure 37: Asia Pacific USA Onshore Drilling Fluid Industry Revenue Share (%), by Product Type 2024 & 2032
- Figure 38: Asia Pacific USA Onshore Drilling Fluid Industry Revenue (Million), by Basin 2024 & 2032
- Figure 39: Asia Pacific USA Onshore Drilling Fluid Industry Revenue Share (%), by Basin 2024 & 2032
- Figure 40: Asia Pacific USA Onshore Drilling Fluid Industry Revenue (Million), by Country 2024 & 2032
- Figure 41: Asia Pacific USA Onshore Drilling Fluid Industry Revenue Share (%), by Country 2024 & 2032
List of Tables
- Table 1: Global USA Onshore Drilling Fluid Industry Revenue Million Forecast, by Region 2019 & 2032
- Table 2: Global USA Onshore Drilling Fluid Industry Revenue Million Forecast, by Additive Type 2019 & 2032
- Table 3: Global USA Onshore Drilling Fluid Industry Revenue Million Forecast, by Product Type 2019 & 2032
- Table 4: Global USA Onshore Drilling Fluid Industry Revenue Million Forecast, by Basin 2019 & 2032
- Table 5: Global USA Onshore Drilling Fluid Industry Revenue Million Forecast, by Region 2019 & 2032
- Table 6: Global USA Onshore Drilling Fluid Industry Revenue Million Forecast, by Additive Type 2019 & 2032
- Table 7: Global USA Onshore Drilling Fluid Industry Revenue Million Forecast, by Product Type 2019 & 2032
- Table 8: Global USA Onshore Drilling Fluid Industry Revenue Million Forecast, by Basin 2019 & 2032
- Table 9: Global USA Onshore Drilling Fluid Industry Revenue Million Forecast, by Country 2019 & 2032
- Table 10: United States USA Onshore Drilling Fluid Industry Revenue (Million) Forecast, by Application 2019 & 2032
- Table 11: Canada USA Onshore Drilling Fluid Industry Revenue (Million) Forecast, by Application 2019 & 2032
- Table 12: Mexico USA Onshore Drilling Fluid Industry Revenue (Million) Forecast, by Application 2019 & 2032
- Table 13: Global USA Onshore Drilling Fluid Industry Revenue Million Forecast, by Additive Type 2019 & 2032
- Table 14: Global USA Onshore Drilling Fluid Industry Revenue Million Forecast, by Product Type 2019 & 2032
- Table 15: Global USA Onshore Drilling Fluid Industry Revenue Million Forecast, by Basin 2019 & 2032
- Table 16: Global USA Onshore Drilling Fluid Industry Revenue Million Forecast, by Country 2019 & 2032
- Table 17: Brazil USA Onshore Drilling Fluid Industry Revenue (Million) Forecast, by Application 2019 & 2032
- Table 18: Argentina USA Onshore Drilling Fluid Industry Revenue (Million) Forecast, by Application 2019 & 2032
- Table 19: Rest of South America USA Onshore Drilling Fluid Industry Revenue (Million) Forecast, by Application 2019 & 2032
- Table 20: Global USA Onshore Drilling Fluid Industry Revenue Million Forecast, by Additive Type 2019 & 2032
- Table 21: Global USA Onshore Drilling Fluid Industry Revenue Million Forecast, by Product Type 2019 & 2032
- Table 22: Global USA Onshore Drilling Fluid Industry Revenue Million Forecast, by Basin 2019 & 2032
- Table 23: Global USA Onshore Drilling Fluid Industry Revenue Million Forecast, by Country 2019 & 2032
- Table 24: United Kingdom USA Onshore Drilling Fluid Industry Revenue (Million) Forecast, by Application 2019 & 2032
- Table 25: Germany USA Onshore Drilling Fluid Industry Revenue (Million) Forecast, by Application 2019 & 2032
- Table 26: France USA Onshore Drilling Fluid Industry Revenue (Million) Forecast, by Application 2019 & 2032
- Table 27: Italy USA Onshore Drilling Fluid Industry Revenue (Million) Forecast, by Application 2019 & 2032
- Table 28: Spain USA Onshore Drilling Fluid Industry Revenue (Million) Forecast, by Application 2019 & 2032
- Table 29: Russia USA Onshore Drilling Fluid Industry Revenue (Million) Forecast, by Application 2019 & 2032
- Table 30: Benelux USA Onshore Drilling Fluid Industry Revenue (Million) Forecast, by Application 2019 & 2032
- Table 31: Nordics USA Onshore Drilling Fluid Industry Revenue (Million) Forecast, by Application 2019 & 2032
- Table 32: Rest of Europe USA Onshore Drilling Fluid Industry Revenue (Million) Forecast, by Application 2019 & 2032
- Table 33: Global USA Onshore Drilling Fluid Industry Revenue Million Forecast, by Additive Type 2019 & 2032
- Table 34: Global USA Onshore Drilling Fluid Industry Revenue Million Forecast, by Product Type 2019 & 2032
- Table 35: Global USA Onshore Drilling Fluid Industry Revenue Million Forecast, by Basin 2019 & 2032
- Table 36: Global USA Onshore Drilling Fluid Industry Revenue Million Forecast, by Country 2019 & 2032
- Table 37: Turkey USA Onshore Drilling Fluid Industry Revenue (Million) Forecast, by Application 2019 & 2032
- Table 38: Israel USA Onshore Drilling Fluid Industry Revenue (Million) Forecast, by Application 2019 & 2032
- Table 39: GCC USA Onshore Drilling Fluid Industry Revenue (Million) Forecast, by Application 2019 & 2032
- Table 40: North Africa USA Onshore Drilling Fluid Industry Revenue (Million) Forecast, by Application 2019 & 2032
- Table 41: South Africa USA Onshore Drilling Fluid Industry Revenue (Million) Forecast, by Application 2019 & 2032
- Table 42: Rest of Middle East & Africa USA Onshore Drilling Fluid Industry Revenue (Million) Forecast, by Application 2019 & 2032
- Table 43: Global USA Onshore Drilling Fluid Industry Revenue Million Forecast, by Additive Type 2019 & 2032
- Table 44: Global USA Onshore Drilling Fluid Industry Revenue Million Forecast, by Product Type 2019 & 2032
- Table 45: Global USA Onshore Drilling Fluid Industry Revenue Million Forecast, by Basin 2019 & 2032
- Table 46: Global USA Onshore Drilling Fluid Industry Revenue Million Forecast, by Country 2019 & 2032
- Table 47: China USA Onshore Drilling Fluid Industry Revenue (Million) Forecast, by Application 2019 & 2032
- Table 48: India USA Onshore Drilling Fluid Industry Revenue (Million) Forecast, by Application 2019 & 2032
- Table 49: Japan USA Onshore Drilling Fluid Industry Revenue (Million) Forecast, by Application 2019 & 2032
- Table 50: South Korea USA Onshore Drilling Fluid Industry Revenue (Million) Forecast, by Application 2019 & 2032
- Table 51: ASEAN USA Onshore Drilling Fluid Industry Revenue (Million) Forecast, by Application 2019 & 2032
- Table 52: Oceania USA Onshore Drilling Fluid Industry Revenue (Million) Forecast, by Application 2019 & 2032
- Table 53: Rest of Asia Pacific USA Onshore Drilling Fluid Industry Revenue (Million) Forecast, by Application 2019 & 2032
Frequently Asked Questions
1. What is the projected Compound Annual Growth Rate (CAGR) of the USA Onshore Drilling Fluid Industry?
The projected CAGR is approximately > 13.00%.
2. Which companies are prominent players in the USA Onshore Drilling Fluid Industry?
Key companies in the market include IMDEX LIMITED, Horizon Mud, Aes Drilling Fluids, MEDSERV, Baker Hughes Company, Schlumberger Limited, Newpark Resources Inc, Weatherford, National Oilwell Varco, Francis Drilling Fluids Ltd, Oleon Americas Inc (Avril Group), Q'max Solutions Inc, Unique Drilling Fluids Inc, Sunwest Fluids LLC, McAda Drilling Fluids, Geo Drilling Fluids Inc, CES Energy Solutions Corp *List Not Exhaustive.
3. What are the main segments of the USA Onshore Drilling Fluid Industry?
The market segments include Additive Type, Product Type, Basin.
4. Can you provide details about the market size?
The market size is estimated to be USD XX Million as of 2022.
5. What are some drivers contributing to market growth?
; Low Breakeven Price and High Crude Oil Price; Increasing Demand for Longer Lateral Length; Continuous Growth in Demand from Permian Basin.
6. What are the notable trends driving market growth?
Continuous Growth in Demand from Permian Basin.
7. Are there any restraints impacting market growth?
; Low Breakeven Price and High Crude Oil Price; Increasing Demand for Longer Lateral Length; Continuous Growth in Demand from Permian Basin.
8. Can you provide examples of recent developments in the market?
N/A
9. What pricing options are available for accessing the report?
Pricing options include single-user, multi-user, and enterprise licenses priced at USD 3800, USD 4500, and USD 5800 respectively.
10. Is the market size provided in terms of value or volume?
The market size is provided in terms of value, measured in Million.
11. Are there any specific market keywords associated with the report?
Yes, the market keyword associated with the report is "USA Onshore Drilling Fluid Industry," which aids in identifying and referencing the specific market segment covered.
12. How do I determine which pricing option suits my needs best?
The pricing options vary based on user requirements and access needs. Individual users may opt for single-user licenses, while businesses requiring broader access may choose multi-user or enterprise licenses for cost-effective access to the report.
13. Are there any additional resources or data provided in the USA Onshore Drilling Fluid Industry report?
While the report offers comprehensive insights, it's advisable to review the specific contents or supplementary materials provided to ascertain if additional resources or data are available.
14. How can I stay updated on further developments or reports in the USA Onshore Drilling Fluid Industry?
To stay informed about further developments, trends, and reports in the USA Onshore Drilling Fluid Industry, consider subscribing to industry newsletters, following relevant companies and organizations, or regularly checking reputable industry news sources and publications.
Methodology
Step 1 - Identification of Relevant Samples Size from Population Database


Step 2 - Approaches for Defining Global Market Size (Value, Volume* & Price*)

Note*: In applicable scenarios
Step 3 - Data Sources
Primary Research
- Web Analytics
- Survey Reports
- Research Institute
- Latest Research Reports
- Opinion Leaders
Secondary Research
- Annual Reports
- White Paper
- Latest Press Release
- Industry Association
- Paid Database
- Investor Presentations

Step 4 - Data Triangulation
Involves using different sources of information in order to increase the validity of a study
These sources are likely to be stakeholders in a program - participants, other researchers, program staff, other community members, and so on.
Then we put all data in single framework & apply various statistical tools to find out the dynamic on the market.
During the analysis stage, feedback from the stakeholder groups would be compared to determine areas of agreement as well as areas of divergence
