

Key Insights
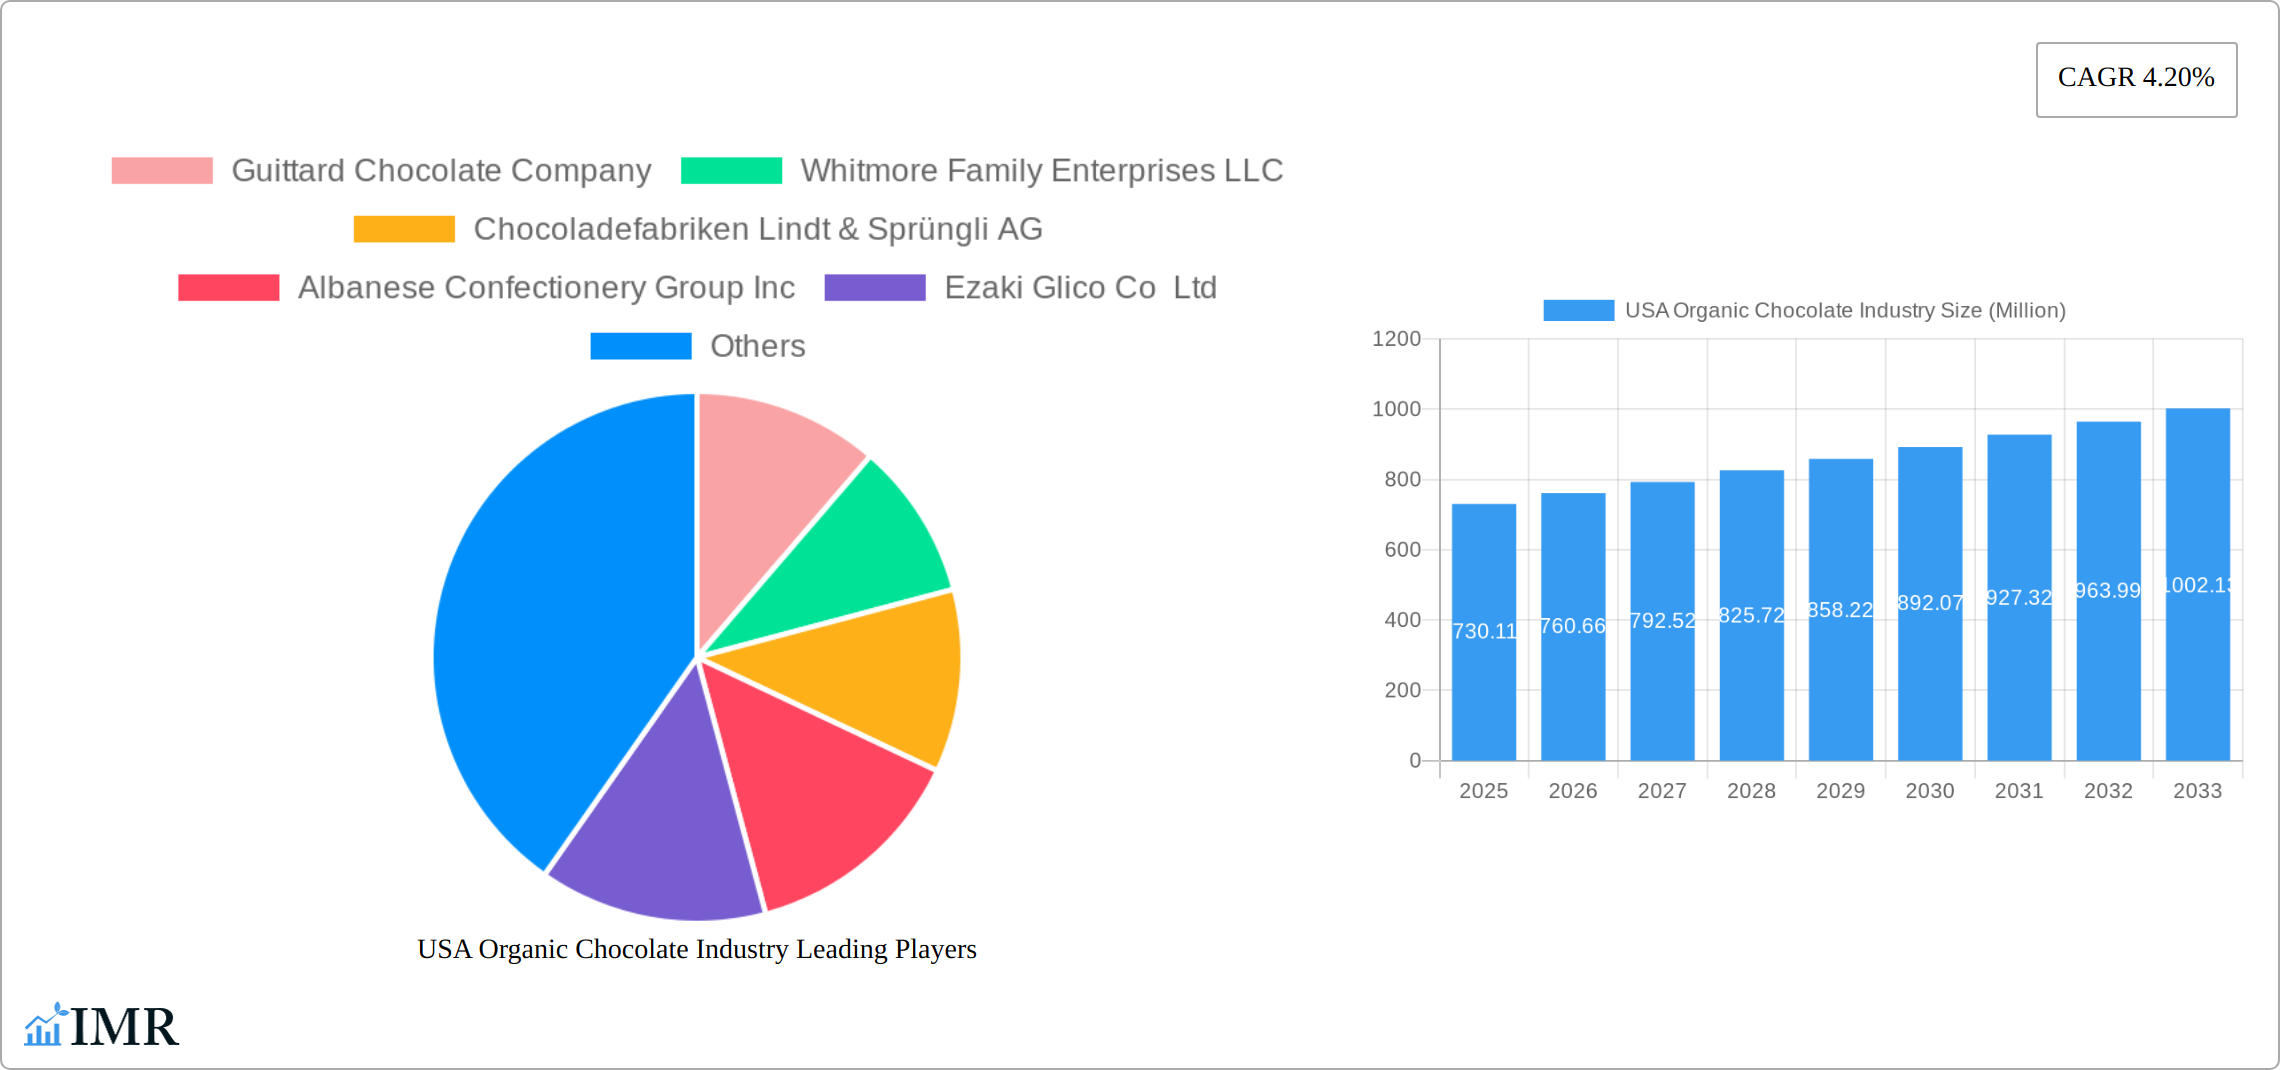
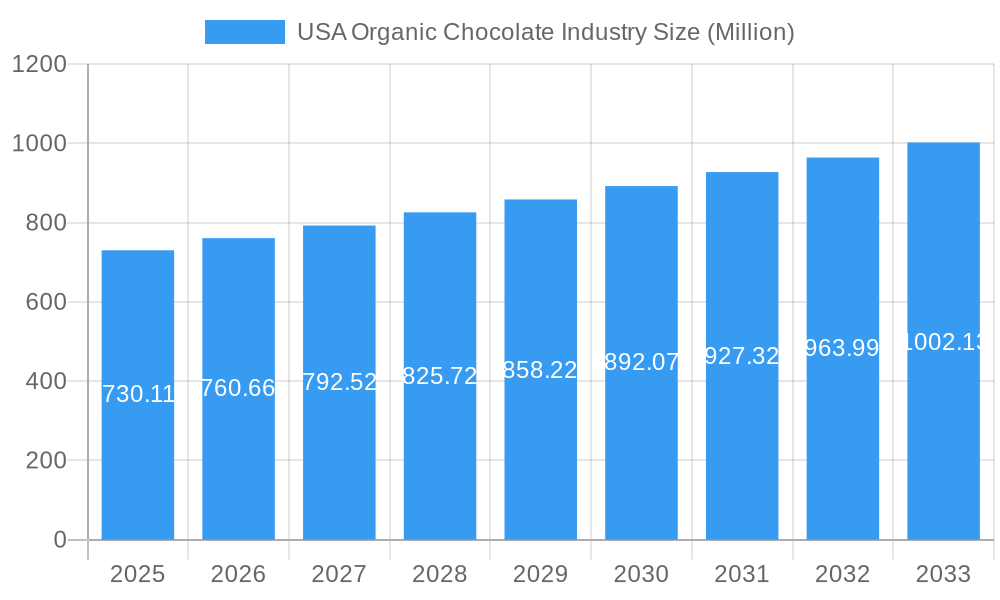
The US organic chocolate market is poised for significant expansion, projected to reach $28.91 billion by 2025, with a Compound Annual Growth Rate (CAGR) of 4.58% from 2025 to 2033. This growth is propelled by heightened consumer awareness of organic product health benefits and a growing demand for premium, ethically sourced confectionery. The increasing preference for sustainable and environmentally conscious products further fuels market momentum. The rising popularity of vegan and dairy-free organic chocolate options also caters to diverse dietary needs, contributing to overall market volume. Dark chocolate, recognized for its health advantages, commands a substantial share within confectionery variants. While supermarkets and hypermarkets remain primary distribution channels, online retail is experiencing rapid growth, reflecting evolving consumer purchasing behaviors. The competitive landscape features established brands alongside specialized organic chocolate manufacturers, with potential for accelerated growth in health-conscious regions such as the West Coast.
USA Organic Chocolate Industry Market Size (In Billion)
Key challenges include raw material price volatility, necessitating strategic supply chain management. Maintaining supply chain transparency and ethical sourcing are paramount for consumer trust and brand integrity. Ongoing consumer education regarding organic certification and its distinctions from conventional chocolate is vital. Overcoming these challenges requires strategic investments in supply chain optimization, robust brand building, and targeted marketing that highlights organic chocolate's health, sustainability, and superior taste benefits. Continuous product innovation, including novel flavors and formats, will be essential for market dynamism and attracting new consumer segments.
USA Organic Chocolate Industry Company Market Share
USA Organic Chocolate Industry: Market Report 2019-2033
This comprehensive report provides an in-depth analysis of the USA organic chocolate industry, encompassing market dynamics, growth trends, key players, and future outlook. The report covers the period from 2019 to 2033, with a focus on 2025 as the base and estimated year. The analysis delves into various segments, including confectionery variants (dark, milk, and white chocolate), distribution channels (convenience stores, online retail, supermarkets/hypermarkets, and others), and key industry players. This report is invaluable for industry professionals, investors, and anyone seeking a thorough understanding of this dynamic market. The total market size in 2025 is estimated at $XX Million.
USA Organic Chocolate Industry Market Dynamics & Structure
The USA organic chocolate market exhibits a moderately concentrated structure, with several large multinational players alongside smaller, specialized brands. Technological innovation, driven by sustainable sourcing practices and enhanced production processes, plays a crucial role. Stringent regulatory frameworks concerning organic certification and labeling influence market dynamics. Competitive substitutes, such as conventional chocolates and other confectionery items, exert pressure on market growth. The end-user demographic is characterized by a growing preference for healthy and ethically sourced products, predominantly among health-conscious millennials and Gen Z consumers. The past five years have seen a moderate level of mergers and acquisitions (M&A) activity, mostly focused on consolidating market share and expanding product portfolios.
- Market Concentration: Moderately concentrated, with a top 5 market share of approximately 60%.
- Technological Innovation: Focus on sustainable sourcing, automation in production, and improved packaging.
- Regulatory Framework: Stringent organic certification standards and labeling regulations.
- Competitive Substitutes: Conventional chocolates and other confectioneries.
- End-User Demographics: Health-conscious consumers, particularly millennials and Gen Z.
- M&A Activity: XX deals recorded between 2019-2024, totaling an estimated value of $XX Million.
USA Organic Chocolate Industry Growth Trends & Insights
The US organic chocolate market has experienced remarkable growth from 2019 to 2024, fueled by a surge in consumer demand for ethically sourced and organically produced food. This trend is amplified by heightened health consciousness and rising disposable incomes within key demographics. While precise CAGR figures require specific data input (replace XX% with actual data), the market's expansion is undeniable. Technological advancements, particularly in sustainable farming and streamlined manufacturing, are significantly contributing to this growth. The increasing preference for premium and specialized organic chocolate varieties further fuels this expansion. The market size in 2025 is estimated at $XX Million (replace XX with actual data), with projections reaching $XX Million by 2033 (replace XX with actual data), indicating a CAGR of XX% (replace XX with actual data) during the forecast period (2025-2033). Currently, organic chocolate holds approximately XX% (replace XX with actual data) of the broader US chocolate market, with projections showing substantial increases by 2033.
Dominant Regions, Countries, or Segments in USA Organic Chocolate Industry
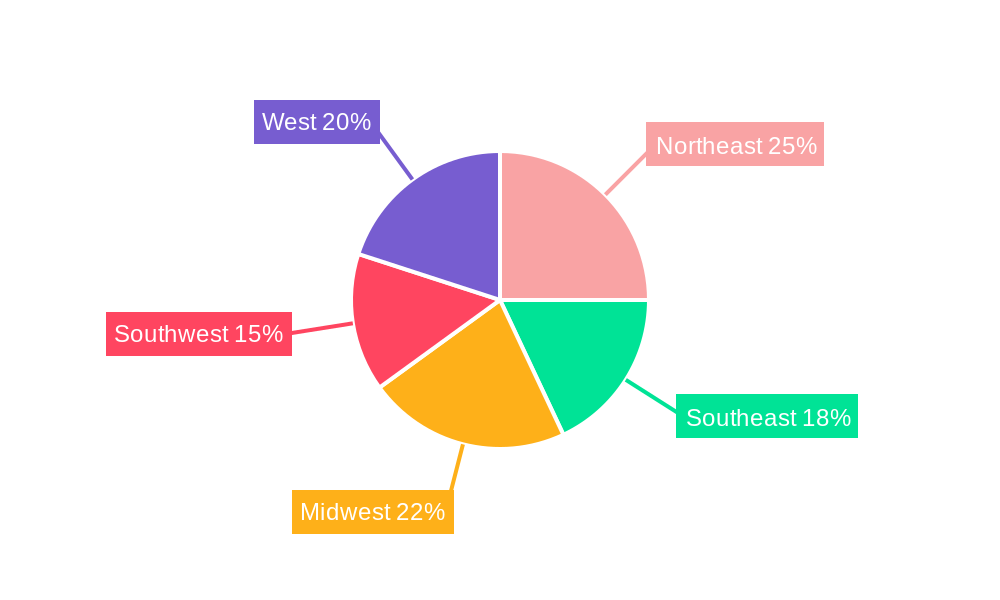
The Western region of the USA, including states like California, Oregon, and Washington, currently holds the largest market share within the organic chocolate industry due to high consumer awareness of organic products and a strong presence of organic farming practices. California alone accounts for approximately XX% of the total market share. The supermarket/hypermarket distribution channel is the most dominant, followed by online retail, reflecting convenience and accessibility for consumers. Within confectionery variants, dark chocolate commands the largest market share, driven by its perceived health benefits and intense flavor profile.
- Key Drivers:
- High consumer awareness of organic products in the Western region.
- Strong presence of organic farming practices.
- Increased adoption of online retail channels.
- Growing preference for dark chocolate.
- Dominance Factors:
- Market share: Western region (XX%), Supermarket/Hypermarket (XX%), Dark Chocolate (XX%).
- Growth potential: Online retail and white chocolate segments show high growth prospects.
USA Organic Chocolate Industry Product Landscape
The organic chocolate product landscape is characterized by a diverse range of offerings, including dark, milk, and white chocolate bars, as well as various confectionery items like truffles and pralines. Innovation focuses on unique flavor combinations, using ethically sourced ingredients and sustainable packaging. Several brands incorporate fair-trade certifications and highlight their environmental impact. Performance metrics include consumer feedback, sales figures, and brand loyalty. Companies are increasingly incorporating unique selling propositions centered on sustainability and health benefits.
Key Drivers, Barriers & Challenges in USA Organic Chocolate Industry
Key Drivers:
- Growing consumer preference for organic and ethically sourced food.
- Increasing health consciousness among consumers.
- Technological advancements in sustainable farming practices.
Challenges & Restraints:
- Higher production costs compared to conventional chocolate.
- Fluctuations in the prices of organic cocoa beans.
- Intense competition from established chocolate brands.
- Supply chain disruptions due to climate change and geopolitical factors. These factors have resulted in an estimated XX% increase in production costs over the past 2 years.
Emerging Opportunities in USA Organic Chocolate Industry
- Booming Vegan and Plant-Based Segment: The demand for organic vegan chocolate is experiencing explosive growth, presenting significant opportunities for manufacturers.
- Expanding Confectionery Market: The market for organic chocolate confectionery products, including bars, bonbons, and other treats, shows strong potential for expansion.
- Personalization and Customization: Consumers increasingly seek personalized and customized chocolate experiences, opening doors for niche offerings and bespoke creations.
- Unique Flavors and Premium Experiences: The focus on unique and sophisticated flavor combinations, coupled with a premium chocolate experience, is driving market differentiation and growth.
- Health and Wellness Focus: Marketing organic chocolate's health benefits (e.g., antioxidants) can attract a growing health-conscious consumer base.
Growth Accelerators in the USA Organic Chocolate Industry Industry
Technological advancements in sustainable farming and production methods are key growth drivers. Strategic partnerships with organic cocoa bean farmers ensure high-quality sourcing and ethical practices. Market expansion into new regions, focusing on untapped consumer segments with a focus on health and sustainability, represents significant growth potential.
Key Players Shaping the USA Organic Chocolate Industry Market
- Guittard Chocolate Company
- Whitmore Family Enterprises LLC
- Chocoladefabriken Lindt & Sprüngli AG
- Albanese Confectionery Group Inc
- Ezaki Glico Co Ltd
- Vosges Haut-Chocolat LLC
- Salmon River Foods Inc
- Ferrero International SA
- TCHO Ventures Inc
- Mars Incorporated
- Yıldız Holding A.Ş.
- Barry Callebaut AG
- Mast Brothers & Co
- Mondelēz International Inc
- The Hershey Company
Notable Milestones in USA Organic Chocolate Industry Sector
- September 2022: Mondelēz International Inc. broadened its Green & Black's premium organic chocolate brand with the launch of its "Smooth" range in North America, indicating a major player's commitment to the organic sector.
- October 2022: Lindt & Sprungli USA launched its first-ever 3D virtual store, demonstrating innovative approaches to brand engagement and market reach in the digital age.
- November 2022: Yıldız Holding AS's GODIVA brand introduced its "Holiday Collection Packs" of premium chocolates, showcasing successful marketing strategies within the premium organic chocolate segment.
- [Add more recent milestones here with dates and brief descriptions] Include other significant developments, such as new product launches, partnerships, or market expansions by key players.
In-Depth USA Organic Chocolate Industry Market Outlook
The US organic chocolate market is poised for continued robust growth, driven by the increasing consumer preference for organic and sustainably produced goods, coupled with innovative technological advancements and strategic market expansion initiatives from key industry players. Strategic partnerships, investments in sustainable sourcing practices, and a strong emphasis on transparency throughout the supply chain will further propel market expansion. The ongoing focus on unique and appealing flavor profiles, demonstrable health benefits, and ethical sourcing will remain central to product development and consumer preferences, resulting in substantial market growth potential in the years to come. The market's future success hinges on maintaining this commitment to quality, sustainability, and ethical practices.
USA Organic Chocolate Industry Segmentation
-
1. Confectionery Variant
- 1.1. Dark Chocolate
- 1.2. Milk and White Chocolate
-
2. Distribution Channel
- 2.1. Convenience Store
- 2.2. Online Retail Store
- 2.3. Supermarket/Hypermarket
- 2.4. Others
USA Organic Chocolate Industry Segmentation By Geography
-
1. North America
- 1.1. United States
- 1.2. Canada
- 1.3. Mexico
-
2. South America
- 2.1. Brazil
- 2.2. Argentina
- 2.3. Rest of South America
-
3. Europe
- 3.1. United Kingdom
- 3.2. Germany
- 3.3. France
- 3.4. Italy
- 3.5. Spain
- 3.6. Russia
- 3.7. Benelux
- 3.8. Nordics
- 3.9. Rest of Europe
-
4. Middle East & Africa
- 4.1. Turkey
- 4.2. Israel
- 4.3. GCC
- 4.4. North Africa
- 4.5. South Africa
- 4.6. Rest of Middle East & Africa
-
5. Asia Pacific
- 5.1. China
- 5.2. India
- 5.3. Japan
- 5.4. South Korea
- 5.5. ASEAN
- 5.6. Oceania
- 5.7. Rest of Asia Pacific
USA Organic Chocolate Industry Regional Market Share
Geographic Coverage of USA Organic Chocolate Industry
USA Organic Chocolate Industry REPORT HIGHLIGHTS
| Aspects | Details |
|---|---|
| Study Period | 2020-2034 |
| Base Year | 2025 |
| Estimated Year | 2026 |
| Forecast Period | 2026-2034 |
| Historical Period | 2020-2025 |
| Growth Rate | CAGR of 4.58% from 2020-2034 |
| Segmentation |
|
Table of Contents
- 1. Introduction
- 1.1. Research Scope
- 1.2. Market Segmentation
- 1.3. Research Methodology
- 1.4. Definitions and Assumptions
- 2. Executive Summary
- 2.1. Introduction
- 3. Market Dynamics
- 3.1. Introduction
- 3.2. Market Drivers
- 3.2.1. Escalating Demand for Processed Poultry Products; Favorable Government Initiatives to Boost Production
- 3.3. Market Restrains
- 3.3.1. Rising Vegan Trend among Young Consumers; Deeper Penetration of Red Meat Across Saudi Arabia
- 3.4. Market Trends
- 3.4.1. OTHER KEY INDUSTRY TRENDS COVERED IN THE REPORT
- 4. Market Factor Analysis
- 4.1. Porters Five Forces
- 4.2. Supply/Value Chain
- 4.3. PESTEL analysis
- 4.4. Market Entropy
- 4.5. Patent/Trademark Analysis
- 5. Global USA Organic Chocolate Industry Analysis, Insights and Forecast, 2020-2032
- 5.1. Market Analysis, Insights and Forecast - by Confectionery Variant
- 5.1.1. Dark Chocolate
- 5.1.2. Milk and White Chocolate
- 5.2. Market Analysis, Insights and Forecast - by Distribution Channel
- 5.2.1. Convenience Store
- 5.2.2. Online Retail Store
- 5.2.3. Supermarket/Hypermarket
- 5.2.4. Others
- 5.3. Market Analysis, Insights and Forecast - by Region
- 5.3.1. North America
- 5.3.2. South America
- 5.3.3. Europe
- 5.3.4. Middle East & Africa
- 5.3.5. Asia Pacific
- 5.1. Market Analysis, Insights and Forecast - by Confectionery Variant
- 6. North America USA Organic Chocolate Industry Analysis, Insights and Forecast, 2020-2032
- 6.1. Market Analysis, Insights and Forecast - by Confectionery Variant
- 6.1.1. Dark Chocolate
- 6.1.2. Milk and White Chocolate
- 6.2. Market Analysis, Insights and Forecast - by Distribution Channel
- 6.2.1. Convenience Store
- 6.2.2. Online Retail Store
- 6.2.3. Supermarket/Hypermarket
- 6.2.4. Others
- 6.1. Market Analysis, Insights and Forecast - by Confectionery Variant
- 7. South America USA Organic Chocolate Industry Analysis, Insights and Forecast, 2020-2032
- 7.1. Market Analysis, Insights and Forecast - by Confectionery Variant
- 7.1.1. Dark Chocolate
- 7.1.2. Milk and White Chocolate
- 7.2. Market Analysis, Insights and Forecast - by Distribution Channel
- 7.2.1. Convenience Store
- 7.2.2. Online Retail Store
- 7.2.3. Supermarket/Hypermarket
- 7.2.4. Others
- 7.1. Market Analysis, Insights and Forecast - by Confectionery Variant
- 8. Europe USA Organic Chocolate Industry Analysis, Insights and Forecast, 2020-2032
- 8.1. Market Analysis, Insights and Forecast - by Confectionery Variant
- 8.1.1. Dark Chocolate
- 8.1.2. Milk and White Chocolate
- 8.2. Market Analysis, Insights and Forecast - by Distribution Channel
- 8.2.1. Convenience Store
- 8.2.2. Online Retail Store
- 8.2.3. Supermarket/Hypermarket
- 8.2.4. Others
- 8.1. Market Analysis, Insights and Forecast - by Confectionery Variant
- 9. Middle East & Africa USA Organic Chocolate Industry Analysis, Insights and Forecast, 2020-2032
- 9.1. Market Analysis, Insights and Forecast - by Confectionery Variant
- 9.1.1. Dark Chocolate
- 9.1.2. Milk and White Chocolate
- 9.2. Market Analysis, Insights and Forecast - by Distribution Channel
- 9.2.1. Convenience Store
- 9.2.2. Online Retail Store
- 9.2.3. Supermarket/Hypermarket
- 9.2.4. Others
- 9.1. Market Analysis, Insights and Forecast - by Confectionery Variant
- 10. Asia Pacific USA Organic Chocolate Industry Analysis, Insights and Forecast, 2020-2032
- 10.1. Market Analysis, Insights and Forecast - by Confectionery Variant
- 10.1.1. Dark Chocolate
- 10.1.2. Milk and White Chocolate
- 10.2. Market Analysis, Insights and Forecast - by Distribution Channel
- 10.2.1. Convenience Store
- 10.2.2. Online Retail Store
- 10.2.3. Supermarket/Hypermarket
- 10.2.4. Others
- 10.1. Market Analysis, Insights and Forecast - by Confectionery Variant
- 11. Competitive Analysis
- 11.1. Global Market Share Analysis 2025
- 11.2. Company Profiles
- 11.2.1 Guittard Chocolate Company
- 11.2.1.1. Overview
- 11.2.1.2. Products
- 11.2.1.3. SWOT Analysis
- 11.2.1.4. Recent Developments
- 11.2.1.5. Financials (Based on Availability)
- 11.2.2 Whitmore Family Enterprises LLC
- 11.2.2.1. Overview
- 11.2.2.2. Products
- 11.2.2.3. SWOT Analysis
- 11.2.2.4. Recent Developments
- 11.2.2.5. Financials (Based on Availability)
- 11.2.3 Chocoladefabriken Lindt & Sprüngli AG
- 11.2.3.1. Overview
- 11.2.3.2. Products
- 11.2.3.3. SWOT Analysis
- 11.2.3.4. Recent Developments
- 11.2.3.5. Financials (Based on Availability)
- 11.2.4 Albanese Confectionery Group Inc
- 11.2.4.1. Overview
- 11.2.4.2. Products
- 11.2.4.3. SWOT Analysis
- 11.2.4.4. Recent Developments
- 11.2.4.5. Financials (Based on Availability)
- 11.2.5 Ezaki Glico Co Ltd
- 11.2.5.1. Overview
- 11.2.5.2. Products
- 11.2.5.3. SWOT Analysis
- 11.2.5.4. Recent Developments
- 11.2.5.5. Financials (Based on Availability)
- 11.2.6 Vosges Haut-Chocolat LLC
- 11.2.6.1. Overview
- 11.2.6.2. Products
- 11.2.6.3. SWOT Analysis
- 11.2.6.4. Recent Developments
- 11.2.6.5. Financials (Based on Availability)
- 11.2.7 Salmon River Foods Inc
- 11.2.7.1. Overview
- 11.2.7.2. Products
- 11.2.7.3. SWOT Analysis
- 11.2.7.4. Recent Developments
- 11.2.7.5. Financials (Based on Availability)
- 11.2.8 Ferrero International SA
- 11.2.8.1. Overview
- 11.2.8.2. Products
- 11.2.8.3. SWOT Analysis
- 11.2.8.4. Recent Developments
- 11.2.8.5. Financials (Based on Availability)
- 11.2.9 TCHO Ventures Inc
- 11.2.9.1. Overview
- 11.2.9.2. Products
- 11.2.9.3. SWOT Analysis
- 11.2.9.4. Recent Developments
- 11.2.9.5. Financials (Based on Availability)
- 11.2.10 Mars Incorporated
- 11.2.10.1. Overview
- 11.2.10.2. Products
- 11.2.10.3. SWOT Analysis
- 11.2.10.4. Recent Developments
- 11.2.10.5. Financials (Based on Availability)
- 11.2.11 Yıldız Holding A
- 11.2.11.1. Overview
- 11.2.11.2. Products
- 11.2.11.3. SWOT Analysis
- 11.2.11.4. Recent Developments
- 11.2.11.5. Financials (Based on Availability)
- 11.2.12 Barry Callebaut AG
- 11.2.12.1. Overview
- 11.2.12.2. Products
- 11.2.12.3. SWOT Analysis
- 11.2.12.4. Recent Developments
- 11.2.12.5. Financials (Based on Availability)
- 11.2.13 Mast Brothers & Co
- 11.2.13.1. Overview
- 11.2.13.2. Products
- 11.2.13.3. SWOT Analysis
- 11.2.13.4. Recent Developments
- 11.2.13.5. Financials (Based on Availability)
- 11.2.14 Mondelēz International Inc
- 11.2.14.1. Overview
- 11.2.14.2. Products
- 11.2.14.3. SWOT Analysis
- 11.2.14.4. Recent Developments
- 11.2.14.5. Financials (Based on Availability)
- 11.2.15 The Hershey Company
- 11.2.15.1. Overview
- 11.2.15.2. Products
- 11.2.15.3. SWOT Analysis
- 11.2.15.4. Recent Developments
- 11.2.15.5. Financials (Based on Availability)
- 11.2.1 Guittard Chocolate Company
List of Figures
- Figure 1: Global USA Organic Chocolate Industry Revenue Breakdown (billion, %) by Region 2025 & 2033
- Figure 2: Global USA Organic Chocolate Industry Volume Breakdown (Tons, %) by Region 2025 & 2033
- Figure 3: North America USA Organic Chocolate Industry Revenue (billion), by Confectionery Variant 2025 & 2033
- Figure 4: North America USA Organic Chocolate Industry Volume (Tons), by Confectionery Variant 2025 & 2033
- Figure 5: North America USA Organic Chocolate Industry Revenue Share (%), by Confectionery Variant 2025 & 2033
- Figure 6: North America USA Organic Chocolate Industry Volume Share (%), by Confectionery Variant 2025 & 2033
- Figure 7: North America USA Organic Chocolate Industry Revenue (billion), by Distribution Channel 2025 & 2033
- Figure 8: North America USA Organic Chocolate Industry Volume (Tons), by Distribution Channel 2025 & 2033
- Figure 9: North America USA Organic Chocolate Industry Revenue Share (%), by Distribution Channel 2025 & 2033
- Figure 10: North America USA Organic Chocolate Industry Volume Share (%), by Distribution Channel 2025 & 2033
- Figure 11: North America USA Organic Chocolate Industry Revenue (billion), by Country 2025 & 2033
- Figure 12: North America USA Organic Chocolate Industry Volume (Tons), by Country 2025 & 2033
- Figure 13: North America USA Organic Chocolate Industry Revenue Share (%), by Country 2025 & 2033
- Figure 14: North America USA Organic Chocolate Industry Volume Share (%), by Country 2025 & 2033
- Figure 15: South America USA Organic Chocolate Industry Revenue (billion), by Confectionery Variant 2025 & 2033
- Figure 16: South America USA Organic Chocolate Industry Volume (Tons), by Confectionery Variant 2025 & 2033
- Figure 17: South America USA Organic Chocolate Industry Revenue Share (%), by Confectionery Variant 2025 & 2033
- Figure 18: South America USA Organic Chocolate Industry Volume Share (%), by Confectionery Variant 2025 & 2033
- Figure 19: South America USA Organic Chocolate Industry Revenue (billion), by Distribution Channel 2025 & 2033
- Figure 20: South America USA Organic Chocolate Industry Volume (Tons), by Distribution Channel 2025 & 2033
- Figure 21: South America USA Organic Chocolate Industry Revenue Share (%), by Distribution Channel 2025 & 2033
- Figure 22: South America USA Organic Chocolate Industry Volume Share (%), by Distribution Channel 2025 & 2033
- Figure 23: South America USA Organic Chocolate Industry Revenue (billion), by Country 2025 & 2033
- Figure 24: South America USA Organic Chocolate Industry Volume (Tons), by Country 2025 & 2033
- Figure 25: South America USA Organic Chocolate Industry Revenue Share (%), by Country 2025 & 2033
- Figure 26: South America USA Organic Chocolate Industry Volume Share (%), by Country 2025 & 2033
- Figure 27: Europe USA Organic Chocolate Industry Revenue (billion), by Confectionery Variant 2025 & 2033
- Figure 28: Europe USA Organic Chocolate Industry Volume (Tons), by Confectionery Variant 2025 & 2033
- Figure 29: Europe USA Organic Chocolate Industry Revenue Share (%), by Confectionery Variant 2025 & 2033
- Figure 30: Europe USA Organic Chocolate Industry Volume Share (%), by Confectionery Variant 2025 & 2033
- Figure 31: Europe USA Organic Chocolate Industry Revenue (billion), by Distribution Channel 2025 & 2033
- Figure 32: Europe USA Organic Chocolate Industry Volume (Tons), by Distribution Channel 2025 & 2033
- Figure 33: Europe USA Organic Chocolate Industry Revenue Share (%), by Distribution Channel 2025 & 2033
- Figure 34: Europe USA Organic Chocolate Industry Volume Share (%), by Distribution Channel 2025 & 2033
- Figure 35: Europe USA Organic Chocolate Industry Revenue (billion), by Country 2025 & 2033
- Figure 36: Europe USA Organic Chocolate Industry Volume (Tons), by Country 2025 & 2033
- Figure 37: Europe USA Organic Chocolate Industry Revenue Share (%), by Country 2025 & 2033
- Figure 38: Europe USA Organic Chocolate Industry Volume Share (%), by Country 2025 & 2033
- Figure 39: Middle East & Africa USA Organic Chocolate Industry Revenue (billion), by Confectionery Variant 2025 & 2033
- Figure 40: Middle East & Africa USA Organic Chocolate Industry Volume (Tons), by Confectionery Variant 2025 & 2033
- Figure 41: Middle East & Africa USA Organic Chocolate Industry Revenue Share (%), by Confectionery Variant 2025 & 2033
- Figure 42: Middle East & Africa USA Organic Chocolate Industry Volume Share (%), by Confectionery Variant 2025 & 2033
- Figure 43: Middle East & Africa USA Organic Chocolate Industry Revenue (billion), by Distribution Channel 2025 & 2033
- Figure 44: Middle East & Africa USA Organic Chocolate Industry Volume (Tons), by Distribution Channel 2025 & 2033
- Figure 45: Middle East & Africa USA Organic Chocolate Industry Revenue Share (%), by Distribution Channel 2025 & 2033
- Figure 46: Middle East & Africa USA Organic Chocolate Industry Volume Share (%), by Distribution Channel 2025 & 2033
- Figure 47: Middle East & Africa USA Organic Chocolate Industry Revenue (billion), by Country 2025 & 2033
- Figure 48: Middle East & Africa USA Organic Chocolate Industry Volume (Tons), by Country 2025 & 2033
- Figure 49: Middle East & Africa USA Organic Chocolate Industry Revenue Share (%), by Country 2025 & 2033
- Figure 50: Middle East & Africa USA Organic Chocolate Industry Volume Share (%), by Country 2025 & 2033
- Figure 51: Asia Pacific USA Organic Chocolate Industry Revenue (billion), by Confectionery Variant 2025 & 2033
- Figure 52: Asia Pacific USA Organic Chocolate Industry Volume (Tons), by Confectionery Variant 2025 & 2033
- Figure 53: Asia Pacific USA Organic Chocolate Industry Revenue Share (%), by Confectionery Variant 2025 & 2033
- Figure 54: Asia Pacific USA Organic Chocolate Industry Volume Share (%), by Confectionery Variant 2025 & 2033
- Figure 55: Asia Pacific USA Organic Chocolate Industry Revenue (billion), by Distribution Channel 2025 & 2033
- Figure 56: Asia Pacific USA Organic Chocolate Industry Volume (Tons), by Distribution Channel 2025 & 2033
- Figure 57: Asia Pacific USA Organic Chocolate Industry Revenue Share (%), by Distribution Channel 2025 & 2033
- Figure 58: Asia Pacific USA Organic Chocolate Industry Volume Share (%), by Distribution Channel 2025 & 2033
- Figure 59: Asia Pacific USA Organic Chocolate Industry Revenue (billion), by Country 2025 & 2033
- Figure 60: Asia Pacific USA Organic Chocolate Industry Volume (Tons), by Country 2025 & 2033
- Figure 61: Asia Pacific USA Organic Chocolate Industry Revenue Share (%), by Country 2025 & 2033
- Figure 62: Asia Pacific USA Organic Chocolate Industry Volume Share (%), by Country 2025 & 2033
List of Tables
- Table 1: Global USA Organic Chocolate Industry Revenue billion Forecast, by Confectionery Variant 2020 & 2033
- Table 2: Global USA Organic Chocolate Industry Volume Tons Forecast, by Confectionery Variant 2020 & 2033
- Table 3: Global USA Organic Chocolate Industry Revenue billion Forecast, by Distribution Channel 2020 & 2033
- Table 4: Global USA Organic Chocolate Industry Volume Tons Forecast, by Distribution Channel 2020 & 2033
- Table 5: Global USA Organic Chocolate Industry Revenue billion Forecast, by Region 2020 & 2033
- Table 6: Global USA Organic Chocolate Industry Volume Tons Forecast, by Region 2020 & 2033
- Table 7: Global USA Organic Chocolate Industry Revenue billion Forecast, by Confectionery Variant 2020 & 2033
- Table 8: Global USA Organic Chocolate Industry Volume Tons Forecast, by Confectionery Variant 2020 & 2033
- Table 9: Global USA Organic Chocolate Industry Revenue billion Forecast, by Distribution Channel 2020 & 2033
- Table 10: Global USA Organic Chocolate Industry Volume Tons Forecast, by Distribution Channel 2020 & 2033
- Table 11: Global USA Organic Chocolate Industry Revenue billion Forecast, by Country 2020 & 2033
- Table 12: Global USA Organic Chocolate Industry Volume Tons Forecast, by Country 2020 & 2033
- Table 13: United States USA Organic Chocolate Industry Revenue (billion) Forecast, by Application 2020 & 2033
- Table 14: United States USA Organic Chocolate Industry Volume (Tons) Forecast, by Application 2020 & 2033
- Table 15: Canada USA Organic Chocolate Industry Revenue (billion) Forecast, by Application 2020 & 2033
- Table 16: Canada USA Organic Chocolate Industry Volume (Tons) Forecast, by Application 2020 & 2033
- Table 17: Mexico USA Organic Chocolate Industry Revenue (billion) Forecast, by Application 2020 & 2033
- Table 18: Mexico USA Organic Chocolate Industry Volume (Tons) Forecast, by Application 2020 & 2033
- Table 19: Global USA Organic Chocolate Industry Revenue billion Forecast, by Confectionery Variant 2020 & 2033
- Table 20: Global USA Organic Chocolate Industry Volume Tons Forecast, by Confectionery Variant 2020 & 2033
- Table 21: Global USA Organic Chocolate Industry Revenue billion Forecast, by Distribution Channel 2020 & 2033
- Table 22: Global USA Organic Chocolate Industry Volume Tons Forecast, by Distribution Channel 2020 & 2033
- Table 23: Global USA Organic Chocolate Industry Revenue billion Forecast, by Country 2020 & 2033
- Table 24: Global USA Organic Chocolate Industry Volume Tons Forecast, by Country 2020 & 2033
- Table 25: Brazil USA Organic Chocolate Industry Revenue (billion) Forecast, by Application 2020 & 2033
- Table 26: Brazil USA Organic Chocolate Industry Volume (Tons) Forecast, by Application 2020 & 2033
- Table 27: Argentina USA Organic Chocolate Industry Revenue (billion) Forecast, by Application 2020 & 2033
- Table 28: Argentina USA Organic Chocolate Industry Volume (Tons) Forecast, by Application 2020 & 2033
- Table 29: Rest of South America USA Organic Chocolate Industry Revenue (billion) Forecast, by Application 2020 & 2033
- Table 30: Rest of South America USA Organic Chocolate Industry Volume (Tons) Forecast, by Application 2020 & 2033
- Table 31: Global USA Organic Chocolate Industry Revenue billion Forecast, by Confectionery Variant 2020 & 2033
- Table 32: Global USA Organic Chocolate Industry Volume Tons Forecast, by Confectionery Variant 2020 & 2033
- Table 33: Global USA Organic Chocolate Industry Revenue billion Forecast, by Distribution Channel 2020 & 2033
- Table 34: Global USA Organic Chocolate Industry Volume Tons Forecast, by Distribution Channel 2020 & 2033
- Table 35: Global USA Organic Chocolate Industry Revenue billion Forecast, by Country 2020 & 2033
- Table 36: Global USA Organic Chocolate Industry Volume Tons Forecast, by Country 2020 & 2033
- Table 37: United Kingdom USA Organic Chocolate Industry Revenue (billion) Forecast, by Application 2020 & 2033
- Table 38: United Kingdom USA Organic Chocolate Industry Volume (Tons) Forecast, by Application 2020 & 2033
- Table 39: Germany USA Organic Chocolate Industry Revenue (billion) Forecast, by Application 2020 & 2033
- Table 40: Germany USA Organic Chocolate Industry Volume (Tons) Forecast, by Application 2020 & 2033
- Table 41: France USA Organic Chocolate Industry Revenue (billion) Forecast, by Application 2020 & 2033
- Table 42: France USA Organic Chocolate Industry Volume (Tons) Forecast, by Application 2020 & 2033
- Table 43: Italy USA Organic Chocolate Industry Revenue (billion) Forecast, by Application 2020 & 2033
- Table 44: Italy USA Organic Chocolate Industry Volume (Tons) Forecast, by Application 2020 & 2033
- Table 45: Spain USA Organic Chocolate Industry Revenue (billion) Forecast, by Application 2020 & 2033
- Table 46: Spain USA Organic Chocolate Industry Volume (Tons) Forecast, by Application 2020 & 2033
- Table 47: Russia USA Organic Chocolate Industry Revenue (billion) Forecast, by Application 2020 & 2033
- Table 48: Russia USA Organic Chocolate Industry Volume (Tons) Forecast, by Application 2020 & 2033
- Table 49: Benelux USA Organic Chocolate Industry Revenue (billion) Forecast, by Application 2020 & 2033
- Table 50: Benelux USA Organic Chocolate Industry Volume (Tons) Forecast, by Application 2020 & 2033
- Table 51: Nordics USA Organic Chocolate Industry Revenue (billion) Forecast, by Application 2020 & 2033
- Table 52: Nordics USA Organic Chocolate Industry Volume (Tons) Forecast, by Application 2020 & 2033
- Table 53: Rest of Europe USA Organic Chocolate Industry Revenue (billion) Forecast, by Application 2020 & 2033
- Table 54: Rest of Europe USA Organic Chocolate Industry Volume (Tons) Forecast, by Application 2020 & 2033
- Table 55: Global USA Organic Chocolate Industry Revenue billion Forecast, by Confectionery Variant 2020 & 2033
- Table 56: Global USA Organic Chocolate Industry Volume Tons Forecast, by Confectionery Variant 2020 & 2033
- Table 57: Global USA Organic Chocolate Industry Revenue billion Forecast, by Distribution Channel 2020 & 2033
- Table 58: Global USA Organic Chocolate Industry Volume Tons Forecast, by Distribution Channel 2020 & 2033
- Table 59: Global USA Organic Chocolate Industry Revenue billion Forecast, by Country 2020 & 2033
- Table 60: Global USA Organic Chocolate Industry Volume Tons Forecast, by Country 2020 & 2033
- Table 61: Turkey USA Organic Chocolate Industry Revenue (billion) Forecast, by Application 2020 & 2033
- Table 62: Turkey USA Organic Chocolate Industry Volume (Tons) Forecast, by Application 2020 & 2033
- Table 63: Israel USA Organic Chocolate Industry Revenue (billion) Forecast, by Application 2020 & 2033
- Table 64: Israel USA Organic Chocolate Industry Volume (Tons) Forecast, by Application 2020 & 2033
- Table 65: GCC USA Organic Chocolate Industry Revenue (billion) Forecast, by Application 2020 & 2033
- Table 66: GCC USA Organic Chocolate Industry Volume (Tons) Forecast, by Application 2020 & 2033
- Table 67: North Africa USA Organic Chocolate Industry Revenue (billion) Forecast, by Application 2020 & 2033
- Table 68: North Africa USA Organic Chocolate Industry Volume (Tons) Forecast, by Application 2020 & 2033
- Table 69: South Africa USA Organic Chocolate Industry Revenue (billion) Forecast, by Application 2020 & 2033
- Table 70: South Africa USA Organic Chocolate Industry Volume (Tons) Forecast, by Application 2020 & 2033
- Table 71: Rest of Middle East & Africa USA Organic Chocolate Industry Revenue (billion) Forecast, by Application 2020 & 2033
- Table 72: Rest of Middle East & Africa USA Organic Chocolate Industry Volume (Tons) Forecast, by Application 2020 & 2033
- Table 73: Global USA Organic Chocolate Industry Revenue billion Forecast, by Confectionery Variant 2020 & 2033
- Table 74: Global USA Organic Chocolate Industry Volume Tons Forecast, by Confectionery Variant 2020 & 2033
- Table 75: Global USA Organic Chocolate Industry Revenue billion Forecast, by Distribution Channel 2020 & 2033
- Table 76: Global USA Organic Chocolate Industry Volume Tons Forecast, by Distribution Channel 2020 & 2033
- Table 77: Global USA Organic Chocolate Industry Revenue billion Forecast, by Country 2020 & 2033
- Table 78: Global USA Organic Chocolate Industry Volume Tons Forecast, by Country 2020 & 2033
- Table 79: China USA Organic Chocolate Industry Revenue (billion) Forecast, by Application 2020 & 2033
- Table 80: China USA Organic Chocolate Industry Volume (Tons) Forecast, by Application 2020 & 2033
- Table 81: India USA Organic Chocolate Industry Revenue (billion) Forecast, by Application 2020 & 2033
- Table 82: India USA Organic Chocolate Industry Volume (Tons) Forecast, by Application 2020 & 2033
- Table 83: Japan USA Organic Chocolate Industry Revenue (billion) Forecast, by Application 2020 & 2033
- Table 84: Japan USA Organic Chocolate Industry Volume (Tons) Forecast, by Application 2020 & 2033
- Table 85: South Korea USA Organic Chocolate Industry Revenue (billion) Forecast, by Application 2020 & 2033
- Table 86: South Korea USA Organic Chocolate Industry Volume (Tons) Forecast, by Application 2020 & 2033
- Table 87: ASEAN USA Organic Chocolate Industry Revenue (billion) Forecast, by Application 2020 & 2033
- Table 88: ASEAN USA Organic Chocolate Industry Volume (Tons) Forecast, by Application 2020 & 2033
- Table 89: Oceania USA Organic Chocolate Industry Revenue (billion) Forecast, by Application 2020 & 2033
- Table 90: Oceania USA Organic Chocolate Industry Volume (Tons) Forecast, by Application 2020 & 2033
- Table 91: Rest of Asia Pacific USA Organic Chocolate Industry Revenue (billion) Forecast, by Application 2020 & 2033
- Table 92: Rest of Asia Pacific USA Organic Chocolate Industry Volume (Tons) Forecast, by Application 2020 & 2033
Frequently Asked Questions
1. What is the projected Compound Annual Growth Rate (CAGR) of the USA Organic Chocolate Industry?
The projected CAGR is approximately 4.58%.
2. Which companies are prominent players in the USA Organic Chocolate Industry?
Key companies in the market include Guittard Chocolate Company, Whitmore Family Enterprises LLC, Chocoladefabriken Lindt & Sprüngli AG, Albanese Confectionery Group Inc, Ezaki Glico Co Ltd, Vosges Haut-Chocolat LLC, Salmon River Foods Inc, Ferrero International SA, TCHO Ventures Inc, Mars Incorporated, Yıldız Holding A, Barry Callebaut AG, Mast Brothers & Co, Mondelēz International Inc, The Hershey Company.
3. What are the main segments of the USA Organic Chocolate Industry?
The market segments include Confectionery Variant, Distribution Channel.
4. Can you provide details about the market size?
The market size is estimated to be USD 28.91 billion as of 2022.
5. What are some drivers contributing to market growth?
Escalating Demand for Processed Poultry Products; Favorable Government Initiatives to Boost Production.
6. What are the notable trends driving market growth?
OTHER KEY INDUSTRY TRENDS COVERED IN THE REPORT.
7. Are there any restraints impacting market growth?
Rising Vegan Trend among Young Consumers; Deeper Penetration of Red Meat Across Saudi Arabia.
8. Can you provide examples of recent developments in the market?
November 2022: Yıldız Holding AS' brand GODIVA launched "Holiday Collection Packs" of premium chocolates. The chocolate packs include Milk Chocolate Praline Heart, Midnight Swirl, and White Chocolate Raspberry Star.October 2022: Lindt & Sprungli USA launched its first-ever 3D virtual store. Lindt's new online storefront allows consumers across the country to engage in the enchanting brand experience of a Lindt Chocolate store from the comfort of their homes or even on the go.September 2022: Mondelēz International Inc. expanded its Green & Black premium organic chocolate brand with the launch of a new range, Smooth, in North America.
9. What pricing options are available for accessing the report?
Pricing options include single-user, multi-user, and enterprise licenses priced at USD 3800, USD 4500, and USD 5800 respectively.
10. Is the market size provided in terms of value or volume?
The market size is provided in terms of value, measured in billion and volume, measured in Tons.
11. Are there any specific market keywords associated with the report?
Yes, the market keyword associated with the report is "USA Organic Chocolate Industry," which aids in identifying and referencing the specific market segment covered.
12. How do I determine which pricing option suits my needs best?
The pricing options vary based on user requirements and access needs. Individual users may opt for single-user licenses, while businesses requiring broader access may choose multi-user or enterprise licenses for cost-effective access to the report.
13. Are there any additional resources or data provided in the USA Organic Chocolate Industry report?
While the report offers comprehensive insights, it's advisable to review the specific contents or supplementary materials provided to ascertain if additional resources or data are available.
14. How can I stay updated on further developments or reports in the USA Organic Chocolate Industry?
To stay informed about further developments, trends, and reports in the USA Organic Chocolate Industry, consider subscribing to industry newsletters, following relevant companies and organizations, or regularly checking reputable industry news sources and publications.
Methodology
Step 1 - Identification of Relevant Samples Size from Population Database


Step 2 - Approaches for Defining Global Market Size (Value, Volume* & Price*)

Note*: In applicable scenarios
Step 3 - Data Sources
Primary Research
- Web Analytics
- Survey Reports
- Research Institute
- Latest Research Reports
- Opinion Leaders
Secondary Research
- Annual Reports
- White Paper
- Latest Press Release
- Industry Association
- Paid Database
- Investor Presentations

Step 4 - Data Triangulation
Involves using different sources of information in order to increase the validity of a study
These sources are likely to be stakeholders in a program - participants, other researchers, program staff, other community members, and so on.
Then we put all data in single framework & apply various statistical tools to find out the dynamic on the market.
During the analysis stage, feedback from the stakeholder groups would be compared to determine areas of agreement as well as areas of divergence