

Key Insights
The US cookie market, a significant segment of the broader biscuit and cookie industry, is projected to experience steady growth over the forecast period (2025-2033). With a 2025 market size estimated at $10 billion (based on a global market size of $12.48 billion and considering the significant contribution of the US market), the sector benefits from consistently high consumer demand. Key drivers include increasing disposable incomes, evolving consumer preferences towards convenient snacking options, and the continued innovation in flavors, ingredients, and product formats (e.g., healthier options like gluten-free and organic cookies). The market is segmented by type (filled, chocolate-coated, cookies, sandwich, plain, and others) and category (conventional and better-for-you), reflecting the diverse consumer preferences and the growing health-consciousness among consumers. Major players like Mondelez International, General Mills, and Grupo Bimbo are driving competition and shaping market trends through aggressive marketing and product diversification. The distribution channels encompass hypermarkets/supermarkets, convenience stores, specialist retailers, and increasingly, online retailers, reflecting the omnichannel nature of modern retail. The "better-for-you" segment is anticipated to exhibit robust growth, driven by the increasing awareness of health and wellness, leading to higher demand for options with reduced sugar, fat, and added preservatives.
The competitive landscape is intensely dynamic, with both established multinational corporations and regional players vying for market share. This competition stimulates product innovation and fosters price competitiveness, benefiting consumers. The North American region, especially the US, is a major market driver, followed by other regions. However, factors like fluctuating raw material prices and changing consumer preferences could pose challenges. The industry's success depends on consistently meeting evolving consumer demands for taste, convenience, health benefits, and value. Continued innovation in product offerings and effective marketing strategies are crucial for sustained growth in this highly competitive market. Furthermore, successful companies are leveraging digital marketing and e-commerce channels to reach a broader customer base.

US Cookie Industry Market Report: 2019-2033
This comprehensive report provides an in-depth analysis of the US cookie industry, covering market dynamics, growth trends, key players, and future opportunities. With a focus on both parent (packaged food) and child (cookie) markets, this report is essential for industry professionals, investors, and anyone seeking to understand this dynamic sector. The study period spans 2019-2033, with a base year of 2025 and a forecast period of 2025-2033.
US Cookie Industry Market Dynamics & Structure
The US cookie market, a significant segment within the broader packaged food industry, exhibits a moderately consolidated structure. Major players like Mondelez International Inc and Grupo Bimbo hold substantial market share, alongside regional and specialty brands. Technological advancements in baking processes, ingredient sourcing, and packaging are driving efficiency and product innovation. Regulatory frameworks surrounding labeling, ingredients, and food safety significantly influence industry practices. Competitive substitutes include other sweet baked goods and snacks, prompting ongoing innovation to maintain market position. End-user demographics, particularly shifting preferences towards healthier options and convenience, are shaping product development and distribution strategies. M&A activity remains significant, with an estimated xx number of deals occurring between 2019-2024, indicating consolidation and expansion efforts.
- Market Concentration: Highly concentrated with top 5 players holding xx% market share (2024).
- Technological Innovation: Automation in production, sustainable packaging solutions are key drivers.
- Regulatory Landscape: FDA regulations on labeling and ingredients impact product formulations.
- Competitive Substitutes: Cakes, pastries, and other confectionery items pose significant competition.
- End-User Demographics: Growing demand for healthier, convenient, and premium cookies.
- M&A Activity: xx M&A deals (2019-2024), indicating market consolidation.
US Cookie Industry Growth Trends & Insights
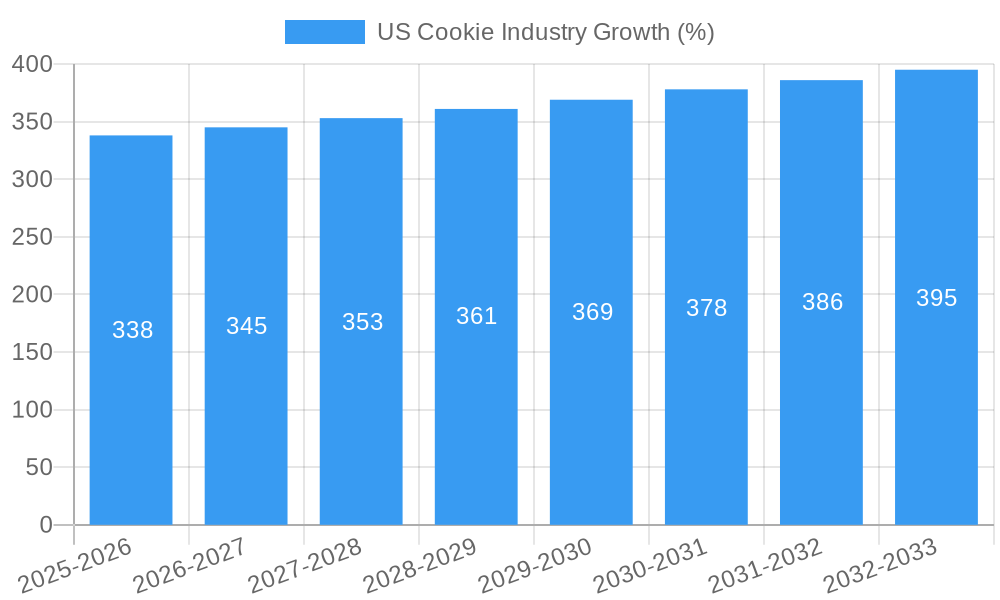
The US cookie market demonstrates robust growth, driven by increasing consumer demand and product diversification. The market size, valued at xx million units in 2024, is projected to reach xx million units by 2033, exhibiting a CAGR of xx% during the forecast period. This growth is fueled by factors such as rising disposable incomes, changing consumer preferences (e.g., premiumization, healthier options), and the proliferation of online retail channels. Technological disruptions, such as the adoption of automated baking systems and improved packaging technologies, enhance production efficiency and product shelf life. Consumer behavior shifts towards convenience and on-the-go snacking contribute to the popularity of individually packaged cookies and smaller pack sizes.
Dominant Regions, Countries, or Segments in US Cookie Industry
The Northeast and West Coast regions represent the dominant segments within the US cookie market, exhibiting higher consumption rates and stronger retail presence. Within product types, cookies (xx million units in 2024) remain the largest segment, followed by filled biscuits (xx million units in 2024). The "better-for-you" category is demonstrating the fastest growth (xx% CAGR), driven by increased health consciousness among consumers. Hypermarkets/supermarkets (xx% market share in 2024) constitute the leading distribution channel, followed by convenience stores.
- Key Drivers: Growing urban populations, high disposable incomes in key regions, strong retail infrastructure.
- Dominance Factors: Established brand presence, efficient distribution networks, effective marketing strategies.
- Growth Potential: Expansion into rural markets, untapped segments (e.g., vegan, organic cookies).
US Cookie Industry Product Landscape
The US cookie market showcases a wide array of products, from traditional chocolate chip cookies to innovative healthier options. Product innovations include gluten-free, vegan, and organic cookies catering to evolving consumer preferences. Performance metrics focus on taste, texture, shelf life, and nutritional content. Unique selling propositions center on health benefits, premium ingredients, and unique flavor profiles. Technological advancements in baking processes, such as precision fermentation and 3D printing, are continuously enhancing product quality and efficiency.
Key Drivers, Barriers & Challenges in US Cookie Industry
Key Drivers: Rising disposable incomes, increasing demand for convenient snacks, and the growth of online retail channels. Technological advancements in production and packaging also contribute to growth.
Challenges: Fluctuating raw material prices, intense competition, and evolving consumer preferences present significant challenges. Supply chain disruptions and regulatory changes can also impact market dynamics. Increased competition from private labels and the rising costs of raw materials exert pressure on profit margins.
Emerging Opportunities in US Cookie Industry
Emerging opportunities lie in expanding into untapped markets, such as rural areas and underserved demographics. The growing demand for healthier, organic, and functional cookies presents significant potential. Innovative product development, such as personalized cookies and customized flavors, can cater to individual preferences. Further expansion into online channels and direct-to-consumer models can increase market reach and brand visibility.
Growth Accelerators in the US Cookie Industry
Strategic partnerships, collaborations with ingredient suppliers, and efficient supply chain management are critical growth catalysts. Technological breakthroughs in baking techniques and packaging technologies can enhance product quality and efficiency. Market expansion strategies, including new product launches and internationalization, can drive revenue growth. Investing in sustainable and eco-friendly practices aligns with growing consumer preferences.
Key Players Shaping the US Cookie Industry Market
- Grupo Bimbo
- Meiji Holdings Co Ltd
- General Mills Inc
- PepsiCo Inc
- McKee Foods Corporation
- Ferrero Group
- Hostess Brands LLC
- Girl Scouts of the USA
- Mondelez International Inc
- Campbell Soup Company
Notable Milestones in US Cookie Industry Sector
- June 2022: Rich's and Nestlé launch a new bake-in-store cookie range, introducing three coffee-shop-quality cookies. This collaboration highlights the trend towards premiumization.
- June 2022: Crumbl Cookies expands its retail presence, opening a new store in Oaks, Pennsylvania. This reflects the increasing consumer demand for specialized cookie offerings.
- July 2022: The Greater Goods Snacking Company introduces a new line of better-for-you cookies, signaling the growing market for healthier snack options.
In-Depth US Cookie Industry Market Outlook
The US cookie market is poised for continued growth, fueled by innovation, changing consumer preferences, and robust economic conditions. Strategic acquisitions, product diversification, and expansion into emerging market segments will play crucial roles in shaping the future landscape. Opportunities abound for companies that effectively address consumer demand for healthier, convenient, and premium cookie options. The focus on sustainability and ethical sourcing will further influence industry practices.
US Cookie Industry Segmentation
-
1. Type
- 1.1. Filled Biscuits
- 1.2. Chocolate-coated Biscuits
- 1.3. Cookies
- 1.4. Sandwich Biscuits
- 1.5. Plain Biscuits
- 1.6. Other Types
-
2. Category
- 2.1. Conventional
-
2.2. Better for You
- 2.2.1. Low Calorie
- 2.2.2. Cholesterol-free
- 2.2.3. Gluten-free
- 2.2.4. Organic
- 2.2.5. Other Categories
-
3. Distribution Channel
- 3.1. Hypermarkets/Supermarkets
- 3.2. Convenience Stores
- 3.3. Specialist Retailers
- 3.4. Online Retailers
- 3.5. Other Distribution Channels
US Cookie Industry Segmentation By Geography
-
1. North America
- 1.1. United States
- 1.2. Canada
- 1.3. Mexico
-
2. South America
- 2.1. Brazil
- 2.2. Argentina
- 2.3. Rest of South America
-
3. Europe
- 3.1. United Kingdom
- 3.2. Germany
- 3.3. France
- 3.4. Italy
- 3.5. Spain
- 3.6. Russia
- 3.7. Benelux
- 3.8. Nordics
- 3.9. Rest of Europe
-
4. Middle East & Africa
- 4.1. Turkey
- 4.2. Israel
- 4.3. GCC
- 4.4. North Africa
- 4.5. South Africa
- 4.6. Rest of Middle East & Africa
-
5. Asia Pacific
- 5.1. China
- 5.2. India
- 5.3. Japan
- 5.4. South Korea
- 5.5. ASEAN
- 5.6. Oceania
- 5.7. Rest of Asia Pacific

US Cookie Industry REPORT HIGHLIGHTS
| Aspects | Details |
|---|---|
| Study Period | 2019-2033 |
| Base Year | 2024 |
| Estimated Year | 2025 |
| Forecast Period | 2025-2033 |
| Historical Period | 2019-2024 |
| Growth Rate | CAGR of 3.38% from 2019-2033 |
| Segmentation |
|
Table of Contents
- 1. Introduction
- 1.1. Research Scope
- 1.2. Market Segmentation
- 1.3. Research Methodology
- 1.4. Definitions and Assumptions
- 2. Executive Summary
- 2.1. Introduction
- 3. Market Dynamics
- 3.1. Introduction
- 3.2. Market Drivers
- 3.2.1. Innovation in Vanillin Synthesis; Diverse Functionality of Vanillin In End-use Industries
- 3.3. Market Restrains
- 3.3.1. Supply Chain Variability Impacting Vanilla Bean Availability For Flavor Production
- 3.4. Market Trends
- 3.4.1. Increasing Demand for Innovative and Creative Cookies
- 4. Market Factor Analysis
- 4.1. Porters Five Forces
- 4.2. Supply/Value Chain
- 4.3. PESTEL analysis
- 4.4. Market Entropy
- 4.5. Patent/Trademark Analysis
- 5. Global US Cookie Industry Analysis, Insights and Forecast, 2019-2031
- 5.1. Market Analysis, Insights and Forecast - by Type
- 5.1.1. Filled Biscuits
- 5.1.2. Chocolate-coated Biscuits
- 5.1.3. Cookies
- 5.1.4. Sandwich Biscuits
- 5.1.5. Plain Biscuits
- 5.1.6. Other Types
- 5.2. Market Analysis, Insights and Forecast - by Category
- 5.2.1. Conventional
- 5.2.2. Better for You
- 5.2.2.1. Low Calorie
- 5.2.2.2. Cholesterol-free
- 5.2.2.3. Gluten-free
- 5.2.2.4. Organic
- 5.2.2.5. Other Categories
- 5.3. Market Analysis, Insights and Forecast - by Distribution Channel
- 5.3.1. Hypermarkets/Supermarkets
- 5.3.2. Convenience Stores
- 5.3.3. Specialist Retailers
- 5.3.4. Online Retailers
- 5.3.5. Other Distribution Channels
- 5.4. Market Analysis, Insights and Forecast - by Region
- 5.4.1. North America
- 5.4.2. South America
- 5.4.3. Europe
- 5.4.4. Middle East & Africa
- 5.4.5. Asia Pacific
- 5.1. Market Analysis, Insights and Forecast - by Type
- 6. North America US Cookie Industry Analysis, Insights and Forecast, 2019-2031
- 6.1. Market Analysis, Insights and Forecast - by Type
- 6.1.1. Filled Biscuits
- 6.1.2. Chocolate-coated Biscuits
- 6.1.3. Cookies
- 6.1.4. Sandwich Biscuits
- 6.1.5. Plain Biscuits
- 6.1.6. Other Types
- 6.2. Market Analysis, Insights and Forecast - by Category
- 6.2.1. Conventional
- 6.2.2. Better for You
- 6.2.2.1. Low Calorie
- 6.2.2.2. Cholesterol-free
- 6.2.2.3. Gluten-free
- 6.2.2.4. Organic
- 6.2.2.5. Other Categories
- 6.3. Market Analysis, Insights and Forecast - by Distribution Channel
- 6.3.1. Hypermarkets/Supermarkets
- 6.3.2. Convenience Stores
- 6.3.3. Specialist Retailers
- 6.3.4. Online Retailers
- 6.3.5. Other Distribution Channels
- 6.1. Market Analysis, Insights and Forecast - by Type
- 7. South America US Cookie Industry Analysis, Insights and Forecast, 2019-2031
- 7.1. Market Analysis, Insights and Forecast - by Type
- 7.1.1. Filled Biscuits
- 7.1.2. Chocolate-coated Biscuits
- 7.1.3. Cookies
- 7.1.4. Sandwich Biscuits
- 7.1.5. Plain Biscuits
- 7.1.6. Other Types
- 7.2. Market Analysis, Insights and Forecast - by Category
- 7.2.1. Conventional
- 7.2.2. Better for You
- 7.2.2.1. Low Calorie
- 7.2.2.2. Cholesterol-free
- 7.2.2.3. Gluten-free
- 7.2.2.4. Organic
- 7.2.2.5. Other Categories
- 7.3. Market Analysis, Insights and Forecast - by Distribution Channel
- 7.3.1. Hypermarkets/Supermarkets
- 7.3.2. Convenience Stores
- 7.3.3. Specialist Retailers
- 7.3.4. Online Retailers
- 7.3.5. Other Distribution Channels
- 7.1. Market Analysis, Insights and Forecast - by Type
- 8. Europe US Cookie Industry Analysis, Insights and Forecast, 2019-2031
- 8.1. Market Analysis, Insights and Forecast - by Type
- 8.1.1. Filled Biscuits
- 8.1.2. Chocolate-coated Biscuits
- 8.1.3. Cookies
- 8.1.4. Sandwich Biscuits
- 8.1.5. Plain Biscuits
- 8.1.6. Other Types
- 8.2. Market Analysis, Insights and Forecast - by Category
- 8.2.1. Conventional
- 8.2.2. Better for You
- 8.2.2.1. Low Calorie
- 8.2.2.2. Cholesterol-free
- 8.2.2.3. Gluten-free
- 8.2.2.4. Organic
- 8.2.2.5. Other Categories
- 8.3. Market Analysis, Insights and Forecast - by Distribution Channel
- 8.3.1. Hypermarkets/Supermarkets
- 8.3.2. Convenience Stores
- 8.3.3. Specialist Retailers
- 8.3.4. Online Retailers
- 8.3.5. Other Distribution Channels
- 8.1. Market Analysis, Insights and Forecast - by Type
- 9. Middle East & Africa US Cookie Industry Analysis, Insights and Forecast, 2019-2031
- 9.1. Market Analysis, Insights and Forecast - by Type
- 9.1.1. Filled Biscuits
- 9.1.2. Chocolate-coated Biscuits
- 9.1.3. Cookies
- 9.1.4. Sandwich Biscuits
- 9.1.5. Plain Biscuits
- 9.1.6. Other Types
- 9.2. Market Analysis, Insights and Forecast - by Category
- 9.2.1. Conventional
- 9.2.2. Better for You
- 9.2.2.1. Low Calorie
- 9.2.2.2. Cholesterol-free
- 9.2.2.3. Gluten-free
- 9.2.2.4. Organic
- 9.2.2.5. Other Categories
- 9.3. Market Analysis, Insights and Forecast - by Distribution Channel
- 9.3.1. Hypermarkets/Supermarkets
- 9.3.2. Convenience Stores
- 9.3.3. Specialist Retailers
- 9.3.4. Online Retailers
- 9.3.5. Other Distribution Channels
- 9.1. Market Analysis, Insights and Forecast - by Type
- 10. Asia Pacific US Cookie Industry Analysis, Insights and Forecast, 2019-2031
- 10.1. Market Analysis, Insights and Forecast - by Type
- 10.1.1. Filled Biscuits
- 10.1.2. Chocolate-coated Biscuits
- 10.1.3. Cookies
- 10.1.4. Sandwich Biscuits
- 10.1.5. Plain Biscuits
- 10.1.6. Other Types
- 10.2. Market Analysis, Insights and Forecast - by Category
- 10.2.1. Conventional
- 10.2.2. Better for You
- 10.2.2.1. Low Calorie
- 10.2.2.2. Cholesterol-free
- 10.2.2.3. Gluten-free
- 10.2.2.4. Organic
- 10.2.2.5. Other Categories
- 10.3. Market Analysis, Insights and Forecast - by Distribution Channel
- 10.3.1. Hypermarkets/Supermarkets
- 10.3.2. Convenience Stores
- 10.3.3. Specialist Retailers
- 10.3.4. Online Retailers
- 10.3.5. Other Distribution Channels
- 10.1. Market Analysis, Insights and Forecast - by Type
- 11. North America US Cookie Industry Analysis, Insights and Forecast, 2019-2031
- 11.1. Market Analysis, Insights and Forecast - By Country/Sub-region
- 11.1.1 United States
- 11.1.2 Canada
- 11.1.3 Mexico
- 12. South America US Cookie Industry Analysis, Insights and Forecast, 2019-2031
- 12.1. Market Analysis, Insights and Forecast - By Country/Sub-region
- 12.1.1 Brazil
- 12.1.2 Argentina
- 12.1.3 Rest of South America
- 13. Competitive Analysis
- 13.1. Global Market Share Analysis 2024
- 13.2. Company Profiles
- 13.2.1 Grupo Bimbo
- 13.2.1.1. Overview
- 13.2.1.2. Products
- 13.2.1.3. SWOT Analysis
- 13.2.1.4. Recent Developments
- 13.2.1.5. Financials (Based on Availability)
- 13.2.2 Meiji Holdings Co Ltd
- 13.2.2.1. Overview
- 13.2.2.2. Products
- 13.2.2.3. SWOT Analysis
- 13.2.2.4. Recent Developments
- 13.2.2.5. Financials (Based on Availability)
- 13.2.3 General Mills Inc
- 13.2.3.1. Overview
- 13.2.3.2. Products
- 13.2.3.3. SWOT Analysis
- 13.2.3.4. Recent Developments
- 13.2.3.5. Financials (Based on Availability)
- 13.2.4 PepsiCo Inc
- 13.2.4.1. Overview
- 13.2.4.2. Products
- 13.2.4.3. SWOT Analysis
- 13.2.4.4. Recent Developments
- 13.2.4.5. Financials (Based on Availability)
- 13.2.5 Mckee Foods Corporation
- 13.2.5.1. Overview
- 13.2.5.2. Products
- 13.2.5.3. SWOT Analysis
- 13.2.5.4. Recent Developments
- 13.2.5.5. Financials (Based on Availability)
- 13.2.6 Ferrero Group
- 13.2.6.1. Overview
- 13.2.6.2. Products
- 13.2.6.3. SWOT Analysis
- 13.2.6.4. Recent Developments
- 13.2.6.5. Financials (Based on Availability)
- 13.2.7 Hostess Brands LLC*List Not Exhaustive
- 13.2.7.1. Overview
- 13.2.7.2. Products
- 13.2.7.3. SWOT Analysis
- 13.2.7.4. Recent Developments
- 13.2.7.5. Financials (Based on Availability)
- 13.2.8 Girl Scouts of the USA
- 13.2.8.1. Overview
- 13.2.8.2. Products
- 13.2.8.3. SWOT Analysis
- 13.2.8.4. Recent Developments
- 13.2.8.5. Financials (Based on Availability)
- 13.2.9 Mondelez International Inc
- 13.2.9.1. Overview
- 13.2.9.2. Products
- 13.2.9.3. SWOT Analysis
- 13.2.9.4. Recent Developments
- 13.2.9.5. Financials (Based on Availability)
- 13.2.10 Campbell Soup Company
- 13.2.10.1. Overview
- 13.2.10.2. Products
- 13.2.10.3. SWOT Analysis
- 13.2.10.4. Recent Developments
- 13.2.10.5. Financials (Based on Availability)
- 13.2.1 Grupo Bimbo
List of Figures
- Figure 1: Global US Cookie Industry Revenue Breakdown (Million, %) by Region 2024 & 2032
- Figure 2: North America US Cookie Industry Revenue (Million), by Country 2024 & 2032
- Figure 3: North America US Cookie Industry Revenue Share (%), by Country 2024 & 2032
- Figure 4: South America US Cookie Industry Revenue (Million), by Country 2024 & 2032
- Figure 5: South America US Cookie Industry Revenue Share (%), by Country 2024 & 2032
- Figure 6: North America US Cookie Industry Revenue (Million), by Type 2024 & 2032
- Figure 7: North America US Cookie Industry Revenue Share (%), by Type 2024 & 2032
- Figure 8: North America US Cookie Industry Revenue (Million), by Category 2024 & 2032
- Figure 9: North America US Cookie Industry Revenue Share (%), by Category 2024 & 2032
- Figure 10: North America US Cookie Industry Revenue (Million), by Distribution Channel 2024 & 2032
- Figure 11: North America US Cookie Industry Revenue Share (%), by Distribution Channel 2024 & 2032
- Figure 12: North America US Cookie Industry Revenue (Million), by Country 2024 & 2032
- Figure 13: North America US Cookie Industry Revenue Share (%), by Country 2024 & 2032
- Figure 14: South America US Cookie Industry Revenue (Million), by Type 2024 & 2032
- Figure 15: South America US Cookie Industry Revenue Share (%), by Type 2024 & 2032
- Figure 16: South America US Cookie Industry Revenue (Million), by Category 2024 & 2032
- Figure 17: South America US Cookie Industry Revenue Share (%), by Category 2024 & 2032
- Figure 18: South America US Cookie Industry Revenue (Million), by Distribution Channel 2024 & 2032
- Figure 19: South America US Cookie Industry Revenue Share (%), by Distribution Channel 2024 & 2032
- Figure 20: South America US Cookie Industry Revenue (Million), by Country 2024 & 2032
- Figure 21: South America US Cookie Industry Revenue Share (%), by Country 2024 & 2032
- Figure 22: Europe US Cookie Industry Revenue (Million), by Type 2024 & 2032
- Figure 23: Europe US Cookie Industry Revenue Share (%), by Type 2024 & 2032
- Figure 24: Europe US Cookie Industry Revenue (Million), by Category 2024 & 2032
- Figure 25: Europe US Cookie Industry Revenue Share (%), by Category 2024 & 2032
- Figure 26: Europe US Cookie Industry Revenue (Million), by Distribution Channel 2024 & 2032
- Figure 27: Europe US Cookie Industry Revenue Share (%), by Distribution Channel 2024 & 2032
- Figure 28: Europe US Cookie Industry Revenue (Million), by Country 2024 & 2032
- Figure 29: Europe US Cookie Industry Revenue Share (%), by Country 2024 & 2032
- Figure 30: Middle East & Africa US Cookie Industry Revenue (Million), by Type 2024 & 2032
- Figure 31: Middle East & Africa US Cookie Industry Revenue Share (%), by Type 2024 & 2032
- Figure 32: Middle East & Africa US Cookie Industry Revenue (Million), by Category 2024 & 2032
- Figure 33: Middle East & Africa US Cookie Industry Revenue Share (%), by Category 2024 & 2032
- Figure 34: Middle East & Africa US Cookie Industry Revenue (Million), by Distribution Channel 2024 & 2032
- Figure 35: Middle East & Africa US Cookie Industry Revenue Share (%), by Distribution Channel 2024 & 2032
- Figure 36: Middle East & Africa US Cookie Industry Revenue (Million), by Country 2024 & 2032
- Figure 37: Middle East & Africa US Cookie Industry Revenue Share (%), by Country 2024 & 2032
- Figure 38: Asia Pacific US Cookie Industry Revenue (Million), by Type 2024 & 2032
- Figure 39: Asia Pacific US Cookie Industry Revenue Share (%), by Type 2024 & 2032
- Figure 40: Asia Pacific US Cookie Industry Revenue (Million), by Category 2024 & 2032
- Figure 41: Asia Pacific US Cookie Industry Revenue Share (%), by Category 2024 & 2032
- Figure 42: Asia Pacific US Cookie Industry Revenue (Million), by Distribution Channel 2024 & 2032
- Figure 43: Asia Pacific US Cookie Industry Revenue Share (%), by Distribution Channel 2024 & 2032
- Figure 44: Asia Pacific US Cookie Industry Revenue (Million), by Country 2024 & 2032
- Figure 45: Asia Pacific US Cookie Industry Revenue Share (%), by Country 2024 & 2032
List of Tables
- Table 1: Global US Cookie Industry Revenue Million Forecast, by Region 2019 & 2032
- Table 2: Global US Cookie Industry Revenue Million Forecast, by Type 2019 & 2032
- Table 3: Global US Cookie Industry Revenue Million Forecast, by Category 2019 & 2032
- Table 4: Global US Cookie Industry Revenue Million Forecast, by Distribution Channel 2019 & 2032
- Table 5: Global US Cookie Industry Revenue Million Forecast, by Region 2019 & 2032
- Table 6: Global US Cookie Industry Revenue Million Forecast, by Country 2019 & 2032
- Table 7: United States US Cookie Industry Revenue (Million) Forecast, by Application 2019 & 2032
- Table 8: Canada US Cookie Industry Revenue (Million) Forecast, by Application 2019 & 2032
- Table 9: Mexico US Cookie Industry Revenue (Million) Forecast, by Application 2019 & 2032
- Table 10: Global US Cookie Industry Revenue Million Forecast, by Country 2019 & 2032
- Table 11: Brazil US Cookie Industry Revenue (Million) Forecast, by Application 2019 & 2032
- Table 12: Argentina US Cookie Industry Revenue (Million) Forecast, by Application 2019 & 2032
- Table 13: Rest of South America US Cookie Industry Revenue (Million) Forecast, by Application 2019 & 2032
- Table 14: Global US Cookie Industry Revenue Million Forecast, by Type 2019 & 2032
- Table 15: Global US Cookie Industry Revenue Million Forecast, by Category 2019 & 2032
- Table 16: Global US Cookie Industry Revenue Million Forecast, by Distribution Channel 2019 & 2032
- Table 17: Global US Cookie Industry Revenue Million Forecast, by Country 2019 & 2032
- Table 18: United States US Cookie Industry Revenue (Million) Forecast, by Application 2019 & 2032
- Table 19: Canada US Cookie Industry Revenue (Million) Forecast, by Application 2019 & 2032
- Table 20: Mexico US Cookie Industry Revenue (Million) Forecast, by Application 2019 & 2032
- Table 21: Global US Cookie Industry Revenue Million Forecast, by Type 2019 & 2032
- Table 22: Global US Cookie Industry Revenue Million Forecast, by Category 2019 & 2032
- Table 23: Global US Cookie Industry Revenue Million Forecast, by Distribution Channel 2019 & 2032
- Table 24: Global US Cookie Industry Revenue Million Forecast, by Country 2019 & 2032
- Table 25: Brazil US Cookie Industry Revenue (Million) Forecast, by Application 2019 & 2032
- Table 26: Argentina US Cookie Industry Revenue (Million) Forecast, by Application 2019 & 2032
- Table 27: Rest of South America US Cookie Industry Revenue (Million) Forecast, by Application 2019 & 2032
- Table 28: Global US Cookie Industry Revenue Million Forecast, by Type 2019 & 2032
- Table 29: Global US Cookie Industry Revenue Million Forecast, by Category 2019 & 2032
- Table 30: Global US Cookie Industry Revenue Million Forecast, by Distribution Channel 2019 & 2032
- Table 31: Global US Cookie Industry Revenue Million Forecast, by Country 2019 & 2032
- Table 32: United Kingdom US Cookie Industry Revenue (Million) Forecast, by Application 2019 & 2032
- Table 33: Germany US Cookie Industry Revenue (Million) Forecast, by Application 2019 & 2032
- Table 34: France US Cookie Industry Revenue (Million) Forecast, by Application 2019 & 2032
- Table 35: Italy US Cookie Industry Revenue (Million) Forecast, by Application 2019 & 2032
- Table 36: Spain US Cookie Industry Revenue (Million) Forecast, by Application 2019 & 2032
- Table 37: Russia US Cookie Industry Revenue (Million) Forecast, by Application 2019 & 2032
- Table 38: Benelux US Cookie Industry Revenue (Million) Forecast, by Application 2019 & 2032
- Table 39: Nordics US Cookie Industry Revenue (Million) Forecast, by Application 2019 & 2032
- Table 40: Rest of Europe US Cookie Industry Revenue (Million) Forecast, by Application 2019 & 2032
- Table 41: Global US Cookie Industry Revenue Million Forecast, by Type 2019 & 2032
- Table 42: Global US Cookie Industry Revenue Million Forecast, by Category 2019 & 2032
- Table 43: Global US Cookie Industry Revenue Million Forecast, by Distribution Channel 2019 & 2032
- Table 44: Global US Cookie Industry Revenue Million Forecast, by Country 2019 & 2032
- Table 45: Turkey US Cookie Industry Revenue (Million) Forecast, by Application 2019 & 2032
- Table 46: Israel US Cookie Industry Revenue (Million) Forecast, by Application 2019 & 2032
- Table 47: GCC US Cookie Industry Revenue (Million) Forecast, by Application 2019 & 2032
- Table 48: North Africa US Cookie Industry Revenue (Million) Forecast, by Application 2019 & 2032
- Table 49: South Africa US Cookie Industry Revenue (Million) Forecast, by Application 2019 & 2032
- Table 50: Rest of Middle East & Africa US Cookie Industry Revenue (Million) Forecast, by Application 2019 & 2032
- Table 51: Global US Cookie Industry Revenue Million Forecast, by Type 2019 & 2032
- Table 52: Global US Cookie Industry Revenue Million Forecast, by Category 2019 & 2032
- Table 53: Global US Cookie Industry Revenue Million Forecast, by Distribution Channel 2019 & 2032
- Table 54: Global US Cookie Industry Revenue Million Forecast, by Country 2019 & 2032
- Table 55: China US Cookie Industry Revenue (Million) Forecast, by Application 2019 & 2032
- Table 56: India US Cookie Industry Revenue (Million) Forecast, by Application 2019 & 2032
- Table 57: Japan US Cookie Industry Revenue (Million) Forecast, by Application 2019 & 2032
- Table 58: South Korea US Cookie Industry Revenue (Million) Forecast, by Application 2019 & 2032
- Table 59: ASEAN US Cookie Industry Revenue (Million) Forecast, by Application 2019 & 2032
- Table 60: Oceania US Cookie Industry Revenue (Million) Forecast, by Application 2019 & 2032
- Table 61: Rest of Asia Pacific US Cookie Industry Revenue (Million) Forecast, by Application 2019 & 2032
Frequently Asked Questions
1. What is the projected Compound Annual Growth Rate (CAGR) of the US Cookie Industry?
The projected CAGR is approximately 3.38%.
2. Which companies are prominent players in the US Cookie Industry?
Key companies in the market include Grupo Bimbo, Meiji Holdings Co Ltd, General Mills Inc, PepsiCo Inc, Mckee Foods Corporation, Ferrero Group, Hostess Brands LLC*List Not Exhaustive, Girl Scouts of the USA, Mondelez International Inc, Campbell Soup Company.
3. What are the main segments of the US Cookie Industry?
The market segments include Type, Category, Distribution Channel.
4. Can you provide details about the market size?
The market size is estimated to be USD 12.48 Million as of 2022.
5. What are some drivers contributing to market growth?
Innovation in Vanillin Synthesis; Diverse Functionality of Vanillin In End-use Industries.
6. What are the notable trends driving market growth?
Increasing Demand for Innovative and Creative Cookies.
7. Are there any restraints impacting market growth?
Supply Chain Variability Impacting Vanilla Bean Availability For Flavor Production.
8. Can you provide examples of recent developments in the market?
JUL 2022: The Greater Goods Snacking Company, a snack brand focusing on better-for-you snacks, launched three different product lines in the United States, i.e., crackers, cookies, and biscotti.
9. What pricing options are available for accessing the report?
Pricing options include single-user, multi-user, and enterprise licenses priced at USD 3800, USD 4500, and USD 5800 respectively.
10. Is the market size provided in terms of value or volume?
The market size is provided in terms of value, measured in Million.
11. Are there any specific market keywords associated with the report?
Yes, the market keyword associated with the report is "US Cookie Industry," which aids in identifying and referencing the specific market segment covered.
12. How do I determine which pricing option suits my needs best?
The pricing options vary based on user requirements and access needs. Individual users may opt for single-user licenses, while businesses requiring broader access may choose multi-user or enterprise licenses for cost-effective access to the report.
13. Are there any additional resources or data provided in the US Cookie Industry report?
While the report offers comprehensive insights, it's advisable to review the specific contents or supplementary materials provided to ascertain if additional resources or data are available.
14. How can I stay updated on further developments or reports in the US Cookie Industry?
To stay informed about further developments, trends, and reports in the US Cookie Industry, consider subscribing to industry newsletters, following relevant companies and organizations, or regularly checking reputable industry news sources and publications.
Methodology
Step 1 - Identification of Relevant Samples Size from Population Database


Step 2 - Approaches for Defining Global Market Size (Value, Volume* & Price*)

Note*: In applicable scenarios
Step 3 - Data Sources
Primary Research
- Web Analytics
- Survey Reports
- Research Institute
- Latest Research Reports
- Opinion Leaders
Secondary Research
- Annual Reports
- White Paper
- Latest Press Release
- Industry Association
- Paid Database
- Investor Presentations

Step 4 - Data Triangulation
Involves using different sources of information in order to increase the validity of a study
These sources are likely to be stakeholders in a program - participants, other researchers, program staff, other community members, and so on.
Then we put all data in single framework & apply various statistical tools to find out the dynamic on the market.
During the analysis stage, feedback from the stakeholder groups would be compared to determine areas of agreement as well as areas of divergence
