

Key Insights
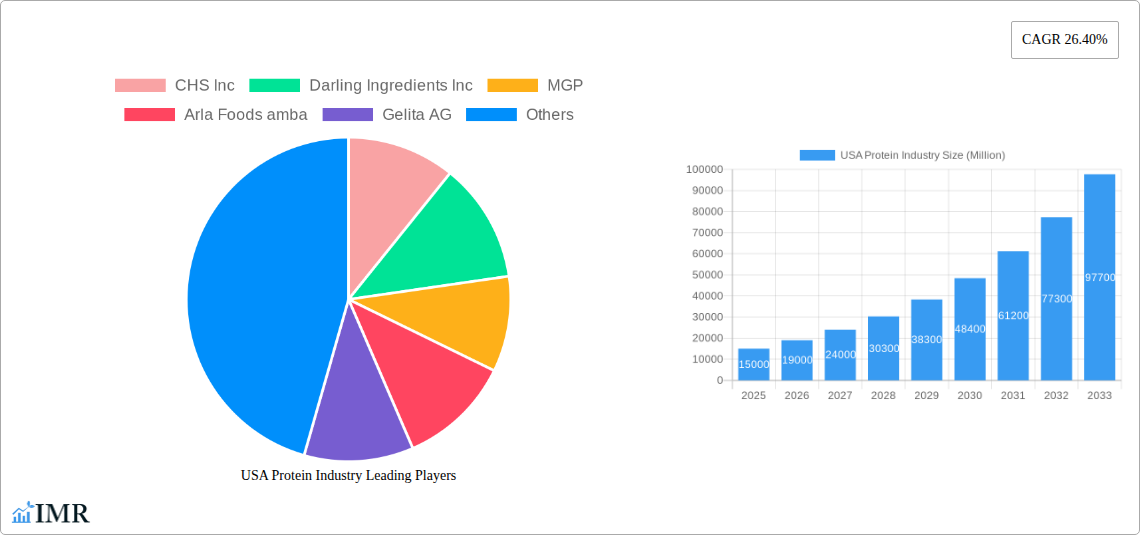
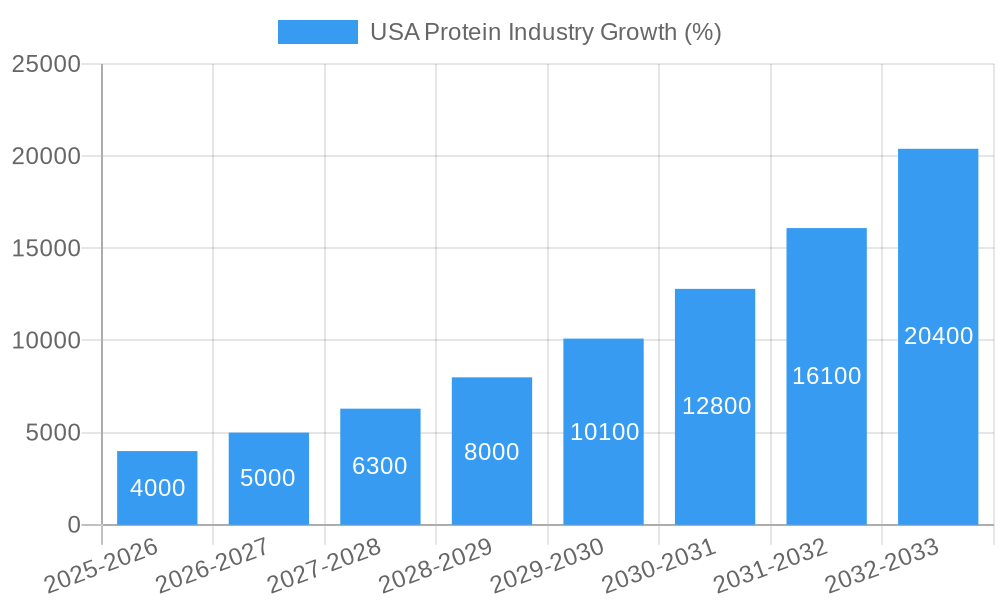
The US protein industry, currently experiencing robust growth, is projected to maintain a significant upward trajectory throughout the forecast period (2025-2033). A compound annual growth rate (CAGR) of 26.40% suggests a rapidly expanding market, driven by several key factors. Increasing consumer demand for protein-rich diets, fueled by health and wellness trends, is a primary driver. The rise of plant-based protein alternatives alongside continued demand for traditional animal-based sources contributes to this growth. Further fueling this expansion is the increasing integration of protein ingredients into diverse food and beverage products, as well as the growth in the animal feed sector. This necessitates efficient and sustainable protein sourcing and processing, creating opportunities for industry players across the supply chain.
However, the industry also faces challenges. Supply chain disruptions, fluctuating raw material prices, and increasing regulatory scrutiny regarding labeling and sustainability practices can constrain growth. Segmentation of the market reveals strong performance across animal and sport/performance nutrition segments. The animal feed segment, a large consumer of protein, will continue to drive substantial market demand. Key players in the US protein market—including CHS Inc., Darling Ingredients Inc., MGP, and others—are actively involved in innovation and consolidation to navigate these market dynamics and capitalize on growth opportunities. The strategic expansion into new product categories, such as functional foods and specialized protein formulations, further contributes to the overall dynamism of the market. Focus on sustainable sourcing and production methods will be crucial for long-term success within this evolving landscape.
USA Protein Industry Market Report: 2019-2033
This comprehensive report provides an in-depth analysis of the USA protein industry, encompassing market dynamics, growth trends, key players, and future outlook. The study period spans 2019-2033, with 2025 as the base and estimated year. This report is invaluable for industry professionals, investors, and strategists seeking to understand and capitalize on opportunities within this rapidly evolving market. Parent markets include the broader food and beverage industry and animal feed markets. Child markets include segments like sport/performance nutrition and specific protein sources (animal, plant-based).
USA Protein Industry Market Dynamics & Structure
The US protein industry is a dynamic and fragmented market characterized by both significant consolidation and emerging players. Market concentration is moderate, with a few large multinational corporations alongside numerous smaller regional and specialized producers. Technological innovation is a key driver, with advancements in extraction, processing, and formulation constantly shaping product offerings. Stringent regulatory frameworks concerning food safety and labeling impact the industry significantly. Competitive pressures are intense, fueled by the presence of both synthetic and natural protein substitutes. End-user demographics are shifting, with growing demand driven by health-conscious consumers and expanding animal feed applications. M&A activity has been robust in recent years, reflecting industry consolidation and the pursuit of scale and diversification.
- Market Concentration: Moderate, with top 5 players holding approximately xx% market share in 2025.
- Technological Innovation: Focus on sustainable sourcing, improved extraction techniques, and novel protein formulations.
- Regulatory Framework: Stringent FDA regulations on labeling, safety, and additives.
- Competitive Substitutes: Plant-based proteins, synthetic amino acid blends pose competitive pressures.
- End-User Demographics: Growing demand from health-conscious consumers and expanding animal feed market.
- M&A Activity: xx major deals recorded between 2019-2024, indicating industry consolidation.
USA Protein Industry Growth Trends & Insights
The US protein industry experienced substantial growth during the historical period (2019-2024), driven by rising consumer demand for protein-rich foods and the expanding animal feed market. The market size expanded from xx million units in 2019 to xx million units in 2024, registering a CAGR of xx%. This growth is projected to continue throughout the forecast period (2025-2033), with the market size expected to reach xx million units by 2033, driven by factors such as increasing health consciousness, rising disposable incomes, and technological advancements in protein production and formulation. The adoption rate of novel protein sources, like plant-based alternatives, is steadily increasing, albeit from a lower base than traditional animal-based proteins. Consumer behavior shifts towards convenience and functional foods further fuel market expansion.
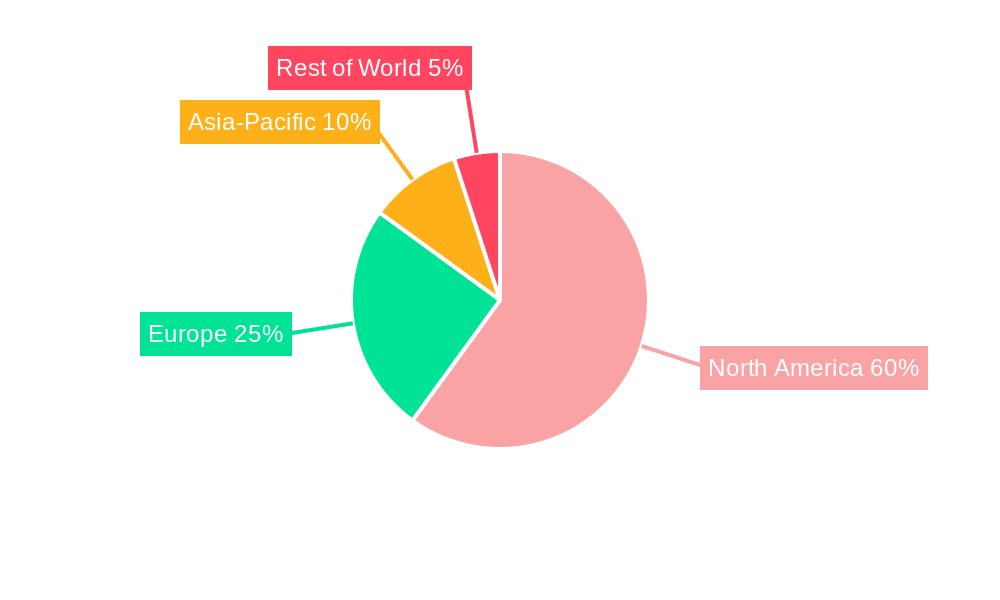
Dominant Regions, Countries, or Segments in USA Protein Industry
The Animal Feed segment dominates the US protein industry, accounting for approximately xx% of the total market in 2025. This dominance stems from the substantial size of the US livestock industry and its reliance on protein-rich feed ingredients. The Midwest region emerges as a key driver due to its concentrated agricultural production and robust animal feed manufacturing infrastructure. The Sport/Performance Nutrition segment also shows significant growth potential, fueled by increasing health and fitness awareness among consumers.
- Key Drivers (Animal Feed Segment): High livestock production, robust feed industry, government subsidies, and advancements in feed formulation.
- Key Drivers (Sport/Performance Nutrition): Growing health consciousness, rising disposable incomes, and increasing participation in fitness activities.
- Dominance Factors: High demand, established infrastructure, significant production capacity.
- Growth Potential: Continued expansion in both segments is anticipated, particularly with innovative product development.
USA Protein Industry Product Landscape
The US protein industry showcases a diverse product landscape, including whey protein, casein protein, soy protein, pea protein, and other plant-based alternatives. Innovations focus on improved digestibility, enhanced bioavailability, and functional properties, often incorporating ingredients like prebiotics and probiotics. Technological advancements in extraction and purification techniques lead to higher-quality proteins with improved flavor profiles. Unique selling propositions emphasize natural sourcing, sustainability, and tailored nutritional profiles catering to specific health goals.
Key Drivers, Barriers & Challenges in USA Protein Industry
Key Drivers: Growing consumer demand for protein-rich foods and functional ingredients, increasing health consciousness, expanding animal feed market, and technological advancements in protein production and processing. Government support for agricultural production also plays a crucial role.
Key Challenges: Fluctuations in raw material prices, supply chain disruptions, increasing regulatory scrutiny, and intense competition from both domestic and international players. Sustainability concerns related to animal protein production also present a challenge.
Emerging Opportunities in USA Protein Industry
Emerging opportunities reside in the increasing demand for plant-based protein alternatives, customized protein blends catering to specific dietary needs, and functional protein ingredients in food and beverage applications. Innovation in protein delivery systems, such as protein bars, ready-to-drink shakes, and functional powders, also presents growth potential. Further expansion into niche markets like personalized nutrition and sports nutrition could significantly boost market growth.
Growth Accelerators in the USA Protein Industry Industry
Technological breakthroughs in protein extraction and processing, sustainable farming practices, and the development of novel protein sources significantly accelerate long-term market growth. Strategic partnerships among ingredient suppliers, food manufacturers, and technology developers create synergistic growth opportunities. Expansion into untapped international markets and the adoption of personalized nutrition strategies will also serve as vital growth catalysts.
Key Players Shaping the USA Protein Industry Market
- CHS Inc
- Darling Ingredients Inc
- MGP
- Arla Foods amba
- Gelita AG
- AMCO Proteins
- International Flavors & Fragrances Inc
- Archer Daniels Midland Company
- Glanbia PLC
- Ajinomoto Co Inc
- Bunge Limited
- Roquette Frères
- Agropur Dairy Cooperative
- Kerry Group PLC
- Farbest-Tallman Foods Corporation
- Fonterra Co-operative Group Limited
- Ingredion Incorporated
- Corbion NV
- Südzucker Grou
Notable Milestones in USA Protein Industry Sector
- August 2022: Optimum Nutrition launched its Gold Standard Protein Shake, expanding the ready-to-drink protein market.
- June 2022: Fonterra JV launched Pro-Optima TM, a functional whey protein concentrate, through a joint venture, enhancing the functional protein ingredient market.
- August 2021: Darling Ingredients expanded its poultry conversion facility, increasing capacity for protein production.
In-Depth USA Protein Industry Market Outlook
The US protein industry is poised for continued growth, driven by sustained consumer demand, technological innovations, and strategic industry collaborations. The market's future potential lies in harnessing the growing interest in sustainable and plant-based proteins, coupled with personalized nutrition approaches. Companies that successfully integrate these trends into their strategies are well-positioned to capitalize on the significant opportunities within this dynamic market.
USA Protein Industry Segmentation
-
1. Source
-
1.1. Animal
-
1.1.1. By Protein Type
- 1.1.1.1. Casein and Caseinates
- 1.1.1.2. Collagen
- 1.1.1.3. Egg Protein
- 1.1.1.4. Gelatin
- 1.1.1.5. Insect Protein
- 1.1.1.6. Milk Protein
- 1.1.1.7. Whey Protein
- 1.1.1.8. Other Animal Protein
-
1.1.1. By Protein Type
-
1.2. Microbial
- 1.2.1. Algae Protein
- 1.2.2. Mycoprotein
-
1.3. Plant
- 1.3.1. Hemp Protein
- 1.3.2. Pea Protein
- 1.3.3. Potato Protein
- 1.3.4. Rice Protein
- 1.3.5. Soy Protein
- 1.3.6. Wheat Protein
- 1.3.7. Other Plant Protein
-
1.1. Animal
-
2. End User
- 2.1. Animal Feed
-
2.2. Food and Beverages
-
2.2.1. By Sub End User
- 2.2.1.1. Bakery
- 2.2.1.2. Breakfast Cereals
- 2.2.1.3. Condiments/Sauces
- 2.2.1.4. Confectionery
- 2.2.1.5. Dairy and Dairy Alternative Products
- 2.2.1.6. Meat/Poultry/Seafood and Meat Alternative Products
- 2.2.1.7. RTE/RTC Food Products
- 2.2.1.8. Snacks
-
2.2.1. By Sub End User
- 2.3. Personal Care and Cosmetics
-
2.4. Supplements
- 2.4.1. Baby Food and Infant Formula
- 2.4.2. Elderly Nutrition and Medical Nutrition
- 2.4.3. Sport/Performance Nutrition
USA Protein Industry Segmentation By Geography
-
1. North America
- 1.1. United States
- 1.2. Canada
- 1.3. Mexico
-
2. South America
- 2.1. Brazil
- 2.2. Argentina
- 2.3. Rest of South America
-
3. Europe
- 3.1. United Kingdom
- 3.2. Germany
- 3.3. France
- 3.4. Italy
- 3.5. Spain
- 3.6. Russia
- 3.7. Benelux
- 3.8. Nordics
- 3.9. Rest of Europe
-
4. Middle East & Africa
- 4.1. Turkey
- 4.2. Israel
- 4.3. GCC
- 4.4. North Africa
- 4.5. South Africa
- 4.6. Rest of Middle East & Africa
-
5. Asia Pacific
- 5.1. China
- 5.2. India
- 5.3. Japan
- 5.4. South Korea
- 5.5. ASEAN
- 5.6. Oceania
- 5.7. Rest of Asia Pacific
USA Protein Industry REPORT HIGHLIGHTS
| Aspects | Details |
|---|---|
| Study Period | 2019-2033 |
| Base Year | 2024 |
| Estimated Year | 2025 |
| Forecast Period | 2025-2033 |
| Historical Period | 2019-2024 |
| Growth Rate | CAGR of 26.40% from 2019-2033 |
| Segmentation |
|
Table of Contents
- 1. Introduction
- 1.1. Research Scope
- 1.2. Market Segmentation
- 1.3. Research Methodology
- 1.4. Definitions and Assumptions
- 2. Executive Summary
- 2.1. Introduction
- 3. Market Dynamics
- 3.1. Introduction
- 3.2. Market Drivers
- 3.2.1. Increasing Urbanization; Growing Disposable Income
- 3.3. Market Restrains
- 3.3.1. High-price and additional delivery charges
- 3.4. Market Trends
- 3.4.1. OTHER KEY INDUSTRY TRENDS COVERED IN THE REPORT
- 4. Market Factor Analysis
- 4.1. Porters Five Forces
- 4.2. Supply/Value Chain
- 4.3. PESTEL analysis
- 4.4. Market Entropy
- 4.5. Patent/Trademark Analysis
- 5. Global USA Protein Industry Analysis, Insights and Forecast, 2019-2031
- 5.1. Market Analysis, Insights and Forecast - by Source
- 5.1.1. Animal
- 5.1.1.1. By Protein Type
- 5.1.1.1.1. Casein and Caseinates
- 5.1.1.1.2. Collagen
- 5.1.1.1.3. Egg Protein
- 5.1.1.1.4. Gelatin
- 5.1.1.1.5. Insect Protein
- 5.1.1.1.6. Milk Protein
- 5.1.1.1.7. Whey Protein
- 5.1.1.1.8. Other Animal Protein
- 5.1.1.1. By Protein Type
- 5.1.2. Microbial
- 5.1.2.1. Algae Protein
- 5.1.2.2. Mycoprotein
- 5.1.3. Plant
- 5.1.3.1. Hemp Protein
- 5.1.3.2. Pea Protein
- 5.1.3.3. Potato Protein
- 5.1.3.4. Rice Protein
- 5.1.3.5. Soy Protein
- 5.1.3.6. Wheat Protein
- 5.1.3.7. Other Plant Protein
- 5.1.1. Animal
- 5.2. Market Analysis, Insights and Forecast - by End User
- 5.2.1. Animal Feed
- 5.2.2. Food and Beverages
- 5.2.2.1. By Sub End User
- 5.2.2.1.1. Bakery
- 5.2.2.1.2. Breakfast Cereals
- 5.2.2.1.3. Condiments/Sauces
- 5.2.2.1.4. Confectionery
- 5.2.2.1.5. Dairy and Dairy Alternative Products
- 5.2.2.1.6. Meat/Poultry/Seafood and Meat Alternative Products
- 5.2.2.1.7. RTE/RTC Food Products
- 5.2.2.1.8. Snacks
- 5.2.2.1. By Sub End User
- 5.2.3. Personal Care and Cosmetics
- 5.2.4. Supplements
- 5.2.4.1. Baby Food and Infant Formula
- 5.2.4.2. Elderly Nutrition and Medical Nutrition
- 5.2.4.3. Sport/Performance Nutrition
- 5.3. Market Analysis, Insights and Forecast - by Region
- 5.3.1. North America
- 5.3.2. South America
- 5.3.3. Europe
- 5.3.4. Middle East & Africa
- 5.3.5. Asia Pacific
- 5.1. Market Analysis, Insights and Forecast - by Source
- 6. North America USA Protein Industry Analysis, Insights and Forecast, 2019-2031
- 6.1. Market Analysis, Insights and Forecast - by Source
- 6.1.1. Animal
- 6.1.1.1. By Protein Type
- 6.1.1.1.1. Casein and Caseinates
- 6.1.1.1.2. Collagen
- 6.1.1.1.3. Egg Protein
- 6.1.1.1.4. Gelatin
- 6.1.1.1.5. Insect Protein
- 6.1.1.1.6. Milk Protein
- 6.1.1.1.7. Whey Protein
- 6.1.1.1.8. Other Animal Protein
- 6.1.1.1. By Protein Type
- 6.1.2. Microbial
- 6.1.2.1. Algae Protein
- 6.1.2.2. Mycoprotein
- 6.1.3. Plant
- 6.1.3.1. Hemp Protein
- 6.1.3.2. Pea Protein
- 6.1.3.3. Potato Protein
- 6.1.3.4. Rice Protein
- 6.1.3.5. Soy Protein
- 6.1.3.6. Wheat Protein
- 6.1.3.7. Other Plant Protein
- 6.1.1. Animal
- 6.2. Market Analysis, Insights and Forecast - by End User
- 6.2.1. Animal Feed
- 6.2.2. Food and Beverages
- 6.2.2.1. By Sub End User
- 6.2.2.1.1. Bakery
- 6.2.2.1.2. Breakfast Cereals
- 6.2.2.1.3. Condiments/Sauces
- 6.2.2.1.4. Confectionery
- 6.2.2.1.5. Dairy and Dairy Alternative Products
- 6.2.2.1.6. Meat/Poultry/Seafood and Meat Alternative Products
- 6.2.2.1.7. RTE/RTC Food Products
- 6.2.2.1.8. Snacks
- 6.2.2.1. By Sub End User
- 6.2.3. Personal Care and Cosmetics
- 6.2.4. Supplements
- 6.2.4.1. Baby Food and Infant Formula
- 6.2.4.2. Elderly Nutrition and Medical Nutrition
- 6.2.4.3. Sport/Performance Nutrition
- 6.1. Market Analysis, Insights and Forecast - by Source
- 7. South America USA Protein Industry Analysis, Insights and Forecast, 2019-2031
- 7.1. Market Analysis, Insights and Forecast - by Source
- 7.1.1. Animal
- 7.1.1.1. By Protein Type
- 7.1.1.1.1. Casein and Caseinates
- 7.1.1.1.2. Collagen
- 7.1.1.1.3. Egg Protein
- 7.1.1.1.4. Gelatin
- 7.1.1.1.5. Insect Protein
- 7.1.1.1.6. Milk Protein
- 7.1.1.1.7. Whey Protein
- 7.1.1.1.8. Other Animal Protein
- 7.1.1.1. By Protein Type
- 7.1.2. Microbial
- 7.1.2.1. Algae Protein
- 7.1.2.2. Mycoprotein
- 7.1.3. Plant
- 7.1.3.1. Hemp Protein
- 7.1.3.2. Pea Protein
- 7.1.3.3. Potato Protein
- 7.1.3.4. Rice Protein
- 7.1.3.5. Soy Protein
- 7.1.3.6. Wheat Protein
- 7.1.3.7. Other Plant Protein
- 7.1.1. Animal
- 7.2. Market Analysis, Insights and Forecast - by End User
- 7.2.1. Animal Feed
- 7.2.2. Food and Beverages
- 7.2.2.1. By Sub End User
- 7.2.2.1.1. Bakery
- 7.2.2.1.2. Breakfast Cereals
- 7.2.2.1.3. Condiments/Sauces
- 7.2.2.1.4. Confectionery
- 7.2.2.1.5. Dairy and Dairy Alternative Products
- 7.2.2.1.6. Meat/Poultry/Seafood and Meat Alternative Products
- 7.2.2.1.7. RTE/RTC Food Products
- 7.2.2.1.8. Snacks
- 7.2.2.1. By Sub End User
- 7.2.3. Personal Care and Cosmetics
- 7.2.4. Supplements
- 7.2.4.1. Baby Food and Infant Formula
- 7.2.4.2. Elderly Nutrition and Medical Nutrition
- 7.2.4.3. Sport/Performance Nutrition
- 7.1. Market Analysis, Insights and Forecast - by Source
- 8. Europe USA Protein Industry Analysis, Insights and Forecast, 2019-2031
- 8.1. Market Analysis, Insights and Forecast - by Source
- 8.1.1. Animal
- 8.1.1.1. By Protein Type
- 8.1.1.1.1. Casein and Caseinates
- 8.1.1.1.2. Collagen
- 8.1.1.1.3. Egg Protein
- 8.1.1.1.4. Gelatin
- 8.1.1.1.5. Insect Protein
- 8.1.1.1.6. Milk Protein
- 8.1.1.1.7. Whey Protein
- 8.1.1.1.8. Other Animal Protein
- 8.1.1.1. By Protein Type
- 8.1.2. Microbial
- 8.1.2.1. Algae Protein
- 8.1.2.2. Mycoprotein
- 8.1.3. Plant
- 8.1.3.1. Hemp Protein
- 8.1.3.2. Pea Protein
- 8.1.3.3. Potato Protein
- 8.1.3.4. Rice Protein
- 8.1.3.5. Soy Protein
- 8.1.3.6. Wheat Protein
- 8.1.3.7. Other Plant Protein
- 8.1.1. Animal
- 8.2. Market Analysis, Insights and Forecast - by End User
- 8.2.1. Animal Feed
- 8.2.2. Food and Beverages
- 8.2.2.1. By Sub End User
- 8.2.2.1.1. Bakery
- 8.2.2.1.2. Breakfast Cereals
- 8.2.2.1.3. Condiments/Sauces
- 8.2.2.1.4. Confectionery
- 8.2.2.1.5. Dairy and Dairy Alternative Products
- 8.2.2.1.6. Meat/Poultry/Seafood and Meat Alternative Products
- 8.2.2.1.7. RTE/RTC Food Products
- 8.2.2.1.8. Snacks
- 8.2.2.1. By Sub End User
- 8.2.3. Personal Care and Cosmetics
- 8.2.4. Supplements
- 8.2.4.1. Baby Food and Infant Formula
- 8.2.4.2. Elderly Nutrition and Medical Nutrition
- 8.2.4.3. Sport/Performance Nutrition
- 8.1. Market Analysis, Insights and Forecast - by Source
- 9. Middle East & Africa USA Protein Industry Analysis, Insights and Forecast, 2019-2031
- 9.1. Market Analysis, Insights and Forecast - by Source
- 9.1.1. Animal
- 9.1.1.1. By Protein Type
- 9.1.1.1.1. Casein and Caseinates
- 9.1.1.1.2. Collagen
- 9.1.1.1.3. Egg Protein
- 9.1.1.1.4. Gelatin
- 9.1.1.1.5. Insect Protein
- 9.1.1.1.6. Milk Protein
- 9.1.1.1.7. Whey Protein
- 9.1.1.1.8. Other Animal Protein
- 9.1.1.1. By Protein Type
- 9.1.2. Microbial
- 9.1.2.1. Algae Protein
- 9.1.2.2. Mycoprotein
- 9.1.3. Plant
- 9.1.3.1. Hemp Protein
- 9.1.3.2. Pea Protein
- 9.1.3.3. Potato Protein
- 9.1.3.4. Rice Protein
- 9.1.3.5. Soy Protein
- 9.1.3.6. Wheat Protein
- 9.1.3.7. Other Plant Protein
- 9.1.1. Animal
- 9.2. Market Analysis, Insights and Forecast - by End User
- 9.2.1. Animal Feed
- 9.2.2. Food and Beverages
- 9.2.2.1. By Sub End User
- 9.2.2.1.1. Bakery
- 9.2.2.1.2. Breakfast Cereals
- 9.2.2.1.3. Condiments/Sauces
- 9.2.2.1.4. Confectionery
- 9.2.2.1.5. Dairy and Dairy Alternative Products
- 9.2.2.1.6. Meat/Poultry/Seafood and Meat Alternative Products
- 9.2.2.1.7. RTE/RTC Food Products
- 9.2.2.1.8. Snacks
- 9.2.2.1. By Sub End User
- 9.2.3. Personal Care and Cosmetics
- 9.2.4. Supplements
- 9.2.4.1. Baby Food and Infant Formula
- 9.2.4.2. Elderly Nutrition and Medical Nutrition
- 9.2.4.3. Sport/Performance Nutrition
- 9.1. Market Analysis, Insights and Forecast - by Source
- 10. Asia Pacific USA Protein Industry Analysis, Insights and Forecast, 2019-2031
- 10.1. Market Analysis, Insights and Forecast - by Source
- 10.1.1. Animal
- 10.1.1.1. By Protein Type
- 10.1.1.1.1. Casein and Caseinates
- 10.1.1.1.2. Collagen
- 10.1.1.1.3. Egg Protein
- 10.1.1.1.4. Gelatin
- 10.1.1.1.5. Insect Protein
- 10.1.1.1.6. Milk Protein
- 10.1.1.1.7. Whey Protein
- 10.1.1.1.8. Other Animal Protein
- 10.1.1.1. By Protein Type
- 10.1.2. Microbial
- 10.1.2.1. Algae Protein
- 10.1.2.2. Mycoprotein
- 10.1.3. Plant
- 10.1.3.1. Hemp Protein
- 10.1.3.2. Pea Protein
- 10.1.3.3. Potato Protein
- 10.1.3.4. Rice Protein
- 10.1.3.5. Soy Protein
- 10.1.3.6. Wheat Protein
- 10.1.3.7. Other Plant Protein
- 10.1.1. Animal
- 10.2. Market Analysis, Insights and Forecast - by End User
- 10.2.1. Animal Feed
- 10.2.2. Food and Beverages
- 10.2.2.1. By Sub End User
- 10.2.2.1.1. Bakery
- 10.2.2.1.2. Breakfast Cereals
- 10.2.2.1.3. Condiments/Sauces
- 10.2.2.1.4. Confectionery
- 10.2.2.1.5. Dairy and Dairy Alternative Products
- 10.2.2.1.6. Meat/Poultry/Seafood and Meat Alternative Products
- 10.2.2.1.7. RTE/RTC Food Products
- 10.2.2.1.8. Snacks
- 10.2.2.1. By Sub End User
- 10.2.3. Personal Care and Cosmetics
- 10.2.4. Supplements
- 10.2.4.1. Baby Food and Infant Formula
- 10.2.4.2. Elderly Nutrition and Medical Nutrition
- 10.2.4.3. Sport/Performance Nutrition
- 10.1. Market Analysis, Insights and Forecast - by Source
- 11. United States USA Protein Industry Analysis, Insights and Forecast, 2019-2031
- 12. Canada USA Protein Industry Analysis, Insights and Forecast, 2019-2031
- 13. Mexico USA Protein Industry Analysis, Insights and Forecast, 2019-2031
- 14. Rest of North America USA Protein Industry Analysis, Insights and Forecast, 2019-2031
- 15. Competitive Analysis
- 15.1. Global Market Share Analysis 2024
- 15.2. Company Profiles
- 15.2.1 CHS Inc
- 15.2.1.1. Overview
- 15.2.1.2. Products
- 15.2.1.3. SWOT Analysis
- 15.2.1.4. Recent Developments
- 15.2.1.5. Financials (Based on Availability)
- 15.2.2 Darling Ingredients Inc
- 15.2.2.1. Overview
- 15.2.2.2. Products
- 15.2.2.3. SWOT Analysis
- 15.2.2.4. Recent Developments
- 15.2.2.5. Financials (Based on Availability)
- 15.2.3 MGP
- 15.2.3.1. Overview
- 15.2.3.2. Products
- 15.2.3.3. SWOT Analysis
- 15.2.3.4. Recent Developments
- 15.2.3.5. Financials (Based on Availability)
- 15.2.4 Arla Foods amba
- 15.2.4.1. Overview
- 15.2.4.2. Products
- 15.2.4.3. SWOT Analysis
- 15.2.4.4. Recent Developments
- 15.2.4.5. Financials (Based on Availability)
- 15.2.5 Gelita AG
- 15.2.5.1. Overview
- 15.2.5.2. Products
- 15.2.5.3. SWOT Analysis
- 15.2.5.4. Recent Developments
- 15.2.5.5. Financials (Based on Availability)
- 15.2.6 AMCO Proteins
- 15.2.6.1. Overview
- 15.2.6.2. Products
- 15.2.6.3. SWOT Analysis
- 15.2.6.4. Recent Developments
- 15.2.6.5. Financials (Based on Availability)
- 15.2.7 International Flavors & Fragrances Inc
- 15.2.7.1. Overview
- 15.2.7.2. Products
- 15.2.7.3. SWOT Analysis
- 15.2.7.4. Recent Developments
- 15.2.7.5. Financials (Based on Availability)
- 15.2.8 Archer Daniels Midland Company
- 15.2.8.1. Overview
- 15.2.8.2. Products
- 15.2.8.3. SWOT Analysis
- 15.2.8.4. Recent Developments
- 15.2.8.5. Financials (Based on Availability)
- 15.2.9 Glanbia PLC
- 15.2.9.1. Overview
- 15.2.9.2. Products
- 15.2.9.3. SWOT Analysis
- 15.2.9.4. Recent Developments
- 15.2.9.5. Financials (Based on Availability)
- 15.2.10 Ajinomoto Co Inc
- 15.2.10.1. Overview
- 15.2.10.2. Products
- 15.2.10.3. SWOT Analysis
- 15.2.10.4. Recent Developments
- 15.2.10.5. Financials (Based on Availability)
- 15.2.11 Bunge Limited
- 15.2.11.1. Overview
- 15.2.11.2. Products
- 15.2.11.3. SWOT Analysis
- 15.2.11.4. Recent Developments
- 15.2.11.5. Financials (Based on Availability)
- 15.2.12 Roquette Frères
- 15.2.12.1. Overview
- 15.2.12.2. Products
- 15.2.12.3. SWOT Analysis
- 15.2.12.4. Recent Developments
- 15.2.12.5. Financials (Based on Availability)
- 15.2.13 Agropur Dairy Cooperative
- 15.2.13.1. Overview
- 15.2.13.2. Products
- 15.2.13.3. SWOT Analysis
- 15.2.13.4. Recent Developments
- 15.2.13.5. Financials (Based on Availability)
- 15.2.14 Kerry Group PLC
- 15.2.14.1. Overview
- 15.2.14.2. Products
- 15.2.14.3. SWOT Analysis
- 15.2.14.4. Recent Developments
- 15.2.14.5. Financials (Based on Availability)
- 15.2.15 Farbest-Tallman Foods Corporation
- 15.2.15.1. Overview
- 15.2.15.2. Products
- 15.2.15.3. SWOT Analysis
- 15.2.15.4. Recent Developments
- 15.2.15.5. Financials (Based on Availability)
- 15.2.16 Fonterra Co-operative Group Limited
- 15.2.16.1. Overview
- 15.2.16.2. Products
- 15.2.16.3. SWOT Analysis
- 15.2.16.4. Recent Developments
- 15.2.16.5. Financials (Based on Availability)
- 15.2.17 Ingredion Incorporated
- 15.2.17.1. Overview
- 15.2.17.2. Products
- 15.2.17.3. SWOT Analysis
- 15.2.17.4. Recent Developments
- 15.2.17.5. Financials (Based on Availability)
- 15.2.18 Corbion NV
- 15.2.18.1. Overview
- 15.2.18.2. Products
- 15.2.18.3. SWOT Analysis
- 15.2.18.4. Recent Developments
- 15.2.18.5. Financials (Based on Availability)
- 15.2.19 Südzucker Grou
- 15.2.19.1. Overview
- 15.2.19.2. Products
- 15.2.19.3. SWOT Analysis
- 15.2.19.4. Recent Developments
- 15.2.19.5. Financials (Based on Availability)
- 15.2.1 CHS Inc
List of Figures
- Figure 1: Global USA Protein Industry Revenue Breakdown (Million, %) by Region 2024 & 2032
- Figure 2: North America USA Protein Industry Revenue (Million), by Country 2024 & 2032
- Figure 3: North America USA Protein Industry Revenue Share (%), by Country 2024 & 2032
- Figure 4: North America USA Protein Industry Revenue (Million), by Source 2024 & 2032
- Figure 5: North America USA Protein Industry Revenue Share (%), by Source 2024 & 2032
- Figure 6: North America USA Protein Industry Revenue (Million), by End User 2024 & 2032
- Figure 7: North America USA Protein Industry Revenue Share (%), by End User 2024 & 2032
- Figure 8: North America USA Protein Industry Revenue (Million), by Country 2024 & 2032
- Figure 9: North America USA Protein Industry Revenue Share (%), by Country 2024 & 2032
- Figure 10: South America USA Protein Industry Revenue (Million), by Source 2024 & 2032
- Figure 11: South America USA Protein Industry Revenue Share (%), by Source 2024 & 2032
- Figure 12: South America USA Protein Industry Revenue (Million), by End User 2024 & 2032
- Figure 13: South America USA Protein Industry Revenue Share (%), by End User 2024 & 2032
- Figure 14: South America USA Protein Industry Revenue (Million), by Country 2024 & 2032
- Figure 15: South America USA Protein Industry Revenue Share (%), by Country 2024 & 2032
- Figure 16: Europe USA Protein Industry Revenue (Million), by Source 2024 & 2032
- Figure 17: Europe USA Protein Industry Revenue Share (%), by Source 2024 & 2032
- Figure 18: Europe USA Protein Industry Revenue (Million), by End User 2024 & 2032
- Figure 19: Europe USA Protein Industry Revenue Share (%), by End User 2024 & 2032
- Figure 20: Europe USA Protein Industry Revenue (Million), by Country 2024 & 2032
- Figure 21: Europe USA Protein Industry Revenue Share (%), by Country 2024 & 2032
- Figure 22: Middle East & Africa USA Protein Industry Revenue (Million), by Source 2024 & 2032
- Figure 23: Middle East & Africa USA Protein Industry Revenue Share (%), by Source 2024 & 2032
- Figure 24: Middle East & Africa USA Protein Industry Revenue (Million), by End User 2024 & 2032
- Figure 25: Middle East & Africa USA Protein Industry Revenue Share (%), by End User 2024 & 2032
- Figure 26: Middle East & Africa USA Protein Industry Revenue (Million), by Country 2024 & 2032
- Figure 27: Middle East & Africa USA Protein Industry Revenue Share (%), by Country 2024 & 2032
- Figure 28: Asia Pacific USA Protein Industry Revenue (Million), by Source 2024 & 2032
- Figure 29: Asia Pacific USA Protein Industry Revenue Share (%), by Source 2024 & 2032
- Figure 30: Asia Pacific USA Protein Industry Revenue (Million), by End User 2024 & 2032
- Figure 31: Asia Pacific USA Protein Industry Revenue Share (%), by End User 2024 & 2032
- Figure 32: Asia Pacific USA Protein Industry Revenue (Million), by Country 2024 & 2032
- Figure 33: Asia Pacific USA Protein Industry Revenue Share (%), by Country 2024 & 2032
List of Tables
- Table 1: Global USA Protein Industry Revenue Million Forecast, by Region 2019 & 2032
- Table 2: Global USA Protein Industry Revenue Million Forecast, by Source 2019 & 2032
- Table 3: Global USA Protein Industry Revenue Million Forecast, by End User 2019 & 2032
- Table 4: Global USA Protein Industry Revenue Million Forecast, by Region 2019 & 2032
- Table 5: Global USA Protein Industry Revenue Million Forecast, by Country 2019 & 2032
- Table 6: United States USA Protein Industry Revenue (Million) Forecast, by Application 2019 & 2032
- Table 7: Canada USA Protein Industry Revenue (Million) Forecast, by Application 2019 & 2032
- Table 8: Mexico USA Protein Industry Revenue (Million) Forecast, by Application 2019 & 2032
- Table 9: Rest of North America USA Protein Industry Revenue (Million) Forecast, by Application 2019 & 2032
- Table 10: Global USA Protein Industry Revenue Million Forecast, by Source 2019 & 2032
- Table 11: Global USA Protein Industry Revenue Million Forecast, by End User 2019 & 2032
- Table 12: Global USA Protein Industry Revenue Million Forecast, by Country 2019 & 2032
- Table 13: United States USA Protein Industry Revenue (Million) Forecast, by Application 2019 & 2032
- Table 14: Canada USA Protein Industry Revenue (Million) Forecast, by Application 2019 & 2032
- Table 15: Mexico USA Protein Industry Revenue (Million) Forecast, by Application 2019 & 2032
- Table 16: Global USA Protein Industry Revenue Million Forecast, by Source 2019 & 2032
- Table 17: Global USA Protein Industry Revenue Million Forecast, by End User 2019 & 2032
- Table 18: Global USA Protein Industry Revenue Million Forecast, by Country 2019 & 2032
- Table 19: Brazil USA Protein Industry Revenue (Million) Forecast, by Application 2019 & 2032
- Table 20: Argentina USA Protein Industry Revenue (Million) Forecast, by Application 2019 & 2032
- Table 21: Rest of South America USA Protein Industry Revenue (Million) Forecast, by Application 2019 & 2032
- Table 22: Global USA Protein Industry Revenue Million Forecast, by Source 2019 & 2032
- Table 23: Global USA Protein Industry Revenue Million Forecast, by End User 2019 & 2032
- Table 24: Global USA Protein Industry Revenue Million Forecast, by Country 2019 & 2032
- Table 25: United Kingdom USA Protein Industry Revenue (Million) Forecast, by Application 2019 & 2032
- Table 26: Germany USA Protein Industry Revenue (Million) Forecast, by Application 2019 & 2032
- Table 27: France USA Protein Industry Revenue (Million) Forecast, by Application 2019 & 2032
- Table 28: Italy USA Protein Industry Revenue (Million) Forecast, by Application 2019 & 2032
- Table 29: Spain USA Protein Industry Revenue (Million) Forecast, by Application 2019 & 2032
- Table 30: Russia USA Protein Industry Revenue (Million) Forecast, by Application 2019 & 2032
- Table 31: Benelux USA Protein Industry Revenue (Million) Forecast, by Application 2019 & 2032
- Table 32: Nordics USA Protein Industry Revenue (Million) Forecast, by Application 2019 & 2032
- Table 33: Rest of Europe USA Protein Industry Revenue (Million) Forecast, by Application 2019 & 2032
- Table 34: Global USA Protein Industry Revenue Million Forecast, by Source 2019 & 2032
- Table 35: Global USA Protein Industry Revenue Million Forecast, by End User 2019 & 2032
- Table 36: Global USA Protein Industry Revenue Million Forecast, by Country 2019 & 2032
- Table 37: Turkey USA Protein Industry Revenue (Million) Forecast, by Application 2019 & 2032
- Table 38: Israel USA Protein Industry Revenue (Million) Forecast, by Application 2019 & 2032
- Table 39: GCC USA Protein Industry Revenue (Million) Forecast, by Application 2019 & 2032
- Table 40: North Africa USA Protein Industry Revenue (Million) Forecast, by Application 2019 & 2032
- Table 41: South Africa USA Protein Industry Revenue (Million) Forecast, by Application 2019 & 2032
- Table 42: Rest of Middle East & Africa USA Protein Industry Revenue (Million) Forecast, by Application 2019 & 2032
- Table 43: Global USA Protein Industry Revenue Million Forecast, by Source 2019 & 2032
- Table 44: Global USA Protein Industry Revenue Million Forecast, by End User 2019 & 2032
- Table 45: Global USA Protein Industry Revenue Million Forecast, by Country 2019 & 2032
- Table 46: China USA Protein Industry Revenue (Million) Forecast, by Application 2019 & 2032
- Table 47: India USA Protein Industry Revenue (Million) Forecast, by Application 2019 & 2032
- Table 48: Japan USA Protein Industry Revenue (Million) Forecast, by Application 2019 & 2032
- Table 49: South Korea USA Protein Industry Revenue (Million) Forecast, by Application 2019 & 2032
- Table 50: ASEAN USA Protein Industry Revenue (Million) Forecast, by Application 2019 & 2032
- Table 51: Oceania USA Protein Industry Revenue (Million) Forecast, by Application 2019 & 2032
- Table 52: Rest of Asia Pacific USA Protein Industry Revenue (Million) Forecast, by Application 2019 & 2032
Frequently Asked Questions
1. What is the projected Compound Annual Growth Rate (CAGR) of the USA Protein Industry?
The projected CAGR is approximately 26.40%.
2. Which companies are prominent players in the USA Protein Industry?
Key companies in the market include CHS Inc, Darling Ingredients Inc, MGP, Arla Foods amba, Gelita AG, AMCO Proteins, International Flavors & Fragrances Inc, Archer Daniels Midland Company, Glanbia PLC, Ajinomoto Co Inc, Bunge Limited, Roquette Frères, Agropur Dairy Cooperative, Kerry Group PLC, Farbest-Tallman Foods Corporation, Fonterra Co-operative Group Limited, Ingredion Incorporated, Corbion NV, Südzucker Grou.
3. What are the main segments of the USA Protein Industry?
The market segments include Source, End User.
4. Can you provide details about the market size?
The market size is estimated to be USD XX Million as of 2022.
5. What are some drivers contributing to market growth?
Increasing Urbanization; Growing Disposable Income.
6. What are the notable trends driving market growth?
OTHER KEY INDUSTRY TRENDS COVERED IN THE REPORT.
7. Are there any restraints impacting market growth?
High-price and additional delivery charges.
8. Can you provide examples of recent developments in the market?
August 2022: Optimum Nutrition announced the launch of its new Gold Standard Protein Shake. The RTD is available in chocolate and vanilla flavors, and formulated with 24 grams of protein per serving.June 2022: Fonterra JV has entered into a joint venture with Tillamook country creamery association(TCCA) and a three-mile canyon farm in the United States to launch Pro-Optima TM, a grade A functional whey protein concentrate (fWPC).August 2021: Darling Ingredients expanded its existing manufacturing facility that includes Nebraska’s first operation dedicated solely to poultry conversion. This expanded manufacturing unit may also facilitate protein conversion.
9. What pricing options are available for accessing the report?
Pricing options include single-user, multi-user, and enterprise licenses priced at USD 3800, USD 4500, and USD 5800 respectively.
10. Is the market size provided in terms of value or volume?
The market size is provided in terms of value, measured in Million.
11. Are there any specific market keywords associated with the report?
Yes, the market keyword associated with the report is "USA Protein Industry," which aids in identifying and referencing the specific market segment covered.
12. How do I determine which pricing option suits my needs best?
The pricing options vary based on user requirements and access needs. Individual users may opt for single-user licenses, while businesses requiring broader access may choose multi-user or enterprise licenses for cost-effective access to the report.
13. Are there any additional resources or data provided in the USA Protein Industry report?
While the report offers comprehensive insights, it's advisable to review the specific contents or supplementary materials provided to ascertain if additional resources or data are available.
14. How can I stay updated on further developments or reports in the USA Protein Industry?
To stay informed about further developments, trends, and reports in the USA Protein Industry, consider subscribing to industry newsletters, following relevant companies and organizations, or regularly checking reputable industry news sources and publications.
Methodology
Step 1 - Identification of Relevant Samples Size from Population Database


Step 2 - Approaches for Defining Global Market Size (Value, Volume* & Price*)

Note*: In applicable scenarios
Step 3 - Data Sources
Primary Research
- Web Analytics
- Survey Reports
- Research Institute
- Latest Research Reports
- Opinion Leaders
Secondary Research
- Annual Reports
- White Paper
- Latest Press Release
- Industry Association
- Paid Database
- Investor Presentations

Step 4 - Data Triangulation
Involves using different sources of information in order to increase the validity of a study
These sources are likely to be stakeholders in a program - participants, other researchers, program staff, other community members, and so on.
Then we put all data in single framework & apply various statistical tools to find out the dynamic on the market.
During the analysis stage, feedback from the stakeholder groups would be compared to determine areas of agreement as well as areas of divergence
