

Key Insights
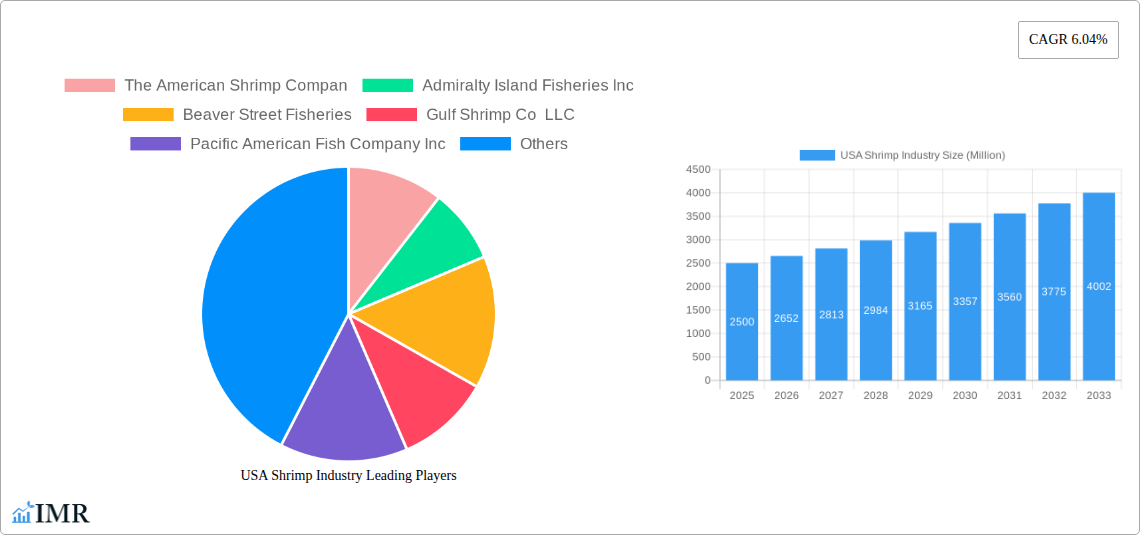
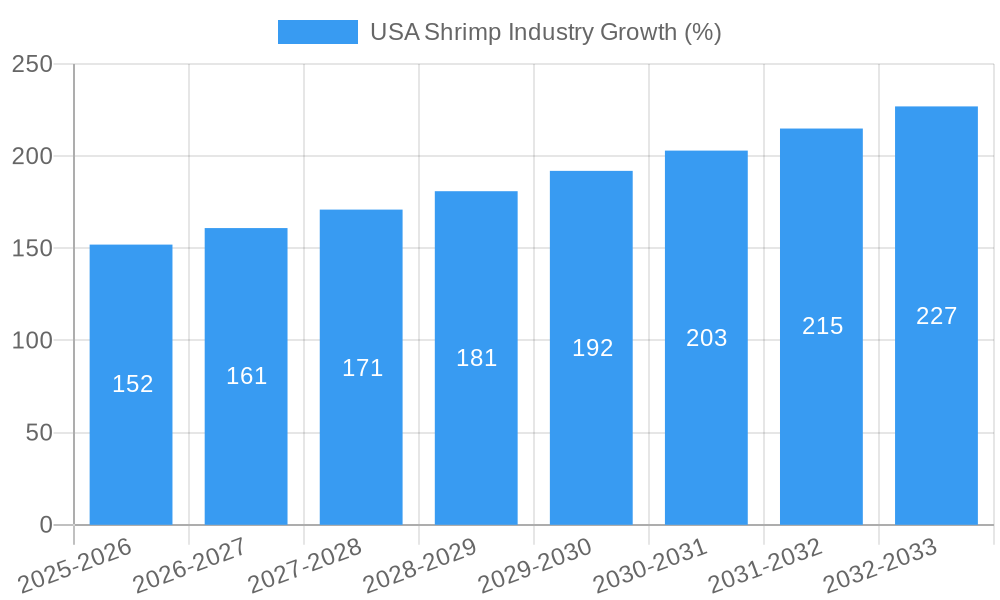
The U.S. shrimp industry, valued at approximately $2.5 billion in 2025, is projected to experience robust growth, exhibiting a compound annual growth rate (CAGR) of 6.04% from 2025 to 2033. This expansion is driven by several key factors. Increasing consumer demand for seafood, fueled by growing health consciousness and the popularity of shrimp in various cuisines, is a primary driver. Furthermore, the rise of convenient processed shrimp products and the expansion of e-commerce channels are significantly contributing to market growth. The on-trade segment (restaurants and hotels) remains a significant revenue source, but the off-trade segment, encompassing retail stores and online platforms, is witnessing rapid expansion, offering consumers greater accessibility and choice. Growth is further propelled by innovative product offerings, such as value-added shrimp preparations and sustainably sourced shrimp, catering to evolving consumer preferences. However, challenges remain, including fluctuations in shrimp supply due to environmental factors and potential price volatility. The industry also faces pressure to adopt more sustainable fishing practices to meet growing consumer demand for environmentally responsible seafood. Competition from imported shrimp also presents a considerable challenge for domestic producers.
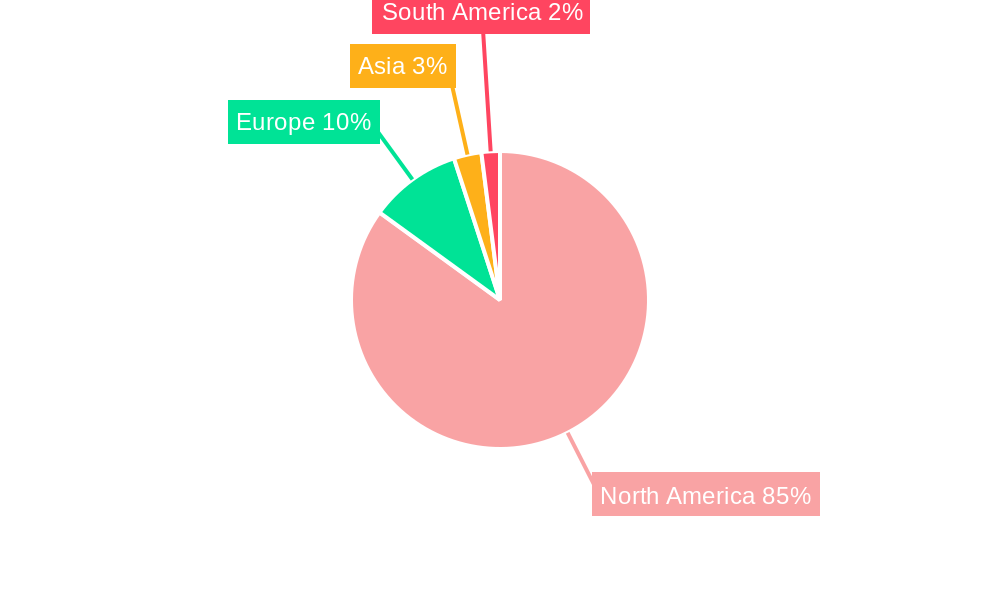
The North American market, particularly the United States, dominates the industry, with the majority of shrimp consumption concentrated within this region. The market is segmented by distribution channels (on-trade and off-trade) and shrimp form (canned, fresh/chilled, frozen, and processed). Major players, including The American Shrimp Company, Admiralty Island Fisheries Inc., and others, are strategically positioning themselves to capitalize on market opportunities by investing in sustainable practices, enhancing product offerings, and strengthening their distribution networks. Future growth hinges on addressing sustainability concerns, managing supply chain complexities, and effectively meeting evolving consumer preferences regarding product quality, convenience, and price. The forecast period suggests a substantial expansion of the market by 2033, likely exceeding $4 billion, reflecting a consistently strong trajectory for the U.S. shrimp industry.
USA Shrimp Industry Market Report: 2019-2033
This comprehensive report provides an in-depth analysis of the USA shrimp industry, covering market dynamics, growth trends, key players, and future outlook. The study period spans from 2019 to 2033, with 2025 as the base and estimated year. This report is essential for industry professionals, investors, and anyone seeking to understand this dynamic market. It leverages extensive primary and secondary research to deliver actionable insights.
Keywords: USA Shrimp Industry, Shrimp Market, Seafood Market, Aquaculture, Frozen Shrimp, Fresh Shrimp, Canned Shrimp, Seafood Distribution, Restaurant Supply, Retail Seafood, Shrimp Farming, Recirculating Aquaculture System (RAS), Seafood Processing, US Shrimp Exports, American Shrimp Companies, Market Size, Market Share, Market Growth, Market Trends
USA Shrimp Industry Market Dynamics & Structure
The US shrimp market is characterized by moderate concentration, with several major players and numerous smaller regional producers. Market share data for 2025 shows that the top 5 companies hold approximately xx% of the market. Technological innovations, particularly in aquaculture (RAS systems), are driving efficiency gains and shaping future production capacity. Stringent regulatory frameworks regarding food safety and sustainability significantly influence operational costs and market access. Competitive substitutes, such as other seafood options, continually impact market share. End-user demographics show a growing preference for sustainably sourced and healthy seafood options across age groups, but particularly amongst younger consumers. M&A activity remains modest, with xx deals recorded between 2019 and 2024, representing a total value of $xx million.
- Market Concentration: Moderately concentrated, with top 5 players holding approximately xx% market share in 2025.
- Technological Innovation: RAS technology is driving efficiency and sustainability in aquaculture.
- Regulatory Framework: Stringent food safety and sustainability regulations are impactful.
- Competitive Substitutes: Other seafood options create competitive pressure.
- End-User Demographics: Growing demand driven by health-conscious consumers.
- M&A Trends: Low to moderate activity, with xx deals totaling $xx million from 2019-2024.
USA Shrimp Industry Growth Trends & Insights
The US shrimp market experienced a compound annual growth rate (CAGR) of xx% during the historical period (2019-2024), reaching a market size of $xx million in 2024. The market is projected to grow at a CAGR of xx% from 2025 to 2033, reaching $xx million by 2033. This growth is fueled by increased consumer demand, driven by changing dietary preferences and rising disposable incomes. Technological advancements such as RAS are increasing production efficiency and improving sustainability. However, challenges such as rising input costs, supply chain disruptions, and disease outbreaks could impact growth. Market penetration of frozen shrimp is currently at approximately xx%, while canned shrimp has xx% penetration.
Dominant Regions, Countries, or Segments in USA Shrimp Industry
The frozen shrimp segment dominates the market, accounting for xx% of the total market value in 2025. The on-trade distribution channel (restaurants and hotels) holds a significant share, valued at $xx million in 2025, while the off-trade (retailers and e-commerce) is rapidly growing, expected to reach $xx million by 2033. The South, specifically Gulf Coast states, remains the dominant region due to its established shrimp farming and processing infrastructure, and historical production significance.
- Dominant Segment: Frozen shrimp (xx% market share in 2025).
- Key Distribution Channel: On-Trade (restaurants, hotels) with a 2025 value of $xx million.
- Fastest-Growing Segment: Off-Trade (retailers, e-commerce) expected to reach $xx million by 2033.
- Dominant Region: The Gulf Coast States.
USA Shrimp Industry Product Landscape
The USA shrimp industry offers a diverse product landscape including fresh/chilled, frozen, canned, and processed shrimp. Product innovations focus on value-added offerings, such as pre-cooked shrimp, seasoned shrimp, and ready-to-eat options. Technological advancements in processing and packaging improve shelf life and product quality. Unique selling propositions (USPs) often center on sustainability certifications, origin transparency, and traceability.
Key Drivers, Barriers & Challenges in USA Shrimp Industry
Key Drivers: Rising consumer demand for seafood, technological advancements in aquaculture (RAS), and increasing investments in sustainable shrimp farming practices are primary growth drivers.
Challenges: Fluctuating shrimp prices, disease outbreaks affecting farm production, supply chain disruptions, and increasingly stringent regulatory compliance all present challenges. For example, supply chain interruptions in 2022-2023 led to a xx% decrease in supply, impacting prices and profitability.
Emerging Opportunities in USA Shrimp Industry
Emerging opportunities include expansion into new markets (e.g., online retail), development of value-added products (ready-to-eat meals), and increased focus on sustainability and traceability. Growing consumer interest in plant-based alternatives presents both a challenge and an opportunity to develop shrimp-flavored analogues.
Growth Accelerators in the USA Shrimp Industry Industry
Continued technological innovation in aquaculture, strategic partnerships between producers and distributors, and expansion into new market segments are key accelerators for long-term growth. The increasing adoption of sustainable farming practices will enhance market appeal and build consumer trust.
Key Players Shaping the USA Shrimp Industry Market
- The American Shrimp Company
- Admiralty Island Fisheries Inc
- Beaver Street Fisheries
- Gulf Shrimp Co LLC
- Pacific American Fish Company Inc
- Millennium Ocean Star Corporation
- Dulcich Inc
- Sysco Corporation
- NaturalShrimp Inc
- Paul Piazza & Son Inc
Notable Milestones in USA Shrimp Industry Sector
- January 2022: NaturalShrimp, Inc. and Gulf Shrimp Company Limited partnered for live shrimp production using RAS technology.
- February 2022: NaturalShrimp secured a partnership with Jefferson County, Florida, for a new shrimp production facility and sought USD 25 million in grants.
- March 2022: Beaver Street Fisheries completed its Jacksonville packaging facility renovation, improving storage capacity.
In-Depth USA Shrimp Industry Market Outlook
The US shrimp market presents a significant growth opportunity over the next decade, driven by consistent consumer demand and advancements in aquaculture technology. Strategic investments in sustainable practices and expansion into value-added products will further enhance market potential. Companies focused on innovation, sustainability, and efficient supply chains are poised for significant growth.
USA Shrimp Industry Segmentation
-
1. Form
- 1.1. Canned
- 1.2. Fresh / Chilled
- 1.3. Frozen
- 1.4. Processed
-
2. Distribution Channel
-
2.1. Off-Trade
- 2.1.1. Convenience Stores
- 2.1.2. Online Channel
- 2.1.3. Supermarkets and Hypermarkets
- 2.1.4. Others
- 2.2. On-Trade
-
2.1. Off-Trade
USA Shrimp Industry Segmentation By Geography
-
1. North America
- 1.1. United States
- 1.2. Canada
- 1.3. Mexico
-
2. South America
- 2.1. Brazil
- 2.2. Argentina
- 2.3. Rest of South America
-
3. Europe
- 3.1. United Kingdom
- 3.2. Germany
- 3.3. France
- 3.4. Italy
- 3.5. Spain
- 3.6. Russia
- 3.7. Benelux
- 3.8. Nordics
- 3.9. Rest of Europe
-
4. Middle East & Africa
- 4.1. Turkey
- 4.2. Israel
- 4.3. GCC
- 4.4. North Africa
- 4.5. South Africa
- 4.6. Rest of Middle East & Africa
-
5. Asia Pacific
- 5.1. China
- 5.2. India
- 5.3. Japan
- 5.4. South Korea
- 5.5. ASEAN
- 5.6. Oceania
- 5.7. Rest of Asia Pacific
USA Shrimp Industry REPORT HIGHLIGHTS
| Aspects | Details |
|---|---|
| Study Period | 2019-2033 |
| Base Year | 2024 |
| Estimated Year | 2025 |
| Forecast Period | 2025-2033 |
| Historical Period | 2019-2024 |
| Growth Rate | CAGR of 6.04% from 2019-2033 |
| Segmentation |
|
Table of Contents
- 1. Introduction
- 1.1. Research Scope
- 1.2. Market Segmentation
- 1.3. Research Methodology
- 1.4. Definitions and Assumptions
- 2. Executive Summary
- 2.1. Introduction
- 3. Market Dynamics
- 3.1. Introduction
- 3.2. Market Drivers
- 3.2.1. Increasing Focus on Maintaining Health and Well-Being; Launching Supplements For Specific Purposes and Targeted Population
- 3.3. Market Restrains
- 3.3.1. Supplement Consumption and Their Side-effects; Inclination Towards Substitute Products
- 3.4. Market Trends
- 3.4.1. Increased consumer spending on seafood is boosting sales
- 4. Market Factor Analysis
- 4.1. Porters Five Forces
- 4.2. Supply/Value Chain
- 4.3. PESTEL analysis
- 4.4. Market Entropy
- 4.5. Patent/Trademark Analysis
- 5. Global USA Shrimp Industry Analysis, Insights and Forecast, 2019-2031
- 5.1. Market Analysis, Insights and Forecast - by Form
- 5.1.1. Canned
- 5.1.2. Fresh / Chilled
- 5.1.3. Frozen
- 5.1.4. Processed
- 5.2. Market Analysis, Insights and Forecast - by Distribution Channel
- 5.2.1. Off-Trade
- 5.2.1.1. Convenience Stores
- 5.2.1.2. Online Channel
- 5.2.1.3. Supermarkets and Hypermarkets
- 5.2.1.4. Others
- 5.2.2. On-Trade
- 5.2.1. Off-Trade
- 5.3. Market Analysis, Insights and Forecast - by Region
- 5.3.1. North America
- 5.3.2. South America
- 5.3.3. Europe
- 5.3.4. Middle East & Africa
- 5.3.5. Asia Pacific
- 5.1. Market Analysis, Insights and Forecast - by Form
- 6. North America USA Shrimp Industry Analysis, Insights and Forecast, 2019-2031
- 6.1. Market Analysis, Insights and Forecast - by Form
- 6.1.1. Canned
- 6.1.2. Fresh / Chilled
- 6.1.3. Frozen
- 6.1.4. Processed
- 6.2. Market Analysis, Insights and Forecast - by Distribution Channel
- 6.2.1. Off-Trade
- 6.2.1.1. Convenience Stores
- 6.2.1.2. Online Channel
- 6.2.1.3. Supermarkets and Hypermarkets
- 6.2.1.4. Others
- 6.2.2. On-Trade
- 6.2.1. Off-Trade
- 6.1. Market Analysis, Insights and Forecast - by Form
- 7. South America USA Shrimp Industry Analysis, Insights and Forecast, 2019-2031
- 7.1. Market Analysis, Insights and Forecast - by Form
- 7.1.1. Canned
- 7.1.2. Fresh / Chilled
- 7.1.3. Frozen
- 7.1.4. Processed
- 7.2. Market Analysis, Insights and Forecast - by Distribution Channel
- 7.2.1. Off-Trade
- 7.2.1.1. Convenience Stores
- 7.2.1.2. Online Channel
- 7.2.1.3. Supermarkets and Hypermarkets
- 7.2.1.4. Others
- 7.2.2. On-Trade
- 7.2.1. Off-Trade
- 7.1. Market Analysis, Insights and Forecast - by Form
- 8. Europe USA Shrimp Industry Analysis, Insights and Forecast, 2019-2031
- 8.1. Market Analysis, Insights and Forecast - by Form
- 8.1.1. Canned
- 8.1.2. Fresh / Chilled
- 8.1.3. Frozen
- 8.1.4. Processed
- 8.2. Market Analysis, Insights and Forecast - by Distribution Channel
- 8.2.1. Off-Trade
- 8.2.1.1. Convenience Stores
- 8.2.1.2. Online Channel
- 8.2.1.3. Supermarkets and Hypermarkets
- 8.2.1.4. Others
- 8.2.2. On-Trade
- 8.2.1. Off-Trade
- 8.1. Market Analysis, Insights and Forecast - by Form
- 9. Middle East & Africa USA Shrimp Industry Analysis, Insights and Forecast, 2019-2031
- 9.1. Market Analysis, Insights and Forecast - by Form
- 9.1.1. Canned
- 9.1.2. Fresh / Chilled
- 9.1.3. Frozen
- 9.1.4. Processed
- 9.2. Market Analysis, Insights and Forecast - by Distribution Channel
- 9.2.1. Off-Trade
- 9.2.1.1. Convenience Stores
- 9.2.1.2. Online Channel
- 9.2.1.3. Supermarkets and Hypermarkets
- 9.2.1.4. Others
- 9.2.2. On-Trade
- 9.2.1. Off-Trade
- 9.1. Market Analysis, Insights and Forecast - by Form
- 10. Asia Pacific USA Shrimp Industry Analysis, Insights and Forecast, 2019-2031
- 10.1. Market Analysis, Insights and Forecast - by Form
- 10.1.1. Canned
- 10.1.2. Fresh / Chilled
- 10.1.3. Frozen
- 10.1.4. Processed
- 10.2. Market Analysis, Insights and Forecast - by Distribution Channel
- 10.2.1. Off-Trade
- 10.2.1.1. Convenience Stores
- 10.2.1.2. Online Channel
- 10.2.1.3. Supermarkets and Hypermarkets
- 10.2.1.4. Others
- 10.2.2. On-Trade
- 10.2.1. Off-Trade
- 10.1. Market Analysis, Insights and Forecast - by Form
- 11. United States USA Shrimp Industry Analysis, Insights and Forecast, 2019-2031
- 12. Canada USA Shrimp Industry Analysis, Insights and Forecast, 2019-2031
- 13. Mexico USA Shrimp Industry Analysis, Insights and Forecast, 2019-2031
- 14. Competitive Analysis
- 14.1. Global Market Share Analysis 2024
- 14.2. Company Profiles
- 14.2.1 The American Shrimp Compan
- 14.2.1.1. Overview
- 14.2.1.2. Products
- 14.2.1.3. SWOT Analysis
- 14.2.1.4. Recent Developments
- 14.2.1.5. Financials (Based on Availability)
- 14.2.2 Admiralty Island Fisheries Inc
- 14.2.2.1. Overview
- 14.2.2.2. Products
- 14.2.2.3. SWOT Analysis
- 14.2.2.4. Recent Developments
- 14.2.2.5. Financials (Based on Availability)
- 14.2.3 Beaver Street Fisheries
- 14.2.3.1. Overview
- 14.2.3.2. Products
- 14.2.3.3. SWOT Analysis
- 14.2.3.4. Recent Developments
- 14.2.3.5. Financials (Based on Availability)
- 14.2.4 Gulf Shrimp Co LLC
- 14.2.4.1. Overview
- 14.2.4.2. Products
- 14.2.4.3. SWOT Analysis
- 14.2.4.4. Recent Developments
- 14.2.4.5. Financials (Based on Availability)
- 14.2.5 Pacific American Fish Company Inc
- 14.2.5.1. Overview
- 14.2.5.2. Products
- 14.2.5.3. SWOT Analysis
- 14.2.5.4. Recent Developments
- 14.2.5.5. Financials (Based on Availability)
- 14.2.6 Millennium Ocean Star Corporation
- 14.2.6.1. Overview
- 14.2.6.2. Products
- 14.2.6.3. SWOT Analysis
- 14.2.6.4. Recent Developments
- 14.2.6.5. Financials (Based on Availability)
- 14.2.7 Dulcich Inc
- 14.2.7.1. Overview
- 14.2.7.2. Products
- 14.2.7.3. SWOT Analysis
- 14.2.7.4. Recent Developments
- 14.2.7.5. Financials (Based on Availability)
- 14.2.8 Sysco Corporation
- 14.2.8.1. Overview
- 14.2.8.2. Products
- 14.2.8.3. SWOT Analysis
- 14.2.8.4. Recent Developments
- 14.2.8.5. Financials (Based on Availability)
- 14.2.9 NaturalShrimp Inc
- 14.2.9.1. Overview
- 14.2.9.2. Products
- 14.2.9.3. SWOT Analysis
- 14.2.9.4. Recent Developments
- 14.2.9.5. Financials (Based on Availability)
- 14.2.10 Paul Piazza & Son Inc
- 14.2.10.1. Overview
- 14.2.10.2. Products
- 14.2.10.3. SWOT Analysis
- 14.2.10.4. Recent Developments
- 14.2.10.5. Financials (Based on Availability)
- 14.2.1 The American Shrimp Compan
List of Figures
- Figure 1: Global USA Shrimp Industry Revenue Breakdown (Million, %) by Region 2024 & 2032
- Figure 2: North America USA Shrimp Industry Revenue (Million), by Country 2024 & 2032
- Figure 3: North America USA Shrimp Industry Revenue Share (%), by Country 2024 & 2032
- Figure 4: North America USA Shrimp Industry Revenue (Million), by Form 2024 & 2032
- Figure 5: North America USA Shrimp Industry Revenue Share (%), by Form 2024 & 2032
- Figure 6: North America USA Shrimp Industry Revenue (Million), by Distribution Channel 2024 & 2032
- Figure 7: North America USA Shrimp Industry Revenue Share (%), by Distribution Channel 2024 & 2032
- Figure 8: North America USA Shrimp Industry Revenue (Million), by Country 2024 & 2032
- Figure 9: North America USA Shrimp Industry Revenue Share (%), by Country 2024 & 2032
- Figure 10: South America USA Shrimp Industry Revenue (Million), by Form 2024 & 2032
- Figure 11: South America USA Shrimp Industry Revenue Share (%), by Form 2024 & 2032
- Figure 12: South America USA Shrimp Industry Revenue (Million), by Distribution Channel 2024 & 2032
- Figure 13: South America USA Shrimp Industry Revenue Share (%), by Distribution Channel 2024 & 2032
- Figure 14: South America USA Shrimp Industry Revenue (Million), by Country 2024 & 2032
- Figure 15: South America USA Shrimp Industry Revenue Share (%), by Country 2024 & 2032
- Figure 16: Europe USA Shrimp Industry Revenue (Million), by Form 2024 & 2032
- Figure 17: Europe USA Shrimp Industry Revenue Share (%), by Form 2024 & 2032
- Figure 18: Europe USA Shrimp Industry Revenue (Million), by Distribution Channel 2024 & 2032
- Figure 19: Europe USA Shrimp Industry Revenue Share (%), by Distribution Channel 2024 & 2032
- Figure 20: Europe USA Shrimp Industry Revenue (Million), by Country 2024 & 2032
- Figure 21: Europe USA Shrimp Industry Revenue Share (%), by Country 2024 & 2032
- Figure 22: Middle East & Africa USA Shrimp Industry Revenue (Million), by Form 2024 & 2032
- Figure 23: Middle East & Africa USA Shrimp Industry Revenue Share (%), by Form 2024 & 2032
- Figure 24: Middle East & Africa USA Shrimp Industry Revenue (Million), by Distribution Channel 2024 & 2032
- Figure 25: Middle East & Africa USA Shrimp Industry Revenue Share (%), by Distribution Channel 2024 & 2032
- Figure 26: Middle East & Africa USA Shrimp Industry Revenue (Million), by Country 2024 & 2032
- Figure 27: Middle East & Africa USA Shrimp Industry Revenue Share (%), by Country 2024 & 2032
- Figure 28: Asia Pacific USA Shrimp Industry Revenue (Million), by Form 2024 & 2032
- Figure 29: Asia Pacific USA Shrimp Industry Revenue Share (%), by Form 2024 & 2032
- Figure 30: Asia Pacific USA Shrimp Industry Revenue (Million), by Distribution Channel 2024 & 2032
- Figure 31: Asia Pacific USA Shrimp Industry Revenue Share (%), by Distribution Channel 2024 & 2032
- Figure 32: Asia Pacific USA Shrimp Industry Revenue (Million), by Country 2024 & 2032
- Figure 33: Asia Pacific USA Shrimp Industry Revenue Share (%), by Country 2024 & 2032
List of Tables
- Table 1: Global USA Shrimp Industry Revenue Million Forecast, by Region 2019 & 2032
- Table 2: Global USA Shrimp Industry Revenue Million Forecast, by Form 2019 & 2032
- Table 3: Global USA Shrimp Industry Revenue Million Forecast, by Distribution Channel 2019 & 2032
- Table 4: Global USA Shrimp Industry Revenue Million Forecast, by Region 2019 & 2032
- Table 5: Global USA Shrimp Industry Revenue Million Forecast, by Country 2019 & 2032
- Table 6: United States USA Shrimp Industry Revenue (Million) Forecast, by Application 2019 & 2032
- Table 7: Canada USA Shrimp Industry Revenue (Million) Forecast, by Application 2019 & 2032
- Table 8: Mexico USA Shrimp Industry Revenue (Million) Forecast, by Application 2019 & 2032
- Table 9: Global USA Shrimp Industry Revenue Million Forecast, by Form 2019 & 2032
- Table 10: Global USA Shrimp Industry Revenue Million Forecast, by Distribution Channel 2019 & 2032
- Table 11: Global USA Shrimp Industry Revenue Million Forecast, by Country 2019 & 2032
- Table 12: United States USA Shrimp Industry Revenue (Million) Forecast, by Application 2019 & 2032
- Table 13: Canada USA Shrimp Industry Revenue (Million) Forecast, by Application 2019 & 2032
- Table 14: Mexico USA Shrimp Industry Revenue (Million) Forecast, by Application 2019 & 2032
- Table 15: Global USA Shrimp Industry Revenue Million Forecast, by Form 2019 & 2032
- Table 16: Global USA Shrimp Industry Revenue Million Forecast, by Distribution Channel 2019 & 2032
- Table 17: Global USA Shrimp Industry Revenue Million Forecast, by Country 2019 & 2032
- Table 18: Brazil USA Shrimp Industry Revenue (Million) Forecast, by Application 2019 & 2032
- Table 19: Argentina USA Shrimp Industry Revenue (Million) Forecast, by Application 2019 & 2032
- Table 20: Rest of South America USA Shrimp Industry Revenue (Million) Forecast, by Application 2019 & 2032
- Table 21: Global USA Shrimp Industry Revenue Million Forecast, by Form 2019 & 2032
- Table 22: Global USA Shrimp Industry Revenue Million Forecast, by Distribution Channel 2019 & 2032
- Table 23: Global USA Shrimp Industry Revenue Million Forecast, by Country 2019 & 2032
- Table 24: United Kingdom USA Shrimp Industry Revenue (Million) Forecast, by Application 2019 & 2032
- Table 25: Germany USA Shrimp Industry Revenue (Million) Forecast, by Application 2019 & 2032
- Table 26: France USA Shrimp Industry Revenue (Million) Forecast, by Application 2019 & 2032
- Table 27: Italy USA Shrimp Industry Revenue (Million) Forecast, by Application 2019 & 2032
- Table 28: Spain USA Shrimp Industry Revenue (Million) Forecast, by Application 2019 & 2032
- Table 29: Russia USA Shrimp Industry Revenue (Million) Forecast, by Application 2019 & 2032
- Table 30: Benelux USA Shrimp Industry Revenue (Million) Forecast, by Application 2019 & 2032
- Table 31: Nordics USA Shrimp Industry Revenue (Million) Forecast, by Application 2019 & 2032
- Table 32: Rest of Europe USA Shrimp Industry Revenue (Million) Forecast, by Application 2019 & 2032
- Table 33: Global USA Shrimp Industry Revenue Million Forecast, by Form 2019 & 2032
- Table 34: Global USA Shrimp Industry Revenue Million Forecast, by Distribution Channel 2019 & 2032
- Table 35: Global USA Shrimp Industry Revenue Million Forecast, by Country 2019 & 2032
- Table 36: Turkey USA Shrimp Industry Revenue (Million) Forecast, by Application 2019 & 2032
- Table 37: Israel USA Shrimp Industry Revenue (Million) Forecast, by Application 2019 & 2032
- Table 38: GCC USA Shrimp Industry Revenue (Million) Forecast, by Application 2019 & 2032
- Table 39: North Africa USA Shrimp Industry Revenue (Million) Forecast, by Application 2019 & 2032
- Table 40: South Africa USA Shrimp Industry Revenue (Million) Forecast, by Application 2019 & 2032
- Table 41: Rest of Middle East & Africa USA Shrimp Industry Revenue (Million) Forecast, by Application 2019 & 2032
- Table 42: Global USA Shrimp Industry Revenue Million Forecast, by Form 2019 & 2032
- Table 43: Global USA Shrimp Industry Revenue Million Forecast, by Distribution Channel 2019 & 2032
- Table 44: Global USA Shrimp Industry Revenue Million Forecast, by Country 2019 & 2032
- Table 45: China USA Shrimp Industry Revenue (Million) Forecast, by Application 2019 & 2032
- Table 46: India USA Shrimp Industry Revenue (Million) Forecast, by Application 2019 & 2032
- Table 47: Japan USA Shrimp Industry Revenue (Million) Forecast, by Application 2019 & 2032
- Table 48: South Korea USA Shrimp Industry Revenue (Million) Forecast, by Application 2019 & 2032
- Table 49: ASEAN USA Shrimp Industry Revenue (Million) Forecast, by Application 2019 & 2032
- Table 50: Oceania USA Shrimp Industry Revenue (Million) Forecast, by Application 2019 & 2032
- Table 51: Rest of Asia Pacific USA Shrimp Industry Revenue (Million) Forecast, by Application 2019 & 2032
Frequently Asked Questions
1. What is the projected Compound Annual Growth Rate (CAGR) of the USA Shrimp Industry?
The projected CAGR is approximately 6.04%.
2. Which companies are prominent players in the USA Shrimp Industry?
Key companies in the market include The American Shrimp Compan, Admiralty Island Fisheries Inc, Beaver Street Fisheries, Gulf Shrimp Co LLC, Pacific American Fish Company Inc, Millennium Ocean Star Corporation, Dulcich Inc, Sysco Corporation, NaturalShrimp Inc, Paul Piazza & Son Inc.
3. What are the main segments of the USA Shrimp Industry?
The market segments include Form, Distribution Channel.
4. Can you provide details about the market size?
The market size is estimated to be USD XX Million as of 2022.
5. What are some drivers contributing to market growth?
Increasing Focus on Maintaining Health and Well-Being; Launching Supplements For Specific Purposes and Targeted Population.
6. What are the notable trends driving market growth?
Increased consumer spending on seafood is boosting sales.
7. Are there any restraints impacting market growth?
Supplement Consumption and Their Side-effects; Inclination Towards Substitute Products.
8. Can you provide examples of recent developments in the market?
March 2022: Beaver Street Fisheries completed its renovation in Jacksonville for the packaging facility. This move may help the company improve its storage facilities.February 2022: NaturalShrimp announced its partnership with Jefferson County, Florida, for a new shrimp production facility property, as well as to seek USD 25 million in available grants.January 2022: NaturalShrimp, Inc. and Gulf Shrimp Company Limited has agreed to continue their partnership for live shrimp by the first shrimp-focused, commercially operational RAS (Recirculating Aquaculture System) developed and patented by NaturalShrimp Inc.
9. What pricing options are available for accessing the report?
Pricing options include single-user, multi-user, and enterprise licenses priced at USD 3800, USD 4500, and USD 5800 respectively.
10. Is the market size provided in terms of value or volume?
The market size is provided in terms of value, measured in Million.
11. Are there any specific market keywords associated with the report?
Yes, the market keyword associated with the report is "USA Shrimp Industry," which aids in identifying and referencing the specific market segment covered.
12. How do I determine which pricing option suits my needs best?
The pricing options vary based on user requirements and access needs. Individual users may opt for single-user licenses, while businesses requiring broader access may choose multi-user or enterprise licenses for cost-effective access to the report.
13. Are there any additional resources or data provided in the USA Shrimp Industry report?
While the report offers comprehensive insights, it's advisable to review the specific contents or supplementary materials provided to ascertain if additional resources or data are available.
14. How can I stay updated on further developments or reports in the USA Shrimp Industry?
To stay informed about further developments, trends, and reports in the USA Shrimp Industry, consider subscribing to industry newsletters, following relevant companies and organizations, or regularly checking reputable industry news sources and publications.
Methodology
Step 1 - Identification of Relevant Samples Size from Population Database


Step 2 - Approaches for Defining Global Market Size (Value, Volume* & Price*)

Note*: In applicable scenarios
Step 3 - Data Sources
Primary Research
- Web Analytics
- Survey Reports
- Research Institute
- Latest Research Reports
- Opinion Leaders
Secondary Research
- Annual Reports
- White Paper
- Latest Press Release
- Industry Association
- Paid Database
- Investor Presentations

Step 4 - Data Triangulation
Involves using different sources of information in order to increase the validity of a study
These sources are likely to be stakeholders in a program - participants, other researchers, program staff, other community members, and so on.
Then we put all data in single framework & apply various statistical tools to find out the dynamic on the market.
During the analysis stage, feedback from the stakeholder groups would be compared to determine areas of agreement as well as areas of divergence
