

Key Insights
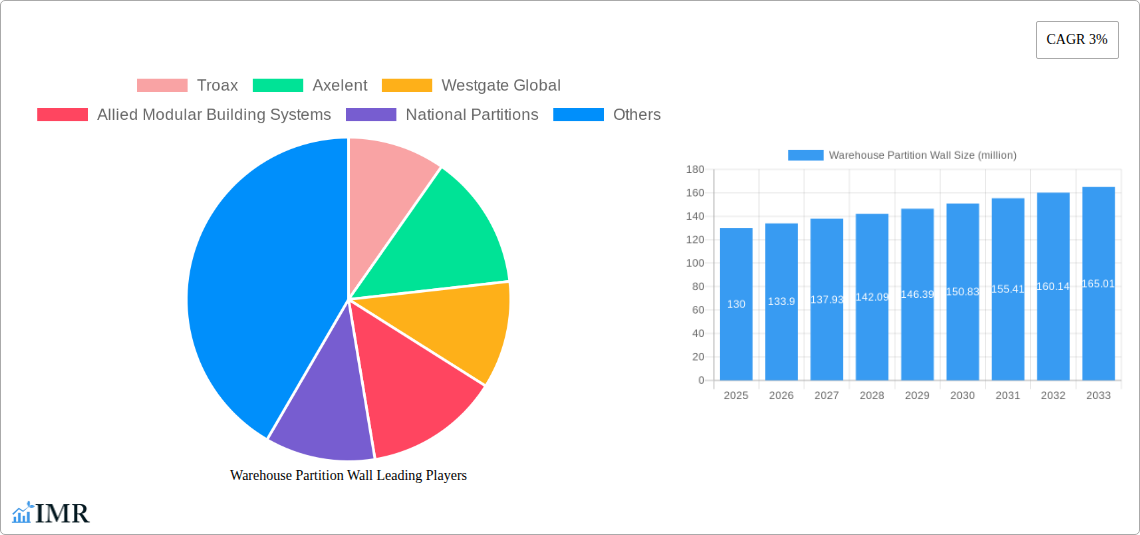
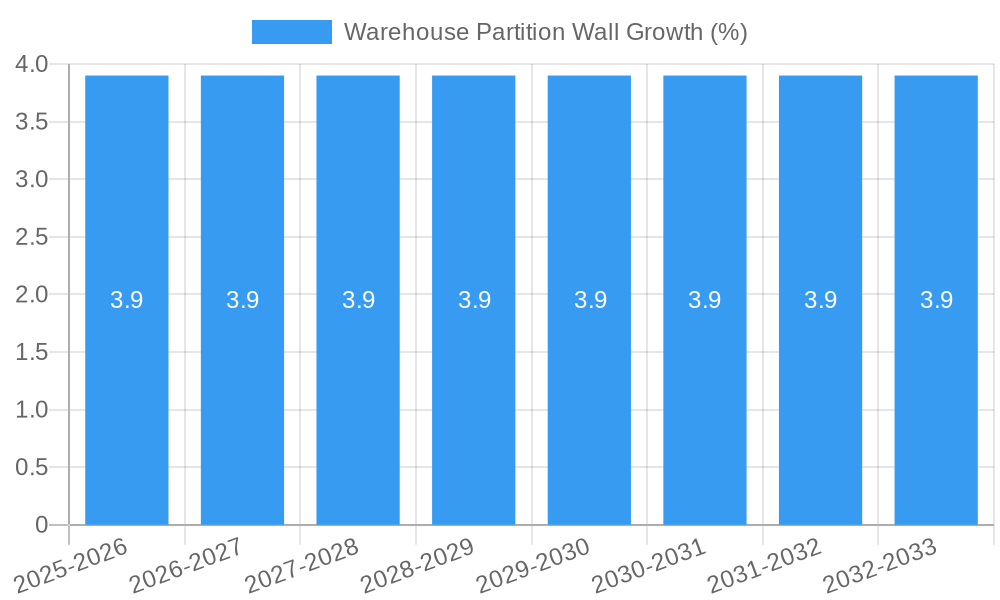
The warehouse partition wall market, currently valued at $130 million in 2025, is projected to experience steady growth with a compound annual growth rate (CAGR) of 3% from 2025 to 2033. This growth is driven by several factors, including the increasing demand for efficient warehouse space optimization, the need for improved inventory management and security, and a rise in e-commerce activities demanding more sophisticated warehouse layouts. Companies are seeking adaptable solutions to accommodate fluctuating storage needs and optimize workflow, leading to a strong demand for modular and easily reconfigurable partition walls. Furthermore, the growing adoption of lean manufacturing principles and the need to improve worker safety and productivity within warehouse environments also contribute to market expansion. The market is segmented by material type (e.g., metal, wood, fabric), height, and installation type, with metal partitions holding a significant share due to their durability and cost-effectiveness.
Major players in this market, including Troax, Axelent, Westgate Global, and others, are focusing on product innovation, introducing new designs with improved sound insulation, fire resistance, and aesthetic appeal. However, challenges remain. High initial investment costs for partition installation can deter smaller businesses. Fluctuations in raw material prices and potential supply chain disruptions could also impact market growth. To overcome these restraints, market players are increasingly exploring cost-effective manufacturing processes and partnerships to ensure reliable material sourcing and affordable solutions for a broader customer base. The market is likely to see increased consolidation as larger players acquire smaller companies to gain a larger market share and expand their geographical reach. The forecast period of 2025-2033 represents a significant opportunity for sustained growth in this sector.
Warehouse Partition Wall Market Report: 2019-2033
This comprehensive report provides an in-depth analysis of the global warehouse partition wall market, encompassing market dynamics, growth trends, regional performance, product landscape, and key players. The study period covers 2019-2033, with 2025 as the base year and forecast period spanning 2025-2033. The report is essential for industry professionals, investors, and strategic decision-makers seeking a granular understanding of this dynamic market. The market size is projected to reach xx million units by 2033.
Warehouse Partition Wall Market Dynamics & Structure
This section analyzes the competitive landscape, technological advancements, and regulatory influences shaping the warehouse partition wall market. The market exhibits a moderately consolidated structure, with key players such as Troax, Axelent, and Westgate Global holding significant market share. The market is characterized by continuous technological innovation, focusing on improved materials, enhanced safety features, and streamlined installation processes. Regulatory frameworks related to workplace safety and building codes significantly impact market growth. Furthermore, the report explores the influence of substitute products, end-user demographics (e.g., warehouse size, industry type), and the impact of mergers and acquisitions (M&A) activity.
- Market Concentration: Moderately consolidated, with the top 5 players holding approximately 45% market share in 2025.
- Technological Innovation: Focus on lightweight materials, modular designs, and automated installation methods.
- Regulatory Landscape: Compliance with OSHA and other safety regulations drives demand.
- Substitute Products: Solid walls, curtains, and other partitioning methods pose competition.
- M&A Activity: An estimated xx M&A deals were observed between 2019-2024, primarily driven by consolidation and expansion strategies. The forecast for 2025-2033 predicts xx more deals.
- End-User Demographics: Growth primarily driven by the expansion of e-commerce and the need for efficient warehouse space management.
Warehouse Partition Wall Growth Trends & Insights
The global warehouse partition wall market experienced significant growth during the historical period (2019-2024), driven by factors such as the expansion of e-commerce logistics, increased warehouse automation, and the growing need for improved warehouse organization. The market is expected to maintain a steady growth trajectory throughout the forecast period (2025-2033). This growth is attributed to several key trends, including the rising demand for flexible and adaptable warehouse spaces, the increasing adoption of advanced warehouse management systems, and the ongoing need for improved safety and security measures within warehouse environments. The CAGR for the forecast period is estimated at xx%. Market penetration is expected to increase from xx% in 2025 to xx% in 2033, driven by factors such as rising awareness of safety benefits and increased adoption in emerging economies. Technological disruptions such as improved materials and design are also impacting adoption.
Dominant Regions, Countries, or Segments in Warehouse Partition Wall
North America and Europe currently dominate the warehouse partition wall market, driven by robust manufacturing and logistics sectors. However, the Asia-Pacific region exhibits substantial growth potential, fueled by rapid industrialization and e-commerce expansion. The report offers detailed analysis of regional market dynamics, highlighting key drivers and growth potential.
- North America: Strong demand from the logistics and manufacturing industries. Key drivers include stringent safety regulations and an increase in warehouse automation.
- Europe: High adoption rates in developed economies, coupled with robust regulations in several countries.
- Asia-Pacific: High growth potential driven by rapid industrialization and e-commerce growth in countries like China and India.
- Other Regions: Steady growth supported by rising warehouse infrastructure development in emerging markets.
Warehouse Partition Wall Product Landscape
The warehouse partition wall market offers a diverse range of products, including metal partition walls, mesh partition walls, and PVC partition walls. Recent innovations have focused on improving material strength, reducing installation times, and enhancing safety features. Many products highlight modularity, ease of installation, and adaptability to various warehouse layouts, providing unique selling propositions. Technological advancements are centered around using lighter and stronger materials, improving soundproofing capabilities, and enhancing fire resistance.
Key Drivers, Barriers & Challenges in Warehouse Partition Wall
Key Drivers: Increasing demand for efficient warehouse management, stringent safety regulations, and growing e-commerce activities are significant drivers of market growth. Technological advancements, such as modular designs and easier installation methods, also contribute to market expansion.
Key Barriers and Challenges: Fluctuations in raw material prices, potential supply chain disruptions, and intense competition among existing players create significant challenges for market growth. Regulatory changes and evolving safety standards also add complexity for businesses in the industry. For example, a 10% increase in steel prices could lead to a 5% reduction in overall demand.
Emerging Opportunities in Warehouse Partition Wall
Emerging opportunities lie in the adoption of sustainable and eco-friendly materials, integration with smart warehouse technologies, and expansion into untapped markets in developing economies. Customization options and the increasing demand for aesthetically pleasing partitions are also creating lucrative opportunities. The development of partition systems that accommodate automated guided vehicles (AGVs) and other automated equipment represents a significant future opportunity.
Growth Accelerators in the Warehouse Partition Wall Industry
Technological innovations, strategic partnerships between material suppliers and partition manufacturers, and expansion into new geographic markets are key catalysts for long-term growth. The development of new materials with improved strength and durability, as well as the incorporation of smart technologies, will continue to drive market expansion.
Key Players Shaping the Warehouse Partition Wall Market
- Troax
- Axelent
- Westgate Global
- Allied Modular Building Systems
- National Partitions
- Cogan Wire and Metal Products
- Standard Wire & Steel Works
- Sponmech Safety Systems
- NSI Projects
- Zhejiang Weixin Storage Equipment
Notable Milestones in Warehouse Partition Wall Sector
- 2020: Introduction of a new lightweight and modular partition system by Troax.
- 2021: Axelent launches a fire-resistant partition wall.
- 2022: Merger between two smaller partition wall manufacturers leading to increased market consolidation.
- 2023: Several companies introduce partition walls compatible with warehouse automation systems.
- 2024: Increased focus on sustainable materials and manufacturing processes.
In-Depth Warehouse Partition Wall Market Outlook
The warehouse partition wall market is poised for continued growth, driven by technological advancements, expanding e-commerce, and robust industrial activity. Strategic partnerships, investments in R&D, and focusing on sustainable products will play a crucial role in shaping the future of this market. The market is expected to continue its expansion over the next decade, with significant opportunities for companies focusing on innovation and adaptability.
Warehouse Partition Wall Segmentation
-
1. Application
- 1.1. Warehousing and Logistics Center
- 1.2. General Manufacturing
- 1.3. Others
-
2. Type
- 2.1. Mesh Partition Wall
- 2.2. Drywall Partition Wall
- 2.3. Others
Warehouse Partition Wall Segmentation By Geography
-
1. North America
- 1.1. United States
- 1.2. Canada
- 1.3. Mexico
-
2. South America
- 2.1. Brazil
- 2.2. Argentina
- 2.3. Rest of South America
-
3. Europe
- 3.1. United Kingdom
- 3.2. Germany
- 3.3. France
- 3.4. Italy
- 3.5. Spain
- 3.6. Russia
- 3.7. Benelux
- 3.8. Nordics
- 3.9. Rest of Europe
-
4. Middle East & Africa
- 4.1. Turkey
- 4.2. Israel
- 4.3. GCC
- 4.4. North Africa
- 4.5. South Africa
- 4.6. Rest of Middle East & Africa
-
5. Asia Pacific
- 5.1. China
- 5.2. India
- 5.3. Japan
- 5.4. South Korea
- 5.5. ASEAN
- 5.6. Oceania
- 5.7. Rest of Asia Pacific

Warehouse Partition Wall REPORT HIGHLIGHTS
| Aspects | Details |
|---|---|
| Study Period | 2019-2033 |
| Base Year | 2024 |
| Estimated Year | 2025 |
| Forecast Period | 2025-2033 |
| Historical Period | 2019-2024 |
| Growth Rate | CAGR of 3% from 2019-2033 |
| Segmentation |
|
Table of Contents
- 1. Introduction
- 1.1. Research Scope
- 1.2. Market Segmentation
- 1.3. Research Methodology
- 1.4. Definitions and Assumptions
- 2. Executive Summary
- 2.1. Introduction
- 3. Market Dynamics
- 3.1. Introduction
- 3.2. Market Drivers
- 3.3. Market Restrains
- 3.4. Market Trends
- 4. Market Factor Analysis
- 4.1. Porters Five Forces
- 4.2. Supply/Value Chain
- 4.3. PESTEL analysis
- 4.4. Market Entropy
- 4.5. Patent/Trademark Analysis
- 5. Global Warehouse Partition Wall Analysis, Insights and Forecast, 2019-2031
- 5.1. Market Analysis, Insights and Forecast - by Application
- 5.1.1. Warehousing and Logistics Center
- 5.1.2. General Manufacturing
- 5.1.3. Others
- 5.2. Market Analysis, Insights and Forecast - by Type
- 5.2.1. Mesh Partition Wall
- 5.2.2. Drywall Partition Wall
- 5.2.3. Others
- 5.3. Market Analysis, Insights and Forecast - by Region
- 5.3.1. North America
- 5.3.2. South America
- 5.3.3. Europe
- 5.3.4. Middle East & Africa
- 5.3.5. Asia Pacific
- 5.1. Market Analysis, Insights and Forecast - by Application
- 6. North America Warehouse Partition Wall Analysis, Insights and Forecast, 2019-2031
- 6.1. Market Analysis, Insights and Forecast - by Application
- 6.1.1. Warehousing and Logistics Center
- 6.1.2. General Manufacturing
- 6.1.3. Others
- 6.2. Market Analysis, Insights and Forecast - by Type
- 6.2.1. Mesh Partition Wall
- 6.2.2. Drywall Partition Wall
- 6.2.3. Others
- 6.1. Market Analysis, Insights and Forecast - by Application
- 7. South America Warehouse Partition Wall Analysis, Insights and Forecast, 2019-2031
- 7.1. Market Analysis, Insights and Forecast - by Application
- 7.1.1. Warehousing and Logistics Center
- 7.1.2. General Manufacturing
- 7.1.3. Others
- 7.2. Market Analysis, Insights and Forecast - by Type
- 7.2.1. Mesh Partition Wall
- 7.2.2. Drywall Partition Wall
- 7.2.3. Others
- 7.1. Market Analysis, Insights and Forecast - by Application
- 8. Europe Warehouse Partition Wall Analysis, Insights and Forecast, 2019-2031
- 8.1. Market Analysis, Insights and Forecast - by Application
- 8.1.1. Warehousing and Logistics Center
- 8.1.2. General Manufacturing
- 8.1.3. Others
- 8.2. Market Analysis, Insights and Forecast - by Type
- 8.2.1. Mesh Partition Wall
- 8.2.2. Drywall Partition Wall
- 8.2.3. Others
- 8.1. Market Analysis, Insights and Forecast - by Application
- 9. Middle East & Africa Warehouse Partition Wall Analysis, Insights and Forecast, 2019-2031
- 9.1. Market Analysis, Insights and Forecast - by Application
- 9.1.1. Warehousing and Logistics Center
- 9.1.2. General Manufacturing
- 9.1.3. Others
- 9.2. Market Analysis, Insights and Forecast - by Type
- 9.2.1. Mesh Partition Wall
- 9.2.2. Drywall Partition Wall
- 9.2.3. Others
- 9.1. Market Analysis, Insights and Forecast - by Application
- 10. Asia Pacific Warehouse Partition Wall Analysis, Insights and Forecast, 2019-2031
- 10.1. Market Analysis, Insights and Forecast - by Application
- 10.1.1. Warehousing and Logistics Center
- 10.1.2. General Manufacturing
- 10.1.3. Others
- 10.2. Market Analysis, Insights and Forecast - by Type
- 10.2.1. Mesh Partition Wall
- 10.2.2. Drywall Partition Wall
- 10.2.3. Others
- 10.1. Market Analysis, Insights and Forecast - by Application
- 11. Competitive Analysis
- 11.1. Global Market Share Analysis 2024
- 11.2. Company Profiles
- 11.2.1 Troax
- 11.2.1.1. Overview
- 11.2.1.2. Products
- 11.2.1.3. SWOT Analysis
- 11.2.1.4. Recent Developments
- 11.2.1.5. Financials (Based on Availability)
- 11.2.2 Axelent
- 11.2.2.1. Overview
- 11.2.2.2. Products
- 11.2.2.3. SWOT Analysis
- 11.2.2.4. Recent Developments
- 11.2.2.5. Financials (Based on Availability)
- 11.2.3 Westgate Global
- 11.2.3.1. Overview
- 11.2.3.2. Products
- 11.2.3.3. SWOT Analysis
- 11.2.3.4. Recent Developments
- 11.2.3.5. Financials (Based on Availability)
- 11.2.4 Allied Modular Building Systems
- 11.2.4.1. Overview
- 11.2.4.2. Products
- 11.2.4.3. SWOT Analysis
- 11.2.4.4. Recent Developments
- 11.2.4.5. Financials (Based on Availability)
- 11.2.5 National Partitions
- 11.2.5.1. Overview
- 11.2.5.2. Products
- 11.2.5.3. SWOT Analysis
- 11.2.5.4. Recent Developments
- 11.2.5.5. Financials (Based on Availability)
- 11.2.6 Cogan Wire and Metal Products
- 11.2.6.1. Overview
- 11.2.6.2. Products
- 11.2.6.3. SWOT Analysis
- 11.2.6.4. Recent Developments
- 11.2.6.5. Financials (Based on Availability)
- 11.2.7 Standard Wire & Steel Works
- 11.2.7.1. Overview
- 11.2.7.2. Products
- 11.2.7.3. SWOT Analysis
- 11.2.7.4. Recent Developments
- 11.2.7.5. Financials (Based on Availability)
- 11.2.8 Sponmech Safety Systems
- 11.2.8.1. Overview
- 11.2.8.2. Products
- 11.2.8.3. SWOT Analysis
- 11.2.8.4. Recent Developments
- 11.2.8.5. Financials (Based on Availability)
- 11.2.9 NSI Projects
- 11.2.9.1. Overview
- 11.2.9.2. Products
- 11.2.9.3. SWOT Analysis
- 11.2.9.4. Recent Developments
- 11.2.9.5. Financials (Based on Availability)
- 11.2.10 Zhejiang Weixin Storage Equipment
- 11.2.10.1. Overview
- 11.2.10.2. Products
- 11.2.10.3. SWOT Analysis
- 11.2.10.4. Recent Developments
- 11.2.10.5. Financials (Based on Availability)
- 11.2.1 Troax
List of Figures
- Figure 1: Global Warehouse Partition Wall Revenue Breakdown (million, %) by Region 2024 & 2032
- Figure 2: Global Warehouse Partition Wall Volume Breakdown (K, %) by Region 2024 & 2032
- Figure 3: North America Warehouse Partition Wall Revenue (million), by Application 2024 & 2032
- Figure 4: North America Warehouse Partition Wall Volume (K), by Application 2024 & 2032
- Figure 5: North America Warehouse Partition Wall Revenue Share (%), by Application 2024 & 2032
- Figure 6: North America Warehouse Partition Wall Volume Share (%), by Application 2024 & 2032
- Figure 7: North America Warehouse Partition Wall Revenue (million), by Type 2024 & 2032
- Figure 8: North America Warehouse Partition Wall Volume (K), by Type 2024 & 2032
- Figure 9: North America Warehouse Partition Wall Revenue Share (%), by Type 2024 & 2032
- Figure 10: North America Warehouse Partition Wall Volume Share (%), by Type 2024 & 2032
- Figure 11: North America Warehouse Partition Wall Revenue (million), by Country 2024 & 2032
- Figure 12: North America Warehouse Partition Wall Volume (K), by Country 2024 & 2032
- Figure 13: North America Warehouse Partition Wall Revenue Share (%), by Country 2024 & 2032
- Figure 14: North America Warehouse Partition Wall Volume Share (%), by Country 2024 & 2032
- Figure 15: South America Warehouse Partition Wall Revenue (million), by Application 2024 & 2032
- Figure 16: South America Warehouse Partition Wall Volume (K), by Application 2024 & 2032
- Figure 17: South America Warehouse Partition Wall Revenue Share (%), by Application 2024 & 2032
- Figure 18: South America Warehouse Partition Wall Volume Share (%), by Application 2024 & 2032
- Figure 19: South America Warehouse Partition Wall Revenue (million), by Type 2024 & 2032
- Figure 20: South America Warehouse Partition Wall Volume (K), by Type 2024 & 2032
- Figure 21: South America Warehouse Partition Wall Revenue Share (%), by Type 2024 & 2032
- Figure 22: South America Warehouse Partition Wall Volume Share (%), by Type 2024 & 2032
- Figure 23: South America Warehouse Partition Wall Revenue (million), by Country 2024 & 2032
- Figure 24: South America Warehouse Partition Wall Volume (K), by Country 2024 & 2032
- Figure 25: South America Warehouse Partition Wall Revenue Share (%), by Country 2024 & 2032
- Figure 26: South America Warehouse Partition Wall Volume Share (%), by Country 2024 & 2032
- Figure 27: Europe Warehouse Partition Wall Revenue (million), by Application 2024 & 2032
- Figure 28: Europe Warehouse Partition Wall Volume (K), by Application 2024 & 2032
- Figure 29: Europe Warehouse Partition Wall Revenue Share (%), by Application 2024 & 2032
- Figure 30: Europe Warehouse Partition Wall Volume Share (%), by Application 2024 & 2032
- Figure 31: Europe Warehouse Partition Wall Revenue (million), by Type 2024 & 2032
- Figure 32: Europe Warehouse Partition Wall Volume (K), by Type 2024 & 2032
- Figure 33: Europe Warehouse Partition Wall Revenue Share (%), by Type 2024 & 2032
- Figure 34: Europe Warehouse Partition Wall Volume Share (%), by Type 2024 & 2032
- Figure 35: Europe Warehouse Partition Wall Revenue (million), by Country 2024 & 2032
- Figure 36: Europe Warehouse Partition Wall Volume (K), by Country 2024 & 2032
- Figure 37: Europe Warehouse Partition Wall Revenue Share (%), by Country 2024 & 2032
- Figure 38: Europe Warehouse Partition Wall Volume Share (%), by Country 2024 & 2032
- Figure 39: Middle East & Africa Warehouse Partition Wall Revenue (million), by Application 2024 & 2032
- Figure 40: Middle East & Africa Warehouse Partition Wall Volume (K), by Application 2024 & 2032
- Figure 41: Middle East & Africa Warehouse Partition Wall Revenue Share (%), by Application 2024 & 2032
- Figure 42: Middle East & Africa Warehouse Partition Wall Volume Share (%), by Application 2024 & 2032
- Figure 43: Middle East & Africa Warehouse Partition Wall Revenue (million), by Type 2024 & 2032
- Figure 44: Middle East & Africa Warehouse Partition Wall Volume (K), by Type 2024 & 2032
- Figure 45: Middle East & Africa Warehouse Partition Wall Revenue Share (%), by Type 2024 & 2032
- Figure 46: Middle East & Africa Warehouse Partition Wall Volume Share (%), by Type 2024 & 2032
- Figure 47: Middle East & Africa Warehouse Partition Wall Revenue (million), by Country 2024 & 2032
- Figure 48: Middle East & Africa Warehouse Partition Wall Volume (K), by Country 2024 & 2032
- Figure 49: Middle East & Africa Warehouse Partition Wall Revenue Share (%), by Country 2024 & 2032
- Figure 50: Middle East & Africa Warehouse Partition Wall Volume Share (%), by Country 2024 & 2032
- Figure 51: Asia Pacific Warehouse Partition Wall Revenue (million), by Application 2024 & 2032
- Figure 52: Asia Pacific Warehouse Partition Wall Volume (K), by Application 2024 & 2032
- Figure 53: Asia Pacific Warehouse Partition Wall Revenue Share (%), by Application 2024 & 2032
- Figure 54: Asia Pacific Warehouse Partition Wall Volume Share (%), by Application 2024 & 2032
- Figure 55: Asia Pacific Warehouse Partition Wall Revenue (million), by Type 2024 & 2032
- Figure 56: Asia Pacific Warehouse Partition Wall Volume (K), by Type 2024 & 2032
- Figure 57: Asia Pacific Warehouse Partition Wall Revenue Share (%), by Type 2024 & 2032
- Figure 58: Asia Pacific Warehouse Partition Wall Volume Share (%), by Type 2024 & 2032
- Figure 59: Asia Pacific Warehouse Partition Wall Revenue (million), by Country 2024 & 2032
- Figure 60: Asia Pacific Warehouse Partition Wall Volume (K), by Country 2024 & 2032
- Figure 61: Asia Pacific Warehouse Partition Wall Revenue Share (%), by Country 2024 & 2032
- Figure 62: Asia Pacific Warehouse Partition Wall Volume Share (%), by Country 2024 & 2032
List of Tables
- Table 1: Global Warehouse Partition Wall Revenue million Forecast, by Region 2019 & 2032
- Table 2: Global Warehouse Partition Wall Volume K Forecast, by Region 2019 & 2032
- Table 3: Global Warehouse Partition Wall Revenue million Forecast, by Application 2019 & 2032
- Table 4: Global Warehouse Partition Wall Volume K Forecast, by Application 2019 & 2032
- Table 5: Global Warehouse Partition Wall Revenue million Forecast, by Type 2019 & 2032
- Table 6: Global Warehouse Partition Wall Volume K Forecast, by Type 2019 & 2032
- Table 7: Global Warehouse Partition Wall Revenue million Forecast, by Region 2019 & 2032
- Table 8: Global Warehouse Partition Wall Volume K Forecast, by Region 2019 & 2032
- Table 9: Global Warehouse Partition Wall Revenue million Forecast, by Application 2019 & 2032
- Table 10: Global Warehouse Partition Wall Volume K Forecast, by Application 2019 & 2032
- Table 11: Global Warehouse Partition Wall Revenue million Forecast, by Type 2019 & 2032
- Table 12: Global Warehouse Partition Wall Volume K Forecast, by Type 2019 & 2032
- Table 13: Global Warehouse Partition Wall Revenue million Forecast, by Country 2019 & 2032
- Table 14: Global Warehouse Partition Wall Volume K Forecast, by Country 2019 & 2032
- Table 15: United States Warehouse Partition Wall Revenue (million) Forecast, by Application 2019 & 2032
- Table 16: United States Warehouse Partition Wall Volume (K) Forecast, by Application 2019 & 2032
- Table 17: Canada Warehouse Partition Wall Revenue (million) Forecast, by Application 2019 & 2032
- Table 18: Canada Warehouse Partition Wall Volume (K) Forecast, by Application 2019 & 2032
- Table 19: Mexico Warehouse Partition Wall Revenue (million) Forecast, by Application 2019 & 2032
- Table 20: Mexico Warehouse Partition Wall Volume (K) Forecast, by Application 2019 & 2032
- Table 21: Global Warehouse Partition Wall Revenue million Forecast, by Application 2019 & 2032
- Table 22: Global Warehouse Partition Wall Volume K Forecast, by Application 2019 & 2032
- Table 23: Global Warehouse Partition Wall Revenue million Forecast, by Type 2019 & 2032
- Table 24: Global Warehouse Partition Wall Volume K Forecast, by Type 2019 & 2032
- Table 25: Global Warehouse Partition Wall Revenue million Forecast, by Country 2019 & 2032
- Table 26: Global Warehouse Partition Wall Volume K Forecast, by Country 2019 & 2032
- Table 27: Brazil Warehouse Partition Wall Revenue (million) Forecast, by Application 2019 & 2032
- Table 28: Brazil Warehouse Partition Wall Volume (K) Forecast, by Application 2019 & 2032
- Table 29: Argentina Warehouse Partition Wall Revenue (million) Forecast, by Application 2019 & 2032
- Table 30: Argentina Warehouse Partition Wall Volume (K) Forecast, by Application 2019 & 2032
- Table 31: Rest of South America Warehouse Partition Wall Revenue (million) Forecast, by Application 2019 & 2032
- Table 32: Rest of South America Warehouse Partition Wall Volume (K) Forecast, by Application 2019 & 2032
- Table 33: Global Warehouse Partition Wall Revenue million Forecast, by Application 2019 & 2032
- Table 34: Global Warehouse Partition Wall Volume K Forecast, by Application 2019 & 2032
- Table 35: Global Warehouse Partition Wall Revenue million Forecast, by Type 2019 & 2032
- Table 36: Global Warehouse Partition Wall Volume K Forecast, by Type 2019 & 2032
- Table 37: Global Warehouse Partition Wall Revenue million Forecast, by Country 2019 & 2032
- Table 38: Global Warehouse Partition Wall Volume K Forecast, by Country 2019 & 2032
- Table 39: United Kingdom Warehouse Partition Wall Revenue (million) Forecast, by Application 2019 & 2032
- Table 40: United Kingdom Warehouse Partition Wall Volume (K) Forecast, by Application 2019 & 2032
- Table 41: Germany Warehouse Partition Wall Revenue (million) Forecast, by Application 2019 & 2032
- Table 42: Germany Warehouse Partition Wall Volume (K) Forecast, by Application 2019 & 2032
- Table 43: France Warehouse Partition Wall Revenue (million) Forecast, by Application 2019 & 2032
- Table 44: France Warehouse Partition Wall Volume (K) Forecast, by Application 2019 & 2032
- Table 45: Italy Warehouse Partition Wall Revenue (million) Forecast, by Application 2019 & 2032
- Table 46: Italy Warehouse Partition Wall Volume (K) Forecast, by Application 2019 & 2032
- Table 47: Spain Warehouse Partition Wall Revenue (million) Forecast, by Application 2019 & 2032
- Table 48: Spain Warehouse Partition Wall Volume (K) Forecast, by Application 2019 & 2032
- Table 49: Russia Warehouse Partition Wall Revenue (million) Forecast, by Application 2019 & 2032
- Table 50: Russia Warehouse Partition Wall Volume (K) Forecast, by Application 2019 & 2032
- Table 51: Benelux Warehouse Partition Wall Revenue (million) Forecast, by Application 2019 & 2032
- Table 52: Benelux Warehouse Partition Wall Volume (K) Forecast, by Application 2019 & 2032
- Table 53: Nordics Warehouse Partition Wall Revenue (million) Forecast, by Application 2019 & 2032
- Table 54: Nordics Warehouse Partition Wall Volume (K) Forecast, by Application 2019 & 2032
- Table 55: Rest of Europe Warehouse Partition Wall Revenue (million) Forecast, by Application 2019 & 2032
- Table 56: Rest of Europe Warehouse Partition Wall Volume (K) Forecast, by Application 2019 & 2032
- Table 57: Global Warehouse Partition Wall Revenue million Forecast, by Application 2019 & 2032
- Table 58: Global Warehouse Partition Wall Volume K Forecast, by Application 2019 & 2032
- Table 59: Global Warehouse Partition Wall Revenue million Forecast, by Type 2019 & 2032
- Table 60: Global Warehouse Partition Wall Volume K Forecast, by Type 2019 & 2032
- Table 61: Global Warehouse Partition Wall Revenue million Forecast, by Country 2019 & 2032
- Table 62: Global Warehouse Partition Wall Volume K Forecast, by Country 2019 & 2032
- Table 63: Turkey Warehouse Partition Wall Revenue (million) Forecast, by Application 2019 & 2032
- Table 64: Turkey Warehouse Partition Wall Volume (K) Forecast, by Application 2019 & 2032
- Table 65: Israel Warehouse Partition Wall Revenue (million) Forecast, by Application 2019 & 2032
- Table 66: Israel Warehouse Partition Wall Volume (K) Forecast, by Application 2019 & 2032
- Table 67: GCC Warehouse Partition Wall Revenue (million) Forecast, by Application 2019 & 2032
- Table 68: GCC Warehouse Partition Wall Volume (K) Forecast, by Application 2019 & 2032
- Table 69: North Africa Warehouse Partition Wall Revenue (million) Forecast, by Application 2019 & 2032
- Table 70: North Africa Warehouse Partition Wall Volume (K) Forecast, by Application 2019 & 2032
- Table 71: South Africa Warehouse Partition Wall Revenue (million) Forecast, by Application 2019 & 2032
- Table 72: South Africa Warehouse Partition Wall Volume (K) Forecast, by Application 2019 & 2032
- Table 73: Rest of Middle East & Africa Warehouse Partition Wall Revenue (million) Forecast, by Application 2019 & 2032
- Table 74: Rest of Middle East & Africa Warehouse Partition Wall Volume (K) Forecast, by Application 2019 & 2032
- Table 75: Global Warehouse Partition Wall Revenue million Forecast, by Application 2019 & 2032
- Table 76: Global Warehouse Partition Wall Volume K Forecast, by Application 2019 & 2032
- Table 77: Global Warehouse Partition Wall Revenue million Forecast, by Type 2019 & 2032
- Table 78: Global Warehouse Partition Wall Volume K Forecast, by Type 2019 & 2032
- Table 79: Global Warehouse Partition Wall Revenue million Forecast, by Country 2019 & 2032
- Table 80: Global Warehouse Partition Wall Volume K Forecast, by Country 2019 & 2032
- Table 81: China Warehouse Partition Wall Revenue (million) Forecast, by Application 2019 & 2032
- Table 82: China Warehouse Partition Wall Volume (K) Forecast, by Application 2019 & 2032
- Table 83: India Warehouse Partition Wall Revenue (million) Forecast, by Application 2019 & 2032
- Table 84: India Warehouse Partition Wall Volume (K) Forecast, by Application 2019 & 2032
- Table 85: Japan Warehouse Partition Wall Revenue (million) Forecast, by Application 2019 & 2032
- Table 86: Japan Warehouse Partition Wall Volume (K) Forecast, by Application 2019 & 2032
- Table 87: South Korea Warehouse Partition Wall Revenue (million) Forecast, by Application 2019 & 2032
- Table 88: South Korea Warehouse Partition Wall Volume (K) Forecast, by Application 2019 & 2032
- Table 89: ASEAN Warehouse Partition Wall Revenue (million) Forecast, by Application 2019 & 2032
- Table 90: ASEAN Warehouse Partition Wall Volume (K) Forecast, by Application 2019 & 2032
- Table 91: Oceania Warehouse Partition Wall Revenue (million) Forecast, by Application 2019 & 2032
- Table 92: Oceania Warehouse Partition Wall Volume (K) Forecast, by Application 2019 & 2032
- Table 93: Rest of Asia Pacific Warehouse Partition Wall Revenue (million) Forecast, by Application 2019 & 2032
- Table 94: Rest of Asia Pacific Warehouse Partition Wall Volume (K) Forecast, by Application 2019 & 2032
Frequently Asked Questions
1. What is the projected Compound Annual Growth Rate (CAGR) of the Warehouse Partition Wall?
The projected CAGR is approximately 3%.
2. Which companies are prominent players in the Warehouse Partition Wall?
Key companies in the market include Troax, Axelent, Westgate Global, Allied Modular Building Systems, National Partitions, Cogan Wire and Metal Products, Standard Wire & Steel Works, Sponmech Safety Systems, NSI Projects, Zhejiang Weixin Storage Equipment.
3. What are the main segments of the Warehouse Partition Wall?
The market segments include Application, Type.
4. Can you provide details about the market size?
The market size is estimated to be USD 130 million as of 2022.
5. What are some drivers contributing to market growth?
N/A
6. What are the notable trends driving market growth?
N/A
7. Are there any restraints impacting market growth?
N/A
8. Can you provide examples of recent developments in the market?
N/A
9. What pricing options are available for accessing the report?
Pricing options include single-user, multi-user, and enterprise licenses priced at USD 3950.00, USD 5925.00, and USD 7900.00 respectively.
10. Is the market size provided in terms of value or volume?
The market size is provided in terms of value, measured in million and volume, measured in K.
11. Are there any specific market keywords associated with the report?
Yes, the market keyword associated with the report is "Warehouse Partition Wall," which aids in identifying and referencing the specific market segment covered.
12. How do I determine which pricing option suits my needs best?
The pricing options vary based on user requirements and access needs. Individual users may opt for single-user licenses, while businesses requiring broader access may choose multi-user or enterprise licenses for cost-effective access to the report.
13. Are there any additional resources or data provided in the Warehouse Partition Wall report?
While the report offers comprehensive insights, it's advisable to review the specific contents or supplementary materials provided to ascertain if additional resources or data are available.
14. How can I stay updated on further developments or reports in the Warehouse Partition Wall?
To stay informed about further developments, trends, and reports in the Warehouse Partition Wall, consider subscribing to industry newsletters, following relevant companies and organizations, or regularly checking reputable industry news sources and publications.
Methodology
Step 1 - Identification of Relevant Samples Size from Population Database


Step 2 - Approaches for Defining Global Market Size (Value, Volume* & Price*)

Note*: In applicable scenarios
Step 3 - Data Sources
Primary Research
- Web Analytics
- Survey Reports
- Research Institute
- Latest Research Reports
- Opinion Leaders
Secondary Research
- Annual Reports
- White Paper
- Latest Press Release
- Industry Association
- Paid Database
- Investor Presentations

Step 4 - Data Triangulation
Involves using different sources of information in order to increase the validity of a study
These sources are likely to be stakeholders in a program - participants, other researchers, program staff, other community members, and so on.
Then we put all data in single framework & apply various statistical tools to find out the dynamic on the market.
During the analysis stage, feedback from the stakeholder groups would be compared to determine areas of agreement as well as areas of divergence
