

Key Insights
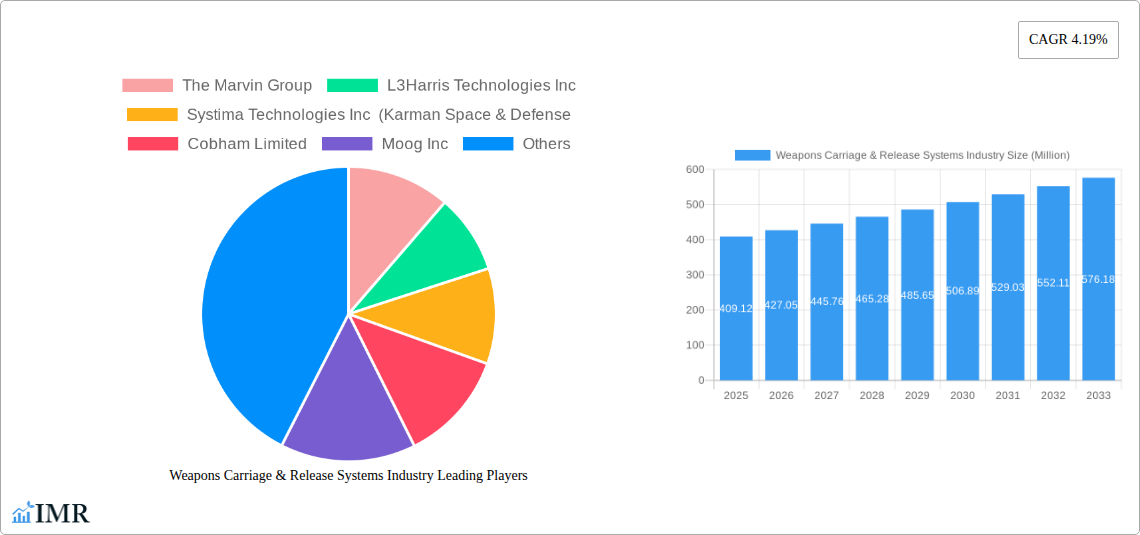
The global Weapons Carriage & Release Systems market, valued at $409.12 million in 2025, is projected to experience steady growth, driven by increasing defense budgets worldwide and the ongoing demand for advanced aerial warfare capabilities. The market's Compound Annual Growth Rate (CAGR) of 4.19% from 2025 to 2033 indicates a consistent expansion, fueled by technological advancements in precision-guided munitions and the integration of smart systems into existing and next-generation aircraft, helicopters, and unmanned aerial vehicles (UAVs). Key drivers include the modernization of existing weapon platforms, the development of next-generation fighter jets, and the increasing adoption of UAVs for both military and civilian applications. The segment for missiles holds a significant market share due to their long range and destructive power, while the aircraft platform segment remains dominant due to the prevalence of manned aircraft in military operations. Growth is however tempered by factors such as stringent regulatory approvals for new weapon systems and the high initial investment costs associated with their development and deployment. Furthermore, the geopolitical landscape plays a significant role, with regional conflicts and international tensions influencing defense spending and consequently, market growth. Competition within the market is intense, with established players like L3Harris Technologies Inc, RTX Corporation, and Moog Inc alongside specialized companies such as The Marvin Group and Systima Technologies Inc vying for market share through innovation and strategic partnerships.
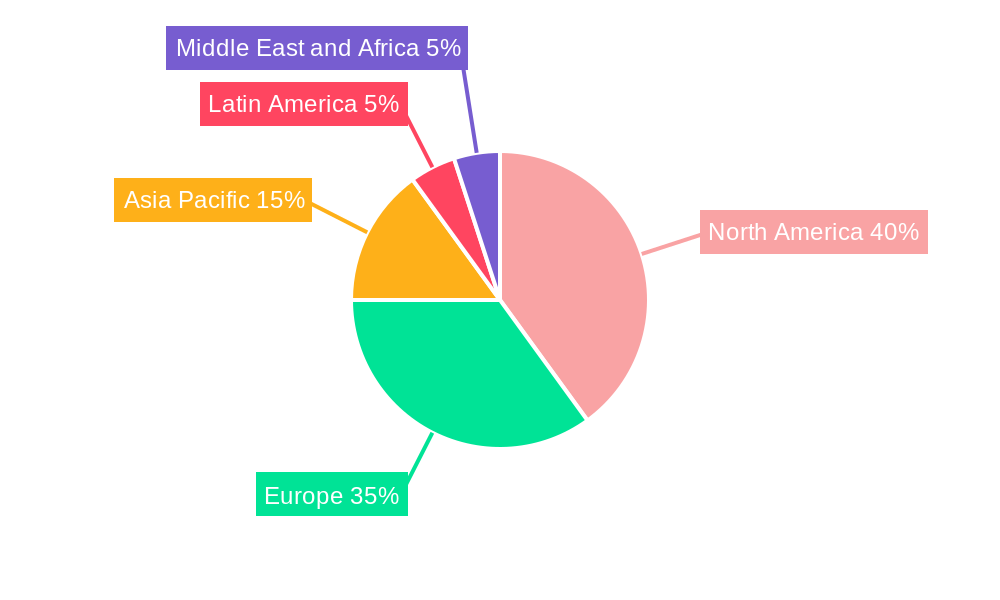
The geographical distribution of the market reveals a concentration of demand in North America and Europe, driven by strong defense capabilities and investments in advanced weapon systems. However, the Asia-Pacific region is expected to witness significant growth over the forecast period, propelled by increasing defense spending and modernization efforts in countries like India and China. The Middle East and Africa region also presents promising growth opportunities due to the region's focus on enhancing national security. Specific regional growth trajectories will depend on geopolitical factors, economic development, and specific defense procurement strategies adopted by various nations. The market's future trajectory will likely be shaped by the balance between technological advancements, geopolitical events, and the overall global economic climate. Continued innovation in areas such as smart munitions, improved targeting systems, and autonomous release mechanisms will be crucial for sustained market growth.
Weapons Carriage & Release Systems Industry Market Report: 2019-2033
This comprehensive report provides an in-depth analysis of the Weapons Carriage & Release Systems industry, encompassing market dynamics, growth trends, regional dominance, product landscape, and key player strategies. The study period covers 2019-2033, with a base year of 2025 and a forecast period of 2025-2033. This report is essential for industry professionals, investors, and strategic decision-makers seeking to understand and capitalize on opportunities within this dynamic sector. The parent market is the Defense and Aerospace industry and the child market is Weapon Systems.
Weapons Carriage & Release Systems Industry Market Dynamics & Structure
The Weapons Carriage & Release Systems market exhibits a moderately concentrated structure, with a few major players holding significant market share. Technological innovation, particularly in areas such as precision guidance and autonomous release mechanisms, is a key driver. Stringent regulatory frameworks, including export controls and safety standards, significantly influence market operations. Competitive substitutes, such as alternative weapon delivery methods, pose a challenge. End-user demographics, primarily comprising military forces globally, significantly shape market demand. Mergers and acquisitions (M&A) activity has been notable, with larger companies consolidating their market positions.
- Market Concentration: The top 5 players hold approximately xx% of the global market share in 2025 (estimated).
- M&A Activity: An estimated xx M&A deals occurred between 2019 and 2024, consolidating market power.
- Innovation Barriers: High R&D costs and stringent certification processes present significant barriers to entry for new players.
- Regulatory Landscape: Compliance with international arms trade treaties and national regulations impacts market growth and expansion.
Weapons Carriage & Release Systems Industry Growth Trends & Insights
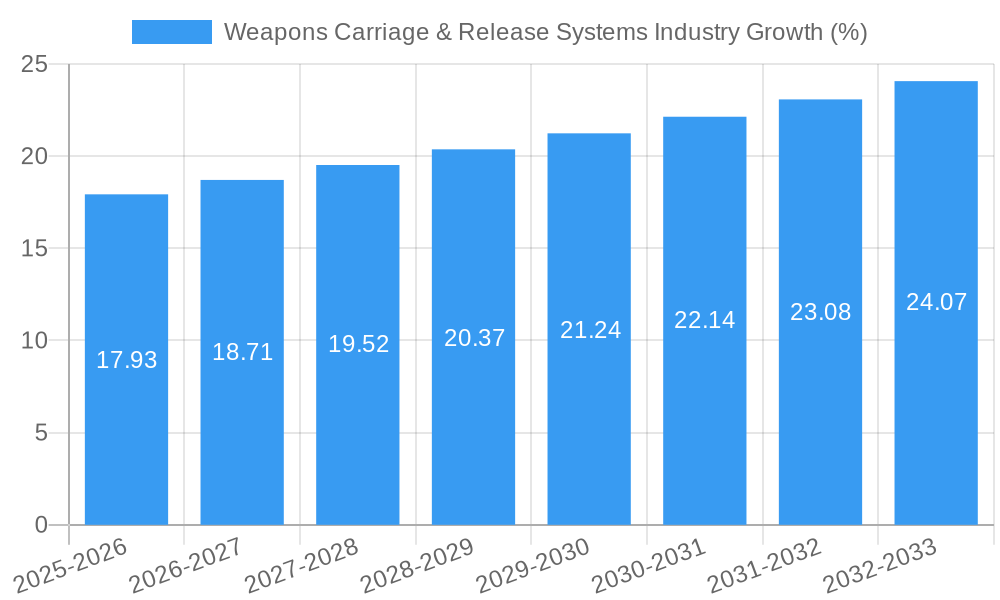
The global Weapons Carriage & Release Systems market is projected to experience significant growth throughout the forecast period (2025-2033). Driven by increasing defense budgets globally, modernization of existing weapon systems, and the rising adoption of unmanned aerial vehicles (UAVs), the market is expected to reach xx million units by 2033, exhibiting a Compound Annual Growth Rate (CAGR) of xx% during the forecast period. Technological advancements, such as the integration of advanced sensors and improved software, are enhancing system accuracy and effectiveness. A shift towards smart weapons and autonomous delivery systems is further shaping market dynamics. Market penetration is expected to increase significantly in developing nations due to growing defense spending and military modernization efforts.
Dominant Regions, Countries, or Segments in Weapons Carriage & Release Systems Industry
The North American region currently holds a dominant position in the Weapons Carriage & Release Systems market, driven by high defense expenditure and technological advancements. However, the Asia-Pacific region is projected to witness the fastest growth rate during the forecast period due to increasing military modernization efforts and geopolitical instability.
- Platform Dominance: Aircraft-based systems represent the largest segment, followed by helicopters and UAVs.
- Weapon Type Dominance: Missiles constitute the largest share of the market, driven by their precision and long-range capabilities.
- Key Drivers (North America): Robust defense budgets, technological innovation hubs, and strong domestic demand.
- Key Drivers (Asia-Pacific): Growing defense spending, regional conflicts, and modernization of armed forces.
- Market Share (2025): North America (xx%), Asia-Pacific (xx%), Europe (xx%), Rest of World (xx%).
Weapons Carriage & Release Systems Industry Product Landscape
The Weapons Carriage & Release Systems market encompasses a diverse range of products, including sophisticated hardpoints, ejector racks, and smart release mechanisms. Innovations focus on improving accuracy, reducing weight, and enhancing compatibility with various weapon types and platforms. These systems are designed to seamlessly integrate with aircraft, helicopters, and UAVs, ensuring reliable and precise weapon delivery. Unique selling propositions include enhanced safety features, reduced maintenance requirements, and improved operational efficiency.
Key Drivers, Barriers & Challenges in Weapons Carriage & Release Systems Industry
Key Drivers:
- Increasing defense spending globally.
- Technological advancements in precision-guided munitions.
- Growing adoption of UAVs and other unmanned platforms.
Key Challenges:
- Stringent regulatory compliance and export control measures (estimated xx% impact on market growth).
- Supply chain disruptions and material cost volatility (estimated xx% impact on market profitability).
- Intense competition and technological obsolescence.
Emerging Opportunities in Weapons Carriage & Release Systems Industry
- Development of next-generation smart weapons and autonomous delivery systems.
- Expansion into emerging markets with growing defense budgets.
- Integration of advanced sensors and improved software for enhanced precision and effectiveness.
Growth Accelerators in the Weapons Carriage & Release Systems Industry Industry
Technological breakthroughs in areas like AI-powered targeting systems and advanced materials are key growth catalysts. Strategic partnerships between defense contractors and technology providers are driving innovation and efficiency. Expansion into new markets and diversification of product offerings are enhancing market reach and revenue streams.
Key Players Shaping the Weapons Carriage & Release Systems Market
- The Marvin Group
- L3Harris Technologies Inc
- Systima Technologies Inc
- Karman Space & Defense
- Cobham Limited
- Moog Inc
- RTX Corporation
- Alkan
- Marotta Controls Inc
Notable Milestones in Weapons Carriage & Release Systems Industry Sector
- 2021: RTX Corporation announced a new generation of smart release mechanism.
- 2022: L3Harris Technologies Inc acquired a smaller competitor specializing in UAV weapon systems.
- 2023: Significant advancements in AI-powered targeting systems were demonstrated.
In-Depth Weapons Carriage & Release Systems Industry Market Outlook
The future of the Weapons Carriage & Release Systems market is promising, driven by sustained defense modernization efforts globally. Strategic investments in R&D, the adoption of advanced technologies, and expanding partnerships are expected to create new opportunities and accelerate market growth. Companies that can adapt quickly to evolving technological landscapes and regulatory environments are poised to thrive in this dynamic sector.
Weapons Carriage & Release Systems Industry Segmentation
-
1. Platform
- 1.1. Aircraft
- 1.2. Helicopters
- 1.3. Unmanned Aerial Vehicles
-
2. Weapon Type
- 2.1. Missiles
- 2.2. Bombs
- 3. Geography
-
4. North America
- 4.1. United States
- 4.2. Canada
-
5. Europe
- 5.1. United Kingdom
- 5.2. France
- 5.3. Germany
- 5.4. Russia
- 5.5. Rest of Europe
-
6. Asia-Pacific
- 6.1. China
- 6.2. India
- 6.3. Japan
- 6.4. South Korea
- 6.5. Rest of Asia-Pacific
-
7. Latin America
- 7.1. Brazil
- 7.2. Mexico
- 7.3. Rest of Latin America
-
8. Middle East and Africa
- 8.1. United Arab Emirates
- 8.2. Saudi Arabia
- 8.3. Turkey
- 8.4. South Africa
- 8.5. Rest of Middle East and Africa
Weapons Carriage & Release Systems Industry Segmentation By Geography
-
1. North America
- 1.1. United States
- 1.2. Canada
- 1.3. Mexico
-
2. South America
- 2.1. Brazil
- 2.2. Argentina
- 2.3. Rest of South America
-
3. Europe
- 3.1. United Kingdom
- 3.2. Germany
- 3.3. France
- 3.4. Italy
- 3.5. Spain
- 3.6. Russia
- 3.7. Benelux
- 3.8. Nordics
- 3.9. Rest of Europe
-
4. Middle East & Africa
- 4.1. Turkey
- 4.2. Israel
- 4.3. GCC
- 4.4. North Africa
- 4.5. South Africa
- 4.6. Rest of Middle East & Africa
-
5. Asia Pacific
- 5.1. China
- 5.2. India
- 5.3. Japan
- 5.4. South Korea
- 5.5. ASEAN
- 5.6. Oceania
- 5.7. Rest of Asia Pacific
Weapons Carriage & Release Systems Industry REPORT HIGHLIGHTS
| Aspects | Details |
|---|---|
| Study Period | 2019-2033 |
| Base Year | 2024 |
| Estimated Year | 2025 |
| Forecast Period | 2025-2033 |
| Historical Period | 2019-2024 |
| Growth Rate | CAGR of 4.19% from 2019-2033 |
| Segmentation |
|
Table of Contents
- 1. Introduction
- 1.1. Research Scope
- 1.2. Market Segmentation
- 1.3. Research Methodology
- 1.4. Definitions and Assumptions
- 2. Executive Summary
- 2.1. Introduction
- 3. Market Dynamics
- 3.1. Introduction
- 3.2. Market Drivers
- 3.3. Market Restrains
- 3.4. Market Trends
- 3.4.1. Aircraft Platform to Dominate the Market
- 4. Market Factor Analysis
- 4.1. Porters Five Forces
- 4.2. Supply/Value Chain
- 4.3. PESTEL analysis
- 4.4. Market Entropy
- 4.5. Patent/Trademark Analysis
- 5. Global Weapons Carriage & Release Systems Industry Analysis, Insights and Forecast, 2019-2031
- 5.1. Market Analysis, Insights and Forecast - by Platform
- 5.1.1. Aircraft
- 5.1.2. Helicopters
- 5.1.3. Unmanned Aerial Vehicles
- 5.2. Market Analysis, Insights and Forecast - by Weapon Type
- 5.2.1. Missiles
- 5.2.2. Bombs
- 5.3. Market Analysis, Insights and Forecast - by Geography
- 5.4. Market Analysis, Insights and Forecast - by North America
- 5.4.1. United States
- 5.4.2. Canada
- 5.5. Market Analysis, Insights and Forecast - by Europe
- 5.5.1. United Kingdom
- 5.5.2. France
- 5.5.3. Germany
- 5.5.4. Russia
- 5.5.5. Rest of Europe
- 5.6. Market Analysis, Insights and Forecast - by Asia-Pacific
- 5.6.1. China
- 5.6.2. India
- 5.6.3. Japan
- 5.6.4. South Korea
- 5.6.5. Rest of Asia-Pacific
- 5.7. Market Analysis, Insights and Forecast - by Latin America
- 5.7.1. Brazil
- 5.7.2. Mexico
- 5.7.3. Rest of Latin America
- 5.8. Market Analysis, Insights and Forecast - by Middle East and Africa
- 5.8.1. United Arab Emirates
- 5.8.2. Saudi Arabia
- 5.8.3. Turkey
- 5.8.4. South Africa
- 5.8.5. Rest of Middle East and Africa
- 5.9. Market Analysis, Insights and Forecast - by Region
- 5.9.1. North America
- 5.9.2. South America
- 5.9.3. Europe
- 5.9.4. Middle East & Africa
- 5.9.5. Asia Pacific
- 5.1. Market Analysis, Insights and Forecast - by Platform
- 6. North America Weapons Carriage & Release Systems Industry Analysis, Insights and Forecast, 2019-2031
- 6.1. Market Analysis, Insights and Forecast - by Platform
- 6.1.1. Aircraft
- 6.1.2. Helicopters
- 6.1.3. Unmanned Aerial Vehicles
- 6.2. Market Analysis, Insights and Forecast - by Weapon Type
- 6.2.1. Missiles
- 6.2.2. Bombs
- 6.3. Market Analysis, Insights and Forecast - by Geography
- 6.4. Market Analysis, Insights and Forecast - by North America
- 6.4.1. United States
- 6.4.2. Canada
- 6.5. Market Analysis, Insights and Forecast - by Europe
- 6.5.1. United Kingdom
- 6.5.2. France
- 6.5.3. Germany
- 6.5.4. Russia
- 6.5.5. Rest of Europe
- 6.6. Market Analysis, Insights and Forecast - by Asia-Pacific
- 6.6.1. China
- 6.6.2. India
- 6.6.3. Japan
- 6.6.4. South Korea
- 6.6.5. Rest of Asia-Pacific
- 6.7. Market Analysis, Insights and Forecast - by Latin America
- 6.7.1. Brazil
- 6.7.2. Mexico
- 6.7.3. Rest of Latin America
- 6.8. Market Analysis, Insights and Forecast - by Middle East and Africa
- 6.8.1. United Arab Emirates
- 6.8.2. Saudi Arabia
- 6.8.3. Turkey
- 6.8.4. South Africa
- 6.8.5. Rest of Middle East and Africa
- 6.1. Market Analysis, Insights and Forecast - by Platform
- 7. South America Weapons Carriage & Release Systems Industry Analysis, Insights and Forecast, 2019-2031
- 7.1. Market Analysis, Insights and Forecast - by Platform
- 7.1.1. Aircraft
- 7.1.2. Helicopters
- 7.1.3. Unmanned Aerial Vehicles
- 7.2. Market Analysis, Insights and Forecast - by Weapon Type
- 7.2.1. Missiles
- 7.2.2. Bombs
- 7.3. Market Analysis, Insights and Forecast - by Geography
- 7.4. Market Analysis, Insights and Forecast - by North America
- 7.4.1. United States
- 7.4.2. Canada
- 7.5. Market Analysis, Insights and Forecast - by Europe
- 7.5.1. United Kingdom
- 7.5.2. France
- 7.5.3. Germany
- 7.5.4. Russia
- 7.5.5. Rest of Europe
- 7.6. Market Analysis, Insights and Forecast - by Asia-Pacific
- 7.6.1. China
- 7.6.2. India
- 7.6.3. Japan
- 7.6.4. South Korea
- 7.6.5. Rest of Asia-Pacific
- 7.7. Market Analysis, Insights and Forecast - by Latin America
- 7.7.1. Brazil
- 7.7.2. Mexico
- 7.7.3. Rest of Latin America
- 7.8. Market Analysis, Insights and Forecast - by Middle East and Africa
- 7.8.1. United Arab Emirates
- 7.8.2. Saudi Arabia
- 7.8.3. Turkey
- 7.8.4. South Africa
- 7.8.5. Rest of Middle East and Africa
- 7.1. Market Analysis, Insights and Forecast - by Platform
- 8. Europe Weapons Carriage & Release Systems Industry Analysis, Insights and Forecast, 2019-2031
- 8.1. Market Analysis, Insights and Forecast - by Platform
- 8.1.1. Aircraft
- 8.1.2. Helicopters
- 8.1.3. Unmanned Aerial Vehicles
- 8.2. Market Analysis, Insights and Forecast - by Weapon Type
- 8.2.1. Missiles
- 8.2.2. Bombs
- 8.3. Market Analysis, Insights and Forecast - by Geography
- 8.4. Market Analysis, Insights and Forecast - by North America
- 8.4.1. United States
- 8.4.2. Canada
- 8.5. Market Analysis, Insights and Forecast - by Europe
- 8.5.1. United Kingdom
- 8.5.2. France
- 8.5.3. Germany
- 8.5.4. Russia
- 8.5.5. Rest of Europe
- 8.6. Market Analysis, Insights and Forecast - by Asia-Pacific
- 8.6.1. China
- 8.6.2. India
- 8.6.3. Japan
- 8.6.4. South Korea
- 8.6.5. Rest of Asia-Pacific
- 8.7. Market Analysis, Insights and Forecast - by Latin America
- 8.7.1. Brazil
- 8.7.2. Mexico
- 8.7.3. Rest of Latin America
- 8.8. Market Analysis, Insights and Forecast - by Middle East and Africa
- 8.8.1. United Arab Emirates
- 8.8.2. Saudi Arabia
- 8.8.3. Turkey
- 8.8.4. South Africa
- 8.8.5. Rest of Middle East and Africa
- 8.1. Market Analysis, Insights and Forecast - by Platform
- 9. Middle East & Africa Weapons Carriage & Release Systems Industry Analysis, Insights and Forecast, 2019-2031
- 9.1. Market Analysis, Insights and Forecast - by Platform
- 9.1.1. Aircraft
- 9.1.2. Helicopters
- 9.1.3. Unmanned Aerial Vehicles
- 9.2. Market Analysis, Insights and Forecast - by Weapon Type
- 9.2.1. Missiles
- 9.2.2. Bombs
- 9.3. Market Analysis, Insights and Forecast - by Geography
- 9.4. Market Analysis, Insights and Forecast - by North America
- 9.4.1. United States
- 9.4.2. Canada
- 9.5. Market Analysis, Insights and Forecast - by Europe
- 9.5.1. United Kingdom
- 9.5.2. France
- 9.5.3. Germany
- 9.5.4. Russia
- 9.5.5. Rest of Europe
- 9.6. Market Analysis, Insights and Forecast - by Asia-Pacific
- 9.6.1. China
- 9.6.2. India
- 9.6.3. Japan
- 9.6.4. South Korea
- 9.6.5. Rest of Asia-Pacific
- 9.7. Market Analysis, Insights and Forecast - by Latin America
- 9.7.1. Brazil
- 9.7.2. Mexico
- 9.7.3. Rest of Latin America
- 9.8. Market Analysis, Insights and Forecast - by Middle East and Africa
- 9.8.1. United Arab Emirates
- 9.8.2. Saudi Arabia
- 9.8.3. Turkey
- 9.8.4. South Africa
- 9.8.5. Rest of Middle East and Africa
- 9.1. Market Analysis, Insights and Forecast - by Platform
- 10. Asia Pacific Weapons Carriage & Release Systems Industry Analysis, Insights and Forecast, 2019-2031
- 10.1. Market Analysis, Insights and Forecast - by Platform
- 10.1.1. Aircraft
- 10.1.2. Helicopters
- 10.1.3. Unmanned Aerial Vehicles
- 10.2. Market Analysis, Insights and Forecast - by Weapon Type
- 10.2.1. Missiles
- 10.2.2. Bombs
- 10.3. Market Analysis, Insights and Forecast - by Geography
- 10.4. Market Analysis, Insights and Forecast - by North America
- 10.4.1. United States
- 10.4.2. Canada
- 10.5. Market Analysis, Insights and Forecast - by Europe
- 10.5.1. United Kingdom
- 10.5.2. France
- 10.5.3. Germany
- 10.5.4. Russia
- 10.5.5. Rest of Europe
- 10.6. Market Analysis, Insights and Forecast - by Asia-Pacific
- 10.6.1. China
- 10.6.2. India
- 10.6.3. Japan
- 10.6.4. South Korea
- 10.6.5. Rest of Asia-Pacific
- 10.7. Market Analysis, Insights and Forecast - by Latin America
- 10.7.1. Brazil
- 10.7.2. Mexico
- 10.7.3. Rest of Latin America
- 10.8. Market Analysis, Insights and Forecast - by Middle East and Africa
- 10.8.1. United Arab Emirates
- 10.8.2. Saudi Arabia
- 10.8.3. Turkey
- 10.8.4. South Africa
- 10.8.5. Rest of Middle East and Africa
- 10.1. Market Analysis, Insights and Forecast - by Platform
- 11. North America Weapons Carriage & Release Systems Industry Analysis, Insights and Forecast, 2019-2031
- 11.1. Market Analysis, Insights and Forecast - By Country/Sub-region
- 11.1.1 United States
- 11.1.2 Canada
- 12. Europe Weapons Carriage & Release Systems Industry Analysis, Insights and Forecast, 2019-2031
- 12.1. Market Analysis, Insights and Forecast - By Country/Sub-region
- 12.1.1 Germany
- 12.1.2 United Kingdom
- 12.1.3 France
- 12.1.4 Russia
- 12.1.5 Rest of Europe
- 13. Asia Pacific Weapons Carriage & Release Systems Industry Analysis, Insights and Forecast, 2019-2031
- 13.1. Market Analysis, Insights and Forecast - By Country/Sub-region
- 13.1.1 India
- 13.1.2 China
- 13.1.3 Japan
- 13.1.4 South Korea
- 13.1.5 Rest of Asia Pacific
- 14. Latin America Weapons Carriage & Release Systems Industry Analysis, Insights and Forecast, 2019-2031
- 14.1. Market Analysis, Insights and Forecast - By Country/Sub-region
- 14.1.1 Brazil
- 14.1.2 Rest of Latin America
- 15. Middle East and Africa Weapons Carriage & Release Systems Industry Analysis, Insights and Forecast, 2019-2031
- 15.1. Market Analysis, Insights and Forecast - By Country/Sub-region
- 15.1.1 United Arab Emirates
- 15.1.2 Saudi Arabia
- 15.1.3 Israel
- 15.1.4 Rest of Middle East and Africa
- 16. Competitive Analysis
- 16.1. Global Market Share Analysis 2024
- 16.2. Company Profiles
- 16.2.1 The Marvin Group
- 16.2.1.1. Overview
- 16.2.1.2. Products
- 16.2.1.3. SWOT Analysis
- 16.2.1.4. Recent Developments
- 16.2.1.5. Financials (Based on Availability)
- 16.2.2 L3Harris Technologies Inc
- 16.2.2.1. Overview
- 16.2.2.2. Products
- 16.2.2.3. SWOT Analysis
- 16.2.2.4. Recent Developments
- 16.2.2.5. Financials (Based on Availability)
- 16.2.3 Systima Technologies Inc (Karman Space & Defense
- 16.2.3.1. Overview
- 16.2.3.2. Products
- 16.2.3.3. SWOT Analysis
- 16.2.3.4. Recent Developments
- 16.2.3.5. Financials (Based on Availability)
- 16.2.4 Cobham Limited
- 16.2.4.1. Overview
- 16.2.4.2. Products
- 16.2.4.3. SWOT Analysis
- 16.2.4.4. Recent Developments
- 16.2.4.5. Financials (Based on Availability)
- 16.2.5 Moog Inc
- 16.2.5.1. Overview
- 16.2.5.2. Products
- 16.2.5.3. SWOT Analysis
- 16.2.5.4. Recent Developments
- 16.2.5.5. Financials (Based on Availability)
- 16.2.6 RTX Corporation
- 16.2.6.1. Overview
- 16.2.6.2. Products
- 16.2.6.3. SWOT Analysis
- 16.2.6.4. Recent Developments
- 16.2.6.5. Financials (Based on Availability)
- 16.2.7 Alkan
- 16.2.7.1. Overview
- 16.2.7.2. Products
- 16.2.7.3. SWOT Analysis
- 16.2.7.4. Recent Developments
- 16.2.7.5. Financials (Based on Availability)
- 16.2.8 Marotta Controls Inc
- 16.2.8.1. Overview
- 16.2.8.2. Products
- 16.2.8.3. SWOT Analysis
- 16.2.8.4. Recent Developments
- 16.2.8.5. Financials (Based on Availability)
- 16.2.1 The Marvin Group
List of Figures
- Figure 1: Global Weapons Carriage & Release Systems Industry Revenue Breakdown (Million, %) by Region 2024 & 2032
- Figure 2: North America Weapons Carriage & Release Systems Industry Revenue (Million), by Country 2024 & 2032
- Figure 3: North America Weapons Carriage & Release Systems Industry Revenue Share (%), by Country 2024 & 2032
- Figure 4: Europe Weapons Carriage & Release Systems Industry Revenue (Million), by Country 2024 & 2032
- Figure 5: Europe Weapons Carriage & Release Systems Industry Revenue Share (%), by Country 2024 & 2032
- Figure 6: Asia Pacific Weapons Carriage & Release Systems Industry Revenue (Million), by Country 2024 & 2032
- Figure 7: Asia Pacific Weapons Carriage & Release Systems Industry Revenue Share (%), by Country 2024 & 2032
- Figure 8: Latin America Weapons Carriage & Release Systems Industry Revenue (Million), by Country 2024 & 2032
- Figure 9: Latin America Weapons Carriage & Release Systems Industry Revenue Share (%), by Country 2024 & 2032
- Figure 10: Middle East and Africa Weapons Carriage & Release Systems Industry Revenue (Million), by Country 2024 & 2032
- Figure 11: Middle East and Africa Weapons Carriage & Release Systems Industry Revenue Share (%), by Country 2024 & 2032
- Figure 12: North America Weapons Carriage & Release Systems Industry Revenue (Million), by Platform 2024 & 2032
- Figure 13: North America Weapons Carriage & Release Systems Industry Revenue Share (%), by Platform 2024 & 2032
- Figure 14: North America Weapons Carriage & Release Systems Industry Revenue (Million), by Weapon Type 2024 & 2032
- Figure 15: North America Weapons Carriage & Release Systems Industry Revenue Share (%), by Weapon Type 2024 & 2032
- Figure 16: North America Weapons Carriage & Release Systems Industry Revenue (Million), by Geography 2024 & 2032
- Figure 17: North America Weapons Carriage & Release Systems Industry Revenue Share (%), by Geography 2024 & 2032
- Figure 18: North America Weapons Carriage & Release Systems Industry Revenue (Million), by North America 2024 & 2032
- Figure 19: North America Weapons Carriage & Release Systems Industry Revenue Share (%), by North America 2024 & 2032
- Figure 20: North America Weapons Carriage & Release Systems Industry Revenue (Million), by Europe 2024 & 2032
- Figure 21: North America Weapons Carriage & Release Systems Industry Revenue Share (%), by Europe 2024 & 2032
- Figure 22: North America Weapons Carriage & Release Systems Industry Revenue (Million), by Asia-Pacific 2024 & 2032
- Figure 23: North America Weapons Carriage & Release Systems Industry Revenue Share (%), by Asia-Pacific 2024 & 2032
- Figure 24: North America Weapons Carriage & Release Systems Industry Revenue (Million), by Latin America 2024 & 2032
- Figure 25: North America Weapons Carriage & Release Systems Industry Revenue Share (%), by Latin America 2024 & 2032
- Figure 26: North America Weapons Carriage & Release Systems Industry Revenue (Million), by Middle East and Africa 2024 & 2032
- Figure 27: North America Weapons Carriage & Release Systems Industry Revenue Share (%), by Middle East and Africa 2024 & 2032
- Figure 28: North America Weapons Carriage & Release Systems Industry Revenue (Million), by Country 2024 & 2032
- Figure 29: North America Weapons Carriage & Release Systems Industry Revenue Share (%), by Country 2024 & 2032
- Figure 30: South America Weapons Carriage & Release Systems Industry Revenue (Million), by Platform 2024 & 2032
- Figure 31: South America Weapons Carriage & Release Systems Industry Revenue Share (%), by Platform 2024 & 2032
- Figure 32: South America Weapons Carriage & Release Systems Industry Revenue (Million), by Weapon Type 2024 & 2032
- Figure 33: South America Weapons Carriage & Release Systems Industry Revenue Share (%), by Weapon Type 2024 & 2032
- Figure 34: South America Weapons Carriage & Release Systems Industry Revenue (Million), by Geography 2024 & 2032
- Figure 35: South America Weapons Carriage & Release Systems Industry Revenue Share (%), by Geography 2024 & 2032
- Figure 36: South America Weapons Carriage & Release Systems Industry Revenue (Million), by North America 2024 & 2032
- Figure 37: South America Weapons Carriage & Release Systems Industry Revenue Share (%), by North America 2024 & 2032
- Figure 38: South America Weapons Carriage & Release Systems Industry Revenue (Million), by Europe 2024 & 2032
- Figure 39: South America Weapons Carriage & Release Systems Industry Revenue Share (%), by Europe 2024 & 2032
- Figure 40: South America Weapons Carriage & Release Systems Industry Revenue (Million), by Asia-Pacific 2024 & 2032
- Figure 41: South America Weapons Carriage & Release Systems Industry Revenue Share (%), by Asia-Pacific 2024 & 2032
- Figure 42: South America Weapons Carriage & Release Systems Industry Revenue (Million), by Latin America 2024 & 2032
- Figure 43: South America Weapons Carriage & Release Systems Industry Revenue Share (%), by Latin America 2024 & 2032
- Figure 44: South America Weapons Carriage & Release Systems Industry Revenue (Million), by Middle East and Africa 2024 & 2032
- Figure 45: South America Weapons Carriage & Release Systems Industry Revenue Share (%), by Middle East and Africa 2024 & 2032
- Figure 46: South America Weapons Carriage & Release Systems Industry Revenue (Million), by Country 2024 & 2032
- Figure 47: South America Weapons Carriage & Release Systems Industry Revenue Share (%), by Country 2024 & 2032
- Figure 48: Europe Weapons Carriage & Release Systems Industry Revenue (Million), by Platform 2024 & 2032
- Figure 49: Europe Weapons Carriage & Release Systems Industry Revenue Share (%), by Platform 2024 & 2032
- Figure 50: Europe Weapons Carriage & Release Systems Industry Revenue (Million), by Weapon Type 2024 & 2032
- Figure 51: Europe Weapons Carriage & Release Systems Industry Revenue Share (%), by Weapon Type 2024 & 2032
- Figure 52: Europe Weapons Carriage & Release Systems Industry Revenue (Million), by Geography 2024 & 2032
- Figure 53: Europe Weapons Carriage & Release Systems Industry Revenue Share (%), by Geography 2024 & 2032
- Figure 54: Europe Weapons Carriage & Release Systems Industry Revenue (Million), by North America 2024 & 2032
- Figure 55: Europe Weapons Carriage & Release Systems Industry Revenue Share (%), by North America 2024 & 2032
- Figure 56: Europe Weapons Carriage & Release Systems Industry Revenue (Million), by Europe 2024 & 2032
- Figure 57: Europe Weapons Carriage & Release Systems Industry Revenue Share (%), by Europe 2024 & 2032
- Figure 58: Europe Weapons Carriage & Release Systems Industry Revenue (Million), by Asia-Pacific 2024 & 2032
- Figure 59: Europe Weapons Carriage & Release Systems Industry Revenue Share (%), by Asia-Pacific 2024 & 2032
- Figure 60: Europe Weapons Carriage & Release Systems Industry Revenue (Million), by Latin America 2024 & 2032
- Figure 61: Europe Weapons Carriage & Release Systems Industry Revenue Share (%), by Latin America 2024 & 2032
- Figure 62: Europe Weapons Carriage & Release Systems Industry Revenue (Million), by Middle East and Africa 2024 & 2032
- Figure 63: Europe Weapons Carriage & Release Systems Industry Revenue Share (%), by Middle East and Africa 2024 & 2032
- Figure 64: Europe Weapons Carriage & Release Systems Industry Revenue (Million), by Country 2024 & 2032
- Figure 65: Europe Weapons Carriage & Release Systems Industry Revenue Share (%), by Country 2024 & 2032
- Figure 66: Middle East & Africa Weapons Carriage & Release Systems Industry Revenue (Million), by Platform 2024 & 2032
- Figure 67: Middle East & Africa Weapons Carriage & Release Systems Industry Revenue Share (%), by Platform 2024 & 2032
- Figure 68: Middle East & Africa Weapons Carriage & Release Systems Industry Revenue (Million), by Weapon Type 2024 & 2032
- Figure 69: Middle East & Africa Weapons Carriage & Release Systems Industry Revenue Share (%), by Weapon Type 2024 & 2032
- Figure 70: Middle East & Africa Weapons Carriage & Release Systems Industry Revenue (Million), by Geography 2024 & 2032
- Figure 71: Middle East & Africa Weapons Carriage & Release Systems Industry Revenue Share (%), by Geography 2024 & 2032
- Figure 72: Middle East & Africa Weapons Carriage & Release Systems Industry Revenue (Million), by North America 2024 & 2032
- Figure 73: Middle East & Africa Weapons Carriage & Release Systems Industry Revenue Share (%), by North America 2024 & 2032
- Figure 74: Middle East & Africa Weapons Carriage & Release Systems Industry Revenue (Million), by Europe 2024 & 2032
- Figure 75: Middle East & Africa Weapons Carriage & Release Systems Industry Revenue Share (%), by Europe 2024 & 2032
- Figure 76: Middle East & Africa Weapons Carriage & Release Systems Industry Revenue (Million), by Asia-Pacific 2024 & 2032
- Figure 77: Middle East & Africa Weapons Carriage & Release Systems Industry Revenue Share (%), by Asia-Pacific 2024 & 2032
- Figure 78: Middle East & Africa Weapons Carriage & Release Systems Industry Revenue (Million), by Latin America 2024 & 2032
- Figure 79: Middle East & Africa Weapons Carriage & Release Systems Industry Revenue Share (%), by Latin America 2024 & 2032
- Figure 80: Middle East & Africa Weapons Carriage & Release Systems Industry Revenue (Million), by Middle East and Africa 2024 & 2032
- Figure 81: Middle East & Africa Weapons Carriage & Release Systems Industry Revenue Share (%), by Middle East and Africa 2024 & 2032
- Figure 82: Middle East & Africa Weapons Carriage & Release Systems Industry Revenue (Million), by Country 2024 & 2032
- Figure 83: Middle East & Africa Weapons Carriage & Release Systems Industry Revenue Share (%), by Country 2024 & 2032
- Figure 84: Asia Pacific Weapons Carriage & Release Systems Industry Revenue (Million), by Platform 2024 & 2032
- Figure 85: Asia Pacific Weapons Carriage & Release Systems Industry Revenue Share (%), by Platform 2024 & 2032
- Figure 86: Asia Pacific Weapons Carriage & Release Systems Industry Revenue (Million), by Weapon Type 2024 & 2032
- Figure 87: Asia Pacific Weapons Carriage & Release Systems Industry Revenue Share (%), by Weapon Type 2024 & 2032
- Figure 88: Asia Pacific Weapons Carriage & Release Systems Industry Revenue (Million), by Geography 2024 & 2032
- Figure 89: Asia Pacific Weapons Carriage & Release Systems Industry Revenue Share (%), by Geography 2024 & 2032
- Figure 90: Asia Pacific Weapons Carriage & Release Systems Industry Revenue (Million), by North America 2024 & 2032
- Figure 91: Asia Pacific Weapons Carriage & Release Systems Industry Revenue Share (%), by North America 2024 & 2032
- Figure 92: Asia Pacific Weapons Carriage & Release Systems Industry Revenue (Million), by Europe 2024 & 2032
- Figure 93: Asia Pacific Weapons Carriage & Release Systems Industry Revenue Share (%), by Europe 2024 & 2032
- Figure 94: Asia Pacific Weapons Carriage & Release Systems Industry Revenue (Million), by Asia-Pacific 2024 & 2032
- Figure 95: Asia Pacific Weapons Carriage & Release Systems Industry Revenue Share (%), by Asia-Pacific 2024 & 2032
- Figure 96: Asia Pacific Weapons Carriage & Release Systems Industry Revenue (Million), by Latin America 2024 & 2032
- Figure 97: Asia Pacific Weapons Carriage & Release Systems Industry Revenue Share (%), by Latin America 2024 & 2032
- Figure 98: Asia Pacific Weapons Carriage & Release Systems Industry Revenue (Million), by Middle East and Africa 2024 & 2032
- Figure 99: Asia Pacific Weapons Carriage & Release Systems Industry Revenue Share (%), by Middle East and Africa 2024 & 2032
- Figure 100: Asia Pacific Weapons Carriage & Release Systems Industry Revenue (Million), by Country 2024 & 2032
- Figure 101: Asia Pacific Weapons Carriage & Release Systems Industry Revenue Share (%), by Country 2024 & 2032
List of Tables
- Table 1: Global Weapons Carriage & Release Systems Industry Revenue Million Forecast, by Region 2019 & 2032
- Table 2: Global Weapons Carriage & Release Systems Industry Revenue Million Forecast, by Platform 2019 & 2032
- Table 3: Global Weapons Carriage & Release Systems Industry Revenue Million Forecast, by Weapon Type 2019 & 2032
- Table 4: Global Weapons Carriage & Release Systems Industry Revenue Million Forecast, by Geography 2019 & 2032
- Table 5: Global Weapons Carriage & Release Systems Industry Revenue Million Forecast, by North America 2019 & 2032
- Table 6: Global Weapons Carriage & Release Systems Industry Revenue Million Forecast, by Europe 2019 & 2032
- Table 7: Global Weapons Carriage & Release Systems Industry Revenue Million Forecast, by Asia-Pacific 2019 & 2032
- Table 8: Global Weapons Carriage & Release Systems Industry Revenue Million Forecast, by Latin America 2019 & 2032
- Table 9: Global Weapons Carriage & Release Systems Industry Revenue Million Forecast, by Middle East and Africa 2019 & 2032
- Table 10: Global Weapons Carriage & Release Systems Industry Revenue Million Forecast, by Region 2019 & 2032
- Table 11: Global Weapons Carriage & Release Systems Industry Revenue Million Forecast, by Country 2019 & 2032
- Table 12: United States Weapons Carriage & Release Systems Industry Revenue (Million) Forecast, by Application 2019 & 2032
- Table 13: Canada Weapons Carriage & Release Systems Industry Revenue (Million) Forecast, by Application 2019 & 2032
- Table 14: Global Weapons Carriage & Release Systems Industry Revenue Million Forecast, by Country 2019 & 2032
- Table 15: Germany Weapons Carriage & Release Systems Industry Revenue (Million) Forecast, by Application 2019 & 2032
- Table 16: United Kingdom Weapons Carriage & Release Systems Industry Revenue (Million) Forecast, by Application 2019 & 2032
- Table 17: France Weapons Carriage & Release Systems Industry Revenue (Million) Forecast, by Application 2019 & 2032
- Table 18: Russia Weapons Carriage & Release Systems Industry Revenue (Million) Forecast, by Application 2019 & 2032
- Table 19: Rest of Europe Weapons Carriage & Release Systems Industry Revenue (Million) Forecast, by Application 2019 & 2032
- Table 20: Global Weapons Carriage & Release Systems Industry Revenue Million Forecast, by Country 2019 & 2032
- Table 21: India Weapons Carriage & Release Systems Industry Revenue (Million) Forecast, by Application 2019 & 2032
- Table 22: China Weapons Carriage & Release Systems Industry Revenue (Million) Forecast, by Application 2019 & 2032
- Table 23: Japan Weapons Carriage & Release Systems Industry Revenue (Million) Forecast, by Application 2019 & 2032
- Table 24: South Korea Weapons Carriage & Release Systems Industry Revenue (Million) Forecast, by Application 2019 & 2032
- Table 25: Rest of Asia Pacific Weapons Carriage & Release Systems Industry Revenue (Million) Forecast, by Application 2019 & 2032
- Table 26: Global Weapons Carriage & Release Systems Industry Revenue Million Forecast, by Country 2019 & 2032
- Table 27: Brazil Weapons Carriage & Release Systems Industry Revenue (Million) Forecast, by Application 2019 & 2032
- Table 28: Rest of Latin America Weapons Carriage & Release Systems Industry Revenue (Million) Forecast, by Application 2019 & 2032
- Table 29: Global Weapons Carriage & Release Systems Industry Revenue Million Forecast, by Country 2019 & 2032
- Table 30: United Arab Emirates Weapons Carriage & Release Systems Industry Revenue (Million) Forecast, by Application 2019 & 2032
- Table 31: Saudi Arabia Weapons Carriage & Release Systems Industry Revenue (Million) Forecast, by Application 2019 & 2032
- Table 32: Israel Weapons Carriage & Release Systems Industry Revenue (Million) Forecast, by Application 2019 & 2032
- Table 33: Rest of Middle East and Africa Weapons Carriage & Release Systems Industry Revenue (Million) Forecast, by Application 2019 & 2032
- Table 34: Global Weapons Carriage & Release Systems Industry Revenue Million Forecast, by Platform 2019 & 2032
- Table 35: Global Weapons Carriage & Release Systems Industry Revenue Million Forecast, by Weapon Type 2019 & 2032
- Table 36: Global Weapons Carriage & Release Systems Industry Revenue Million Forecast, by Geography 2019 & 2032
- Table 37: Global Weapons Carriage & Release Systems Industry Revenue Million Forecast, by North America 2019 & 2032
- Table 38: Global Weapons Carriage & Release Systems Industry Revenue Million Forecast, by Europe 2019 & 2032
- Table 39: Global Weapons Carriage & Release Systems Industry Revenue Million Forecast, by Asia-Pacific 2019 & 2032
- Table 40: Global Weapons Carriage & Release Systems Industry Revenue Million Forecast, by Latin America 2019 & 2032
- Table 41: Global Weapons Carriage & Release Systems Industry Revenue Million Forecast, by Middle East and Africa 2019 & 2032
- Table 42: Global Weapons Carriage & Release Systems Industry Revenue Million Forecast, by Country 2019 & 2032
- Table 43: United States Weapons Carriage & Release Systems Industry Revenue (Million) Forecast, by Application 2019 & 2032
- Table 44: Canada Weapons Carriage & Release Systems Industry Revenue (Million) Forecast, by Application 2019 & 2032
- Table 45: Mexico Weapons Carriage & Release Systems Industry Revenue (Million) Forecast, by Application 2019 & 2032
- Table 46: Global Weapons Carriage & Release Systems Industry Revenue Million Forecast, by Platform 2019 & 2032
- Table 47: Global Weapons Carriage & Release Systems Industry Revenue Million Forecast, by Weapon Type 2019 & 2032
- Table 48: Global Weapons Carriage & Release Systems Industry Revenue Million Forecast, by Geography 2019 & 2032
- Table 49: Global Weapons Carriage & Release Systems Industry Revenue Million Forecast, by North America 2019 & 2032
- Table 50: Global Weapons Carriage & Release Systems Industry Revenue Million Forecast, by Europe 2019 & 2032
- Table 51: Global Weapons Carriage & Release Systems Industry Revenue Million Forecast, by Asia-Pacific 2019 & 2032
- Table 52: Global Weapons Carriage & Release Systems Industry Revenue Million Forecast, by Latin America 2019 & 2032
- Table 53: Global Weapons Carriage & Release Systems Industry Revenue Million Forecast, by Middle East and Africa 2019 & 2032
- Table 54: Global Weapons Carriage & Release Systems Industry Revenue Million Forecast, by Country 2019 & 2032
- Table 55: Brazil Weapons Carriage & Release Systems Industry Revenue (Million) Forecast, by Application 2019 & 2032
- Table 56: Argentina Weapons Carriage & Release Systems Industry Revenue (Million) Forecast, by Application 2019 & 2032
- Table 57: Rest of South America Weapons Carriage & Release Systems Industry Revenue (Million) Forecast, by Application 2019 & 2032
- Table 58: Global Weapons Carriage & Release Systems Industry Revenue Million Forecast, by Platform 2019 & 2032
- Table 59: Global Weapons Carriage & Release Systems Industry Revenue Million Forecast, by Weapon Type 2019 & 2032
- Table 60: Global Weapons Carriage & Release Systems Industry Revenue Million Forecast, by Geography 2019 & 2032
- Table 61: Global Weapons Carriage & Release Systems Industry Revenue Million Forecast, by North America 2019 & 2032
- Table 62: Global Weapons Carriage & Release Systems Industry Revenue Million Forecast, by Europe 2019 & 2032
- Table 63: Global Weapons Carriage & Release Systems Industry Revenue Million Forecast, by Asia-Pacific 2019 & 2032
- Table 64: Global Weapons Carriage & Release Systems Industry Revenue Million Forecast, by Latin America 2019 & 2032
- Table 65: Global Weapons Carriage & Release Systems Industry Revenue Million Forecast, by Middle East and Africa 2019 & 2032
- Table 66: Global Weapons Carriage & Release Systems Industry Revenue Million Forecast, by Country 2019 & 2032
- Table 67: United Kingdom Weapons Carriage & Release Systems Industry Revenue (Million) Forecast, by Application 2019 & 2032
- Table 68: Germany Weapons Carriage & Release Systems Industry Revenue (Million) Forecast, by Application 2019 & 2032
- Table 69: France Weapons Carriage & Release Systems Industry Revenue (Million) Forecast, by Application 2019 & 2032
- Table 70: Italy Weapons Carriage & Release Systems Industry Revenue (Million) Forecast, by Application 2019 & 2032
- Table 71: Spain Weapons Carriage & Release Systems Industry Revenue (Million) Forecast, by Application 2019 & 2032
- Table 72: Russia Weapons Carriage & Release Systems Industry Revenue (Million) Forecast, by Application 2019 & 2032
- Table 73: Benelux Weapons Carriage & Release Systems Industry Revenue (Million) Forecast, by Application 2019 & 2032
- Table 74: Nordics Weapons Carriage & Release Systems Industry Revenue (Million) Forecast, by Application 2019 & 2032
- Table 75: Rest of Europe Weapons Carriage & Release Systems Industry Revenue (Million) Forecast, by Application 2019 & 2032
- Table 76: Global Weapons Carriage & Release Systems Industry Revenue Million Forecast, by Platform 2019 & 2032
- Table 77: Global Weapons Carriage & Release Systems Industry Revenue Million Forecast, by Weapon Type 2019 & 2032
- Table 78: Global Weapons Carriage & Release Systems Industry Revenue Million Forecast, by Geography 2019 & 2032
- Table 79: Global Weapons Carriage & Release Systems Industry Revenue Million Forecast, by North America 2019 & 2032
- Table 80: Global Weapons Carriage & Release Systems Industry Revenue Million Forecast, by Europe 2019 & 2032
- Table 81: Global Weapons Carriage & Release Systems Industry Revenue Million Forecast, by Asia-Pacific 2019 & 2032
- Table 82: Global Weapons Carriage & Release Systems Industry Revenue Million Forecast, by Latin America 2019 & 2032
- Table 83: Global Weapons Carriage & Release Systems Industry Revenue Million Forecast, by Middle East and Africa 2019 & 2032
- Table 84: Global Weapons Carriage & Release Systems Industry Revenue Million Forecast, by Country 2019 & 2032
- Table 85: Turkey Weapons Carriage & Release Systems Industry Revenue (Million) Forecast, by Application 2019 & 2032
- Table 86: Israel Weapons Carriage & Release Systems Industry Revenue (Million) Forecast, by Application 2019 & 2032
- Table 87: GCC Weapons Carriage & Release Systems Industry Revenue (Million) Forecast, by Application 2019 & 2032
- Table 88: North Africa Weapons Carriage & Release Systems Industry Revenue (Million) Forecast, by Application 2019 & 2032
- Table 89: South Africa Weapons Carriage & Release Systems Industry Revenue (Million) Forecast, by Application 2019 & 2032
- Table 90: Rest of Middle East & Africa Weapons Carriage & Release Systems Industry Revenue (Million) Forecast, by Application 2019 & 2032
- Table 91: Global Weapons Carriage & Release Systems Industry Revenue Million Forecast, by Platform 2019 & 2032
- Table 92: Global Weapons Carriage & Release Systems Industry Revenue Million Forecast, by Weapon Type 2019 & 2032
- Table 93: Global Weapons Carriage & Release Systems Industry Revenue Million Forecast, by Geography 2019 & 2032
- Table 94: Global Weapons Carriage & Release Systems Industry Revenue Million Forecast, by North America 2019 & 2032
- Table 95: Global Weapons Carriage & Release Systems Industry Revenue Million Forecast, by Europe 2019 & 2032
- Table 96: Global Weapons Carriage & Release Systems Industry Revenue Million Forecast, by Asia-Pacific 2019 & 2032
- Table 97: Global Weapons Carriage & Release Systems Industry Revenue Million Forecast, by Latin America 2019 & 2032
- Table 98: Global Weapons Carriage & Release Systems Industry Revenue Million Forecast, by Middle East and Africa 2019 & 2032
- Table 99: Global Weapons Carriage & Release Systems Industry Revenue Million Forecast, by Country 2019 & 2032
- Table 100: China Weapons Carriage & Release Systems Industry Revenue (Million) Forecast, by Application 2019 & 2032
- Table 101: India Weapons Carriage & Release Systems Industry Revenue (Million) Forecast, by Application 2019 & 2032
- Table 102: Japan Weapons Carriage & Release Systems Industry Revenue (Million) Forecast, by Application 2019 & 2032
- Table 103: South Korea Weapons Carriage & Release Systems Industry Revenue (Million) Forecast, by Application 2019 & 2032
- Table 104: ASEAN Weapons Carriage & Release Systems Industry Revenue (Million) Forecast, by Application 2019 & 2032
- Table 105: Oceania Weapons Carriage & Release Systems Industry Revenue (Million) Forecast, by Application 2019 & 2032
- Table 106: Rest of Asia Pacific Weapons Carriage & Release Systems Industry Revenue (Million) Forecast, by Application 2019 & 2032
Frequently Asked Questions
1. What is the projected Compound Annual Growth Rate (CAGR) of the Weapons Carriage & Release Systems Industry?
The projected CAGR is approximately 4.19%.
2. Which companies are prominent players in the Weapons Carriage & Release Systems Industry?
Key companies in the market include The Marvin Group, L3Harris Technologies Inc, Systima Technologies Inc (Karman Space & Defense, Cobham Limited, Moog Inc, RTX Corporation, Alkan, Marotta Controls Inc.
3. What are the main segments of the Weapons Carriage & Release Systems Industry?
The market segments include Platform, Weapon Type, Geography, North America, Europe, Asia-Pacific, Latin America, Middle East and Africa.
4. Can you provide details about the market size?
The market size is estimated to be USD 409.12 Million as of 2022.
5. What are some drivers contributing to market growth?
N/A
6. What are the notable trends driving market growth?
Aircraft Platform to Dominate the Market.
7. Are there any restraints impacting market growth?
N/A
8. Can you provide examples of recent developments in the market?
N/A
9. What pricing options are available for accessing the report?
Pricing options include single-user, multi-user, and enterprise licenses priced at USD 4750, USD 5250, and USD 8750 respectively.
10. Is the market size provided in terms of value or volume?
The market size is provided in terms of value, measured in Million.
11. Are there any specific market keywords associated with the report?
Yes, the market keyword associated with the report is "Weapons Carriage & Release Systems Industry," which aids in identifying and referencing the specific market segment covered.
12. How do I determine which pricing option suits my needs best?
The pricing options vary based on user requirements and access needs. Individual users may opt for single-user licenses, while businesses requiring broader access may choose multi-user or enterprise licenses for cost-effective access to the report.
13. Are there any additional resources or data provided in the Weapons Carriage & Release Systems Industry report?
While the report offers comprehensive insights, it's advisable to review the specific contents or supplementary materials provided to ascertain if additional resources or data are available.
14. How can I stay updated on further developments or reports in the Weapons Carriage & Release Systems Industry?
To stay informed about further developments, trends, and reports in the Weapons Carriage & Release Systems Industry, consider subscribing to industry newsletters, following relevant companies and organizations, or regularly checking reputable industry news sources and publications.
Methodology
Step 1 - Identification of Relevant Samples Size from Population Database


Step 2 - Approaches for Defining Global Market Size (Value, Volume* & Price*)

Note*: In applicable scenarios
Step 3 - Data Sources
Primary Research
- Web Analytics
- Survey Reports
- Research Institute
- Latest Research Reports
- Opinion Leaders
Secondary Research
- Annual Reports
- White Paper
- Latest Press Release
- Industry Association
- Paid Database
- Investor Presentations

Step 4 - Data Triangulation
Involves using different sources of information in order to increase the validity of a study
These sources are likely to be stakeholders in a program - participants, other researchers, program staff, other community members, and so on.
Then we put all data in single framework & apply various statistical tools to find out the dynamic on the market.
During the analysis stage, feedback from the stakeholder groups would be compared to determine areas of agreement as well as areas of divergence
