

Key Insights
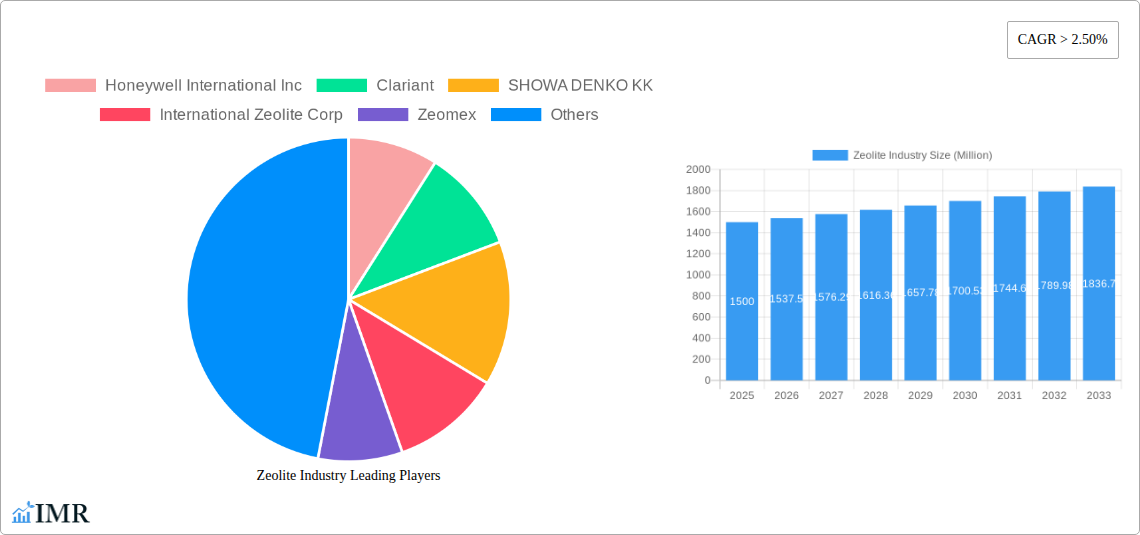
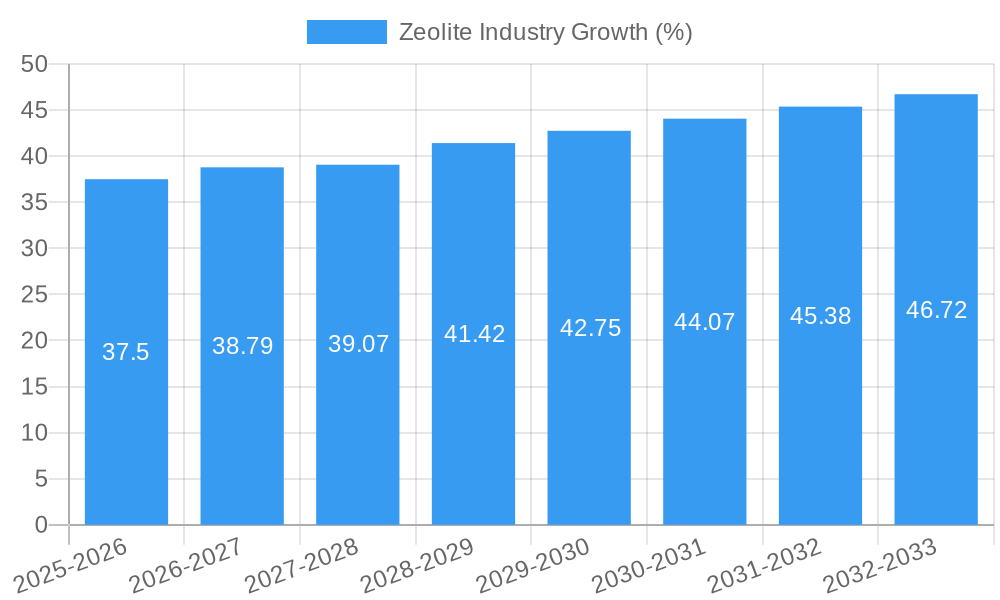
The global zeolite market is experiencing robust growth, projected to maintain a Compound Annual Growth Rate (CAGR) exceeding 2.5% from 2025 to 2033. This expansion is driven by the increasing demand across diverse applications, primarily in water treatment and air purification, fueled by stringent environmental regulations and growing awareness of water scarcity and air pollution. The substantial growth in the construction and petrochemical industries further contributes to the market's dynamism, as zeolites play a crucial role in various processes within these sectors. Synthetic zeolites are gaining significant traction due to their superior performance characteristics and consistency compared to natural zeolites, although the latter continues to hold market share owing to its cost-effectiveness in certain applications. The market is segmented by application (adsorbents, catalysts, detergents, and others), end-user industry (water treatment, air purification, agriculture, and others), and product type (natural and synthetic), offering diverse opportunities for market players. Key regional markets include North America, Europe, and Asia-Pacific, each exhibiting unique growth trajectories shaped by factors like industrial development, regulatory frameworks, and consumer preferences.
The competitive landscape is characterized by a mix of established multinational corporations and specialized zeolite producers. Companies like Honeywell International Inc., Clariant, and BASF SE hold significant market share, leveraging their technological expertise and extensive distribution networks. However, smaller, specialized players are also contributing to market innovation, particularly in niche applications like biogas processing and advanced water purification technologies. Future growth hinges on technological advancements, including the development of novel zeolite structures with enhanced performance characteristics and the exploration of sustainable and cost-effective production methods. Further expansion is expected as research continues to uncover new applications for zeolites in areas like carbon capture and renewable energy, paving the way for a sustained period of market expansion.
Zeolite Industry Market Report: 2019-2033
This comprehensive report provides a detailed analysis of the Zeolite industry, encompassing market dynamics, growth trends, regional segmentation, product landscape, key players, and future outlook. The study period covers 2019-2033, with 2025 as the base and estimated year. This report is invaluable for industry professionals, investors, and strategic decision-makers seeking a deep understanding of this dynamic sector.
Parent Market: Industrial Minerals Market (xx Million) Child Market: Zeolite Market (xx Million)
Zeolite Industry Market Dynamics & Structure
The global zeolite market, valued at xx million in 2024, is characterized by moderate concentration with several major players holding significant market share. Technological innovation, driven by advancements in synthesis techniques and application-specific modifications, is a key growth driver. Stringent environmental regulations, particularly regarding water and air purification, are shaping industry practices. Competitive pressures from alternative adsorbents and catalysts are also present. End-user demographics, with a growing focus on sustainability and environmental consciousness, are influencing market demand. Mergers and acquisitions (M&A) activity has been moderate, with xx deals recorded in the past five years, primarily focused on expanding product portfolios and geographical reach.
- Market Concentration: Moderately concentrated, with top 5 players holding approximately xx% market share.
- Technological Innovation: Focus on developing zeolites with enhanced adsorption capacity, selectivity, and thermal stability.
- Regulatory Framework: Stringent environmental regulations impacting water treatment and air purification applications.
- Competitive Substitutes: Activated carbon, silica gel, and other adsorbents pose competitive challenges.
- End-User Demographics: Growing demand from environmentally conscious consumers in water treatment and agriculture.
- M&A Trends: Moderate M&A activity, primarily for geographical expansion and product diversification.
Zeolite Industry Growth Trends & Insights
The global zeolite market exhibits a steady growth trajectory, driven by rising demand across various end-use industries. The historical period (2019-2024) witnessed a CAGR of xx%, primarily fueled by increased adoption in water treatment and the petrochemical sector. Technological disruptions, such as the development of novel zeolite structures and improved synthesis methods, are enhancing product performance and expanding application possibilities. Consumer behavior shifts towards sustainable solutions are also driving market growth. The forecast period (2025-2033) projects a CAGR of xx%, with significant growth expected in the agricultural and biogas segments. Market penetration in emerging economies is also anticipated to increase significantly.
Dominant Regions, Countries, or Segments in Zeolite Industry
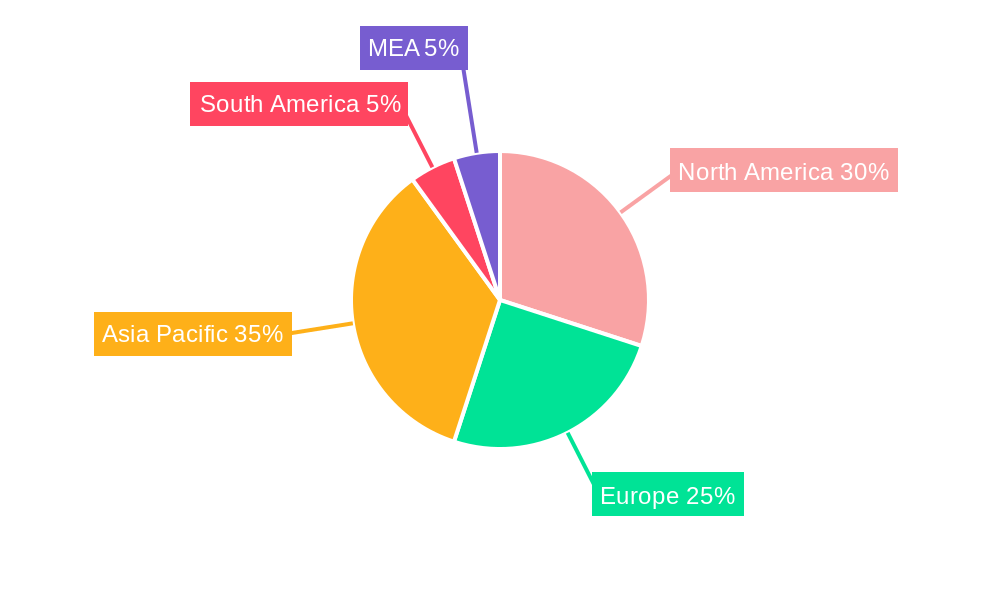
The North American region currently dominates the zeolite market, driven by robust demand from water treatment and petrochemical industries. However, Asia Pacific is projected to experience the fastest growth, fueled by expanding industrialization and rising environmental awareness. Within segments, the adsorbents application holds the largest market share, followed by catalysts. The water treatment end-user industry demonstrates significant growth potential, while the agricultural sector is emerging as a key growth driver.
- Key Drivers in North America: Strong regulatory framework for water treatment, established petrochemical industry.
- Key Drivers in Asia Pacific: Rapid industrialization, increasing environmental concerns, government initiatives for water purification.
- Dominant Application Segment: Adsorbents (xx million), driven by its extensive use in water purification and industrial processes.
- High-Growth End-User Industry: Agriculture (xx million), owing to the increasing use of zeolites in soil amendment and controlled-release fertilizers.
- Fastest-Growing Region: Asia-Pacific, projected to exhibit the highest CAGR during the forecast period.
Zeolite Industry Product Landscape
The zeolite product landscape encompasses natural and synthetic zeolites, each possessing unique properties catering to specific applications. Synthetic zeolites are increasingly preferred for their customizable properties and superior performance. Technological advancements focus on enhancing selectivity, stability, and cost-effectiveness. Unique selling propositions include high surface area, tunable pore size, and exceptional adsorption capacity. Innovations include the development of hierarchical zeolites and mesoporous zeolites for enhanced catalytic activity and improved mass transfer.
Key Drivers, Barriers & Challenges in Zeolite Industry
Key Drivers:
- Increasing demand for water purification and air pollution control solutions.
- Growing applications in the petrochemical and agricultural industries.
- Technological advancements leading to enhanced product performance.
- Favorable government policies and regulations supporting environmental protection.
Key Challenges:
- Fluctuations in raw material prices impacting production costs.
- Stringent regulatory compliance requirements.
- Competition from alternative adsorbents and catalysts.
- Supply chain disruptions impacting production and distribution.
Emerging Opportunities in Zeolite Industry
- Expansion into untapped markets, particularly in developing economies.
- Development of novel zeolite-based materials for specific applications (e.g., biomedical, energy storage).
- Growing interest in utilizing zeolites in carbon capture and storage technologies.
- Increasing demand for sustainable and environmentally friendly solutions.
Growth Accelerators in the Zeolite Industry Industry
Technological breakthroughs in zeolite synthesis and modification are key growth accelerators. Strategic partnerships and collaborations are facilitating market expansion. Investment in research and development, coupled with aggressive marketing strategies, are further driving market penetration. Expansion into emerging applications, such as biogas purification and advanced catalysts, are also contributing to long-term growth.
Key Players Shaping the Zeolite Industry Market
- Honeywell International Inc
- Clariant
- SHOWA DENKO KK
- International Zeolite Corp
- Zeomex
- Interra Global
- KNT Group
- ZEOCEM AS
- BASF SE
- Arkema Group
- Tosoh Corporation
- W R Grace & Co
- Zeolyst International Inc
Notable Milestones in Zeolite Industry Sector
- February 2022: International Zeolite Corp. secured a USD 2 million strategic investment from CoTec Holdings Corp. to accelerate its go-to-market activities in agriculture and green tech.
- December 2022: International Zeolite Corp. partnered with Niagara College's HESIC to conduct research on its NEREA grow system.
In-Depth Zeolite Industry Market Outlook
The future of the zeolite industry appears bright, driven by ongoing technological advancements, expanding applications, and rising environmental consciousness. Strategic partnerships and investments in research and development will further fuel market growth. The focus on sustainable solutions and addressing global challenges will create significant opportunities for innovation and market expansion, leading to substantial growth in the coming decade.
Zeolite Industry Segmentation
-
1. Product Type
- 1.1. Natural
- 1.2. Synthetic
-
2. Application
- 2.1. Adsorbents
- 2.2. Catalysts
- 2.3. Detergents
- 2.4. Other Applications (Refining, Biogas)
-
3. End-user Industry
- 3.1. Water Treatment
- 3.2. Air Purification
- 3.3. Agriculture
- 3.4. Petrochemical
- 3.5. Construction
- 3.6. Other En
Zeolite Industry Segmentation By Geography
-
1. Asia Pacific
- 1.1. China
- 1.2. India
- 1.3. Japan
- 1.4. South Korea
- 1.5. Rest of Asia Pacific
-
2. North America
- 2.1. United States
- 2.2. Canada
- 2.3. Mexico
-
3. Europe
- 3.1. Germany
- 3.2. United Kingdom
- 3.3. Italy
- 3.4. France
- 3.5. Rest of Europe
-
4. South America
- 4.1. Brazil
- 4.2. Argentina
- 4.3. Rest of South America
- 5. Middle East
-
6. Saudi Arabia
- 6.1. South Africa
- 6.2. Rest of Middle East
Zeolite Industry REPORT HIGHLIGHTS
| Aspects | Details |
|---|---|
| Study Period | 2019-2033 |
| Base Year | 2024 |
| Estimated Year | 2025 |
| Forecast Period | 2025-2033 |
| Historical Period | 2019-2024 |
| Growth Rate | CAGR of > 2.50% from 2019-2033 |
| Segmentation |
|
Table of Contents
- 1. Introduction
- 1.1. Research Scope
- 1.2. Market Segmentation
- 1.3. Research Methodology
- 1.4. Definitions and Assumptions
- 2. Executive Summary
- 2.1. Introduction
- 3. Market Dynamics
- 3.1. Introduction
- 3.2. Market Drivers
- 3.2.1. Increasing Demand from Water Treatment Industry; Increasing Use of Zeolite as Refrigeration Adsorbents; Significant Usage of Zeolites for Catalytic Cracking in the Petroleum Industry
- 3.3. Market Restrains
- 3.3.1. Usage of Substitutes for Zeolites
- 3.4. Market Trends
- 3.4.1. Agriculture Industry to Dominate the Market
- 4. Market Factor Analysis
- 4.1. Porters Five Forces
- 4.2. Supply/Value Chain
- 4.3. PESTEL analysis
- 4.4. Market Entropy
- 4.5. Patent/Trademark Analysis
- 5. Global Zeolite Industry Analysis, Insights and Forecast, 2019-2031
- 5.1. Market Analysis, Insights and Forecast - by Product Type
- 5.1.1. Natural
- 5.1.2. Synthetic
- 5.2. Market Analysis, Insights and Forecast - by Application
- 5.2.1. Adsorbents
- 5.2.2. Catalysts
- 5.2.3. Detergents
- 5.2.4. Other Applications (Refining, Biogas)
- 5.3. Market Analysis, Insights and Forecast - by End-user Industry
- 5.3.1. Water Treatment
- 5.3.2. Air Purification
- 5.3.3. Agriculture
- 5.3.4. Petrochemical
- 5.3.5. Construction
- 5.3.6. Other En
- 5.4. Market Analysis, Insights and Forecast - by Region
- 5.4.1. Asia Pacific
- 5.4.2. North America
- 5.4.3. Europe
- 5.4.4. South America
- 5.4.5. Middle East
- 5.4.6. Saudi Arabia
- 5.1. Market Analysis, Insights and Forecast - by Product Type
- 6. Asia Pacific Zeolite Industry Analysis, Insights and Forecast, 2019-2031
- 6.1. Market Analysis, Insights and Forecast - by Product Type
- 6.1.1. Natural
- 6.1.2. Synthetic
- 6.2. Market Analysis, Insights and Forecast - by Application
- 6.2.1. Adsorbents
- 6.2.2. Catalysts
- 6.2.3. Detergents
- 6.2.4. Other Applications (Refining, Biogas)
- 6.3. Market Analysis, Insights and Forecast - by End-user Industry
- 6.3.1. Water Treatment
- 6.3.2. Air Purification
- 6.3.3. Agriculture
- 6.3.4. Petrochemical
- 6.3.5. Construction
- 6.3.6. Other En
- 6.1. Market Analysis, Insights and Forecast - by Product Type
- 7. North America Zeolite Industry Analysis, Insights and Forecast, 2019-2031
- 7.1. Market Analysis, Insights and Forecast - by Product Type
- 7.1.1. Natural
- 7.1.2. Synthetic
- 7.2. Market Analysis, Insights and Forecast - by Application
- 7.2.1. Adsorbents
- 7.2.2. Catalysts
- 7.2.3. Detergents
- 7.2.4. Other Applications (Refining, Biogas)
- 7.3. Market Analysis, Insights and Forecast - by End-user Industry
- 7.3.1. Water Treatment
- 7.3.2. Air Purification
- 7.3.3. Agriculture
- 7.3.4. Petrochemical
- 7.3.5. Construction
- 7.3.6. Other En
- 7.1. Market Analysis, Insights and Forecast - by Product Type
- 8. Europe Zeolite Industry Analysis, Insights and Forecast, 2019-2031
- 8.1. Market Analysis, Insights and Forecast - by Product Type
- 8.1.1. Natural
- 8.1.2. Synthetic
- 8.2. Market Analysis, Insights and Forecast - by Application
- 8.2.1. Adsorbents
- 8.2.2. Catalysts
- 8.2.3. Detergents
- 8.2.4. Other Applications (Refining, Biogas)
- 8.3. Market Analysis, Insights and Forecast - by End-user Industry
- 8.3.1. Water Treatment
- 8.3.2. Air Purification
- 8.3.3. Agriculture
- 8.3.4. Petrochemical
- 8.3.5. Construction
- 8.3.6. Other En
- 8.1. Market Analysis, Insights and Forecast - by Product Type
- 9. South America Zeolite Industry Analysis, Insights and Forecast, 2019-2031
- 9.1. Market Analysis, Insights and Forecast - by Product Type
- 9.1.1. Natural
- 9.1.2. Synthetic
- 9.2. Market Analysis, Insights and Forecast - by Application
- 9.2.1. Adsorbents
- 9.2.2. Catalysts
- 9.2.3. Detergents
- 9.2.4. Other Applications (Refining, Biogas)
- 9.3. Market Analysis, Insights and Forecast - by End-user Industry
- 9.3.1. Water Treatment
- 9.3.2. Air Purification
- 9.3.3. Agriculture
- 9.3.4. Petrochemical
- 9.3.5. Construction
- 9.3.6. Other En
- 9.1. Market Analysis, Insights and Forecast - by Product Type
- 10. Middle East Zeolite Industry Analysis, Insights and Forecast, 2019-2031
- 10.1. Market Analysis, Insights and Forecast - by Product Type
- 10.1.1. Natural
- 10.1.2. Synthetic
- 10.2. Market Analysis, Insights and Forecast - by Application
- 10.2.1. Adsorbents
- 10.2.2. Catalysts
- 10.2.3. Detergents
- 10.2.4. Other Applications (Refining, Biogas)
- 10.3. Market Analysis, Insights and Forecast - by End-user Industry
- 10.3.1. Water Treatment
- 10.3.2. Air Purification
- 10.3.3. Agriculture
- 10.3.4. Petrochemical
- 10.3.5. Construction
- 10.3.6. Other En
- 10.1. Market Analysis, Insights and Forecast - by Product Type
- 11. Saudi Arabia Zeolite Industry Analysis, Insights and Forecast, 2019-2031
- 11.1. Market Analysis, Insights and Forecast - by Product Type
- 11.1.1. Natural
- 11.1.2. Synthetic
- 11.2. Market Analysis, Insights and Forecast - by Application
- 11.2.1. Adsorbents
- 11.2.2. Catalysts
- 11.2.3. Detergents
- 11.2.4. Other Applications (Refining, Biogas)
- 11.3. Market Analysis, Insights and Forecast - by End-user Industry
- 11.3.1. Water Treatment
- 11.3.2. Air Purification
- 11.3.3. Agriculture
- 11.3.4. Petrochemical
- 11.3.5. Construction
- 11.3.6. Other En
- 11.1. Market Analysis, Insights and Forecast - by Product Type
- 12. North America Zeolite Industry Analysis, Insights and Forecast, 2019-2031
- 12.1. Market Analysis, Insights and Forecast - By Country/Sub-region
- 12.1.1 United States
- 12.1.2 Canada
- 12.1.3 Mexico
- 13. Europe Zeolite Industry Analysis, Insights and Forecast, 2019-2031
- 13.1. Market Analysis, Insights and Forecast - By Country/Sub-region
- 13.1.1 Germany
- 13.1.2 France
- 13.1.3 Italy
- 13.1.4 United Kingdom
- 13.1.5 Netherlands
- 13.1.6 Rest of Europe
- 14. Asia Pacific Zeolite Industry Analysis, Insights and Forecast, 2019-2031
- 14.1. Market Analysis, Insights and Forecast - By Country/Sub-region
- 14.1.1 China
- 14.1.2 Japan
- 14.1.3 India
- 14.1.4 South Korea
- 14.1.5 Taiwan
- 14.1.6 Australia
- 14.1.7 Rest of Asia-Pacific
- 15. South America Zeolite Industry Analysis, Insights and Forecast, 2019-2031
- 15.1. Market Analysis, Insights and Forecast - By Country/Sub-region
- 15.1.1 Brazil
- 15.1.2 Argentina
- 15.1.3 Rest of South America
- 16. MEA Zeolite Industry Analysis, Insights and Forecast, 2019-2031
- 16.1. Market Analysis, Insights and Forecast - By Country/Sub-region
- 16.1.1 Middle East
- 16.1.2 Africa
- 17. Competitive Analysis
- 17.1. Global Market Share Analysis 2024
- 17.2. Company Profiles
- 17.2.1 Honeywell International Inc
- 17.2.1.1. Overview
- 17.2.1.2. Products
- 17.2.1.3. SWOT Analysis
- 17.2.1.4. Recent Developments
- 17.2.1.5. Financials (Based on Availability)
- 17.2.2 Clariant
- 17.2.2.1. Overview
- 17.2.2.2. Products
- 17.2.2.3. SWOT Analysis
- 17.2.2.4. Recent Developments
- 17.2.2.5. Financials (Based on Availability)
- 17.2.3 SHOWA DENKO KK
- 17.2.3.1. Overview
- 17.2.3.2. Products
- 17.2.3.3. SWOT Analysis
- 17.2.3.4. Recent Developments
- 17.2.3.5. Financials (Based on Availability)
- 17.2.4 International Zeolite Corp
- 17.2.4.1. Overview
- 17.2.4.2. Products
- 17.2.4.3. SWOT Analysis
- 17.2.4.4. Recent Developments
- 17.2.4.5. Financials (Based on Availability)
- 17.2.5 Zeomex
- 17.2.5.1. Overview
- 17.2.5.2. Products
- 17.2.5.3. SWOT Analysis
- 17.2.5.4. Recent Developments
- 17.2.5.5. Financials (Based on Availability)
- 17.2.6 Interra Global
- 17.2.6.1. Overview
- 17.2.6.2. Products
- 17.2.6.3. SWOT Analysis
- 17.2.6.4. Recent Developments
- 17.2.6.5. Financials (Based on Availability)
- 17.2.7 KNT Group
- 17.2.7.1. Overview
- 17.2.7.2. Products
- 17.2.7.3. SWOT Analysis
- 17.2.7.4. Recent Developments
- 17.2.7.5. Financials (Based on Availability)
- 17.2.8 ZEOCEM AS
- 17.2.8.1. Overview
- 17.2.8.2. Products
- 17.2.8.3. SWOT Analysis
- 17.2.8.4. Recent Developments
- 17.2.8.5. Financials (Based on Availability)
- 17.2.9 BASF SE
- 17.2.9.1. Overview
- 17.2.9.2. Products
- 17.2.9.3. SWOT Analysis
- 17.2.9.4. Recent Developments
- 17.2.9.5. Financials (Based on Availability)
- 17.2.10 Arkema Group
- 17.2.10.1. Overview
- 17.2.10.2. Products
- 17.2.10.3. SWOT Analysis
- 17.2.10.4. Recent Developments
- 17.2.10.5. Financials (Based on Availability)
- 17.2.11 Tosoh Corporation
- 17.2.11.1. Overview
- 17.2.11.2. Products
- 17.2.11.3. SWOT Analysis
- 17.2.11.4. Recent Developments
- 17.2.11.5. Financials (Based on Availability)
- 17.2.12 W R Grace & Co
- 17.2.12.1. Overview
- 17.2.12.2. Products
- 17.2.12.3. SWOT Analysis
- 17.2.12.4. Recent Developments
- 17.2.12.5. Financials (Based on Availability)
- 17.2.13 Zeolyst International Inc
- 17.2.13.1. Overview
- 17.2.13.2. Products
- 17.2.13.3. SWOT Analysis
- 17.2.13.4. Recent Developments
- 17.2.13.5. Financials (Based on Availability)
- 17.2.1 Honeywell International Inc
List of Figures
- Figure 1: Global Zeolite Industry Revenue Breakdown (Million, %) by Region 2024 & 2032
- Figure 2: Global Zeolite Industry Volume Breakdown (K Tons, %) by Region 2024 & 2032
- Figure 3: North America Zeolite Industry Revenue (Million), by Country 2024 & 2032
- Figure 4: North America Zeolite Industry Volume (K Tons), by Country 2024 & 2032
- Figure 5: North America Zeolite Industry Revenue Share (%), by Country 2024 & 2032
- Figure 6: North America Zeolite Industry Volume Share (%), by Country 2024 & 2032
- Figure 7: Europe Zeolite Industry Revenue (Million), by Country 2024 & 2032
- Figure 8: Europe Zeolite Industry Volume (K Tons), by Country 2024 & 2032
- Figure 9: Europe Zeolite Industry Revenue Share (%), by Country 2024 & 2032
- Figure 10: Europe Zeolite Industry Volume Share (%), by Country 2024 & 2032
- Figure 11: Asia Pacific Zeolite Industry Revenue (Million), by Country 2024 & 2032
- Figure 12: Asia Pacific Zeolite Industry Volume (K Tons), by Country 2024 & 2032
- Figure 13: Asia Pacific Zeolite Industry Revenue Share (%), by Country 2024 & 2032
- Figure 14: Asia Pacific Zeolite Industry Volume Share (%), by Country 2024 & 2032
- Figure 15: South America Zeolite Industry Revenue (Million), by Country 2024 & 2032
- Figure 16: South America Zeolite Industry Volume (K Tons), by Country 2024 & 2032
- Figure 17: South America Zeolite Industry Revenue Share (%), by Country 2024 & 2032
- Figure 18: South America Zeolite Industry Volume Share (%), by Country 2024 & 2032
- Figure 19: MEA Zeolite Industry Revenue (Million), by Country 2024 & 2032
- Figure 20: MEA Zeolite Industry Volume (K Tons), by Country 2024 & 2032
- Figure 21: MEA Zeolite Industry Revenue Share (%), by Country 2024 & 2032
- Figure 22: MEA Zeolite Industry Volume Share (%), by Country 2024 & 2032
- Figure 23: Asia Pacific Zeolite Industry Revenue (Million), by Product Type 2024 & 2032
- Figure 24: Asia Pacific Zeolite Industry Volume (K Tons), by Product Type 2024 & 2032
- Figure 25: Asia Pacific Zeolite Industry Revenue Share (%), by Product Type 2024 & 2032
- Figure 26: Asia Pacific Zeolite Industry Volume Share (%), by Product Type 2024 & 2032
- Figure 27: Asia Pacific Zeolite Industry Revenue (Million), by Application 2024 & 2032
- Figure 28: Asia Pacific Zeolite Industry Volume (K Tons), by Application 2024 & 2032
- Figure 29: Asia Pacific Zeolite Industry Revenue Share (%), by Application 2024 & 2032
- Figure 30: Asia Pacific Zeolite Industry Volume Share (%), by Application 2024 & 2032
- Figure 31: Asia Pacific Zeolite Industry Revenue (Million), by End-user Industry 2024 & 2032
- Figure 32: Asia Pacific Zeolite Industry Volume (K Tons), by End-user Industry 2024 & 2032
- Figure 33: Asia Pacific Zeolite Industry Revenue Share (%), by End-user Industry 2024 & 2032
- Figure 34: Asia Pacific Zeolite Industry Volume Share (%), by End-user Industry 2024 & 2032
- Figure 35: Asia Pacific Zeolite Industry Revenue (Million), by Country 2024 & 2032
- Figure 36: Asia Pacific Zeolite Industry Volume (K Tons), by Country 2024 & 2032
- Figure 37: Asia Pacific Zeolite Industry Revenue Share (%), by Country 2024 & 2032
- Figure 38: Asia Pacific Zeolite Industry Volume Share (%), by Country 2024 & 2032
- Figure 39: North America Zeolite Industry Revenue (Million), by Product Type 2024 & 2032
- Figure 40: North America Zeolite Industry Volume (K Tons), by Product Type 2024 & 2032
- Figure 41: North America Zeolite Industry Revenue Share (%), by Product Type 2024 & 2032
- Figure 42: North America Zeolite Industry Volume Share (%), by Product Type 2024 & 2032
- Figure 43: North America Zeolite Industry Revenue (Million), by Application 2024 & 2032
- Figure 44: North America Zeolite Industry Volume (K Tons), by Application 2024 & 2032
- Figure 45: North America Zeolite Industry Revenue Share (%), by Application 2024 & 2032
- Figure 46: North America Zeolite Industry Volume Share (%), by Application 2024 & 2032
- Figure 47: North America Zeolite Industry Revenue (Million), by End-user Industry 2024 & 2032
- Figure 48: North America Zeolite Industry Volume (K Tons), by End-user Industry 2024 & 2032
- Figure 49: North America Zeolite Industry Revenue Share (%), by End-user Industry 2024 & 2032
- Figure 50: North America Zeolite Industry Volume Share (%), by End-user Industry 2024 & 2032
- Figure 51: North America Zeolite Industry Revenue (Million), by Country 2024 & 2032
- Figure 52: North America Zeolite Industry Volume (K Tons), by Country 2024 & 2032
- Figure 53: North America Zeolite Industry Revenue Share (%), by Country 2024 & 2032
- Figure 54: North America Zeolite Industry Volume Share (%), by Country 2024 & 2032
- Figure 55: Europe Zeolite Industry Revenue (Million), by Product Type 2024 & 2032
- Figure 56: Europe Zeolite Industry Volume (K Tons), by Product Type 2024 & 2032
- Figure 57: Europe Zeolite Industry Revenue Share (%), by Product Type 2024 & 2032
- Figure 58: Europe Zeolite Industry Volume Share (%), by Product Type 2024 & 2032
- Figure 59: Europe Zeolite Industry Revenue (Million), by Application 2024 & 2032
- Figure 60: Europe Zeolite Industry Volume (K Tons), by Application 2024 & 2032
- Figure 61: Europe Zeolite Industry Revenue Share (%), by Application 2024 & 2032
- Figure 62: Europe Zeolite Industry Volume Share (%), by Application 2024 & 2032
- Figure 63: Europe Zeolite Industry Revenue (Million), by End-user Industry 2024 & 2032
- Figure 64: Europe Zeolite Industry Volume (K Tons), by End-user Industry 2024 & 2032
- Figure 65: Europe Zeolite Industry Revenue Share (%), by End-user Industry 2024 & 2032
- Figure 66: Europe Zeolite Industry Volume Share (%), by End-user Industry 2024 & 2032
- Figure 67: Europe Zeolite Industry Revenue (Million), by Country 2024 & 2032
- Figure 68: Europe Zeolite Industry Volume (K Tons), by Country 2024 & 2032
- Figure 69: Europe Zeolite Industry Revenue Share (%), by Country 2024 & 2032
- Figure 70: Europe Zeolite Industry Volume Share (%), by Country 2024 & 2032
- Figure 71: South America Zeolite Industry Revenue (Million), by Product Type 2024 & 2032
- Figure 72: South America Zeolite Industry Volume (K Tons), by Product Type 2024 & 2032
- Figure 73: South America Zeolite Industry Revenue Share (%), by Product Type 2024 & 2032
- Figure 74: South America Zeolite Industry Volume Share (%), by Product Type 2024 & 2032
- Figure 75: South America Zeolite Industry Revenue (Million), by Application 2024 & 2032
- Figure 76: South America Zeolite Industry Volume (K Tons), by Application 2024 & 2032
- Figure 77: South America Zeolite Industry Revenue Share (%), by Application 2024 & 2032
- Figure 78: South America Zeolite Industry Volume Share (%), by Application 2024 & 2032
- Figure 79: South America Zeolite Industry Revenue (Million), by End-user Industry 2024 & 2032
- Figure 80: South America Zeolite Industry Volume (K Tons), by End-user Industry 2024 & 2032
- Figure 81: South America Zeolite Industry Revenue Share (%), by End-user Industry 2024 & 2032
- Figure 82: South America Zeolite Industry Volume Share (%), by End-user Industry 2024 & 2032
- Figure 83: South America Zeolite Industry Revenue (Million), by Country 2024 & 2032
- Figure 84: South America Zeolite Industry Volume (K Tons), by Country 2024 & 2032
- Figure 85: South America Zeolite Industry Revenue Share (%), by Country 2024 & 2032
- Figure 86: South America Zeolite Industry Volume Share (%), by Country 2024 & 2032
- Figure 87: Middle East Zeolite Industry Revenue (Million), by Product Type 2024 & 2032
- Figure 88: Middle East Zeolite Industry Volume (K Tons), by Product Type 2024 & 2032
- Figure 89: Middle East Zeolite Industry Revenue Share (%), by Product Type 2024 & 2032
- Figure 90: Middle East Zeolite Industry Volume Share (%), by Product Type 2024 & 2032
- Figure 91: Middle East Zeolite Industry Revenue (Million), by Application 2024 & 2032
- Figure 92: Middle East Zeolite Industry Volume (K Tons), by Application 2024 & 2032
- Figure 93: Middle East Zeolite Industry Revenue Share (%), by Application 2024 & 2032
- Figure 94: Middle East Zeolite Industry Volume Share (%), by Application 2024 & 2032
- Figure 95: Middle East Zeolite Industry Revenue (Million), by End-user Industry 2024 & 2032
- Figure 96: Middle East Zeolite Industry Volume (K Tons), by End-user Industry 2024 & 2032
- Figure 97: Middle East Zeolite Industry Revenue Share (%), by End-user Industry 2024 & 2032
- Figure 98: Middle East Zeolite Industry Volume Share (%), by End-user Industry 2024 & 2032
- Figure 99: Middle East Zeolite Industry Revenue (Million), by Country 2024 & 2032
- Figure 100: Middle East Zeolite Industry Volume (K Tons), by Country 2024 & 2032
- Figure 101: Middle East Zeolite Industry Revenue Share (%), by Country 2024 & 2032
- Figure 102: Middle East Zeolite Industry Volume Share (%), by Country 2024 & 2032
- Figure 103: Saudi Arabia Zeolite Industry Revenue (Million), by Product Type 2024 & 2032
- Figure 104: Saudi Arabia Zeolite Industry Volume (K Tons), by Product Type 2024 & 2032
- Figure 105: Saudi Arabia Zeolite Industry Revenue Share (%), by Product Type 2024 & 2032
- Figure 106: Saudi Arabia Zeolite Industry Volume Share (%), by Product Type 2024 & 2032
- Figure 107: Saudi Arabia Zeolite Industry Revenue (Million), by Application 2024 & 2032
- Figure 108: Saudi Arabia Zeolite Industry Volume (K Tons), by Application 2024 & 2032
- Figure 109: Saudi Arabia Zeolite Industry Revenue Share (%), by Application 2024 & 2032
- Figure 110: Saudi Arabia Zeolite Industry Volume Share (%), by Application 2024 & 2032
- Figure 111: Saudi Arabia Zeolite Industry Revenue (Million), by End-user Industry 2024 & 2032
- Figure 112: Saudi Arabia Zeolite Industry Volume (K Tons), by End-user Industry 2024 & 2032
- Figure 113: Saudi Arabia Zeolite Industry Revenue Share (%), by End-user Industry 2024 & 2032
- Figure 114: Saudi Arabia Zeolite Industry Volume Share (%), by End-user Industry 2024 & 2032
- Figure 115: Saudi Arabia Zeolite Industry Revenue (Million), by Country 2024 & 2032
- Figure 116: Saudi Arabia Zeolite Industry Volume (K Tons), by Country 2024 & 2032
- Figure 117: Saudi Arabia Zeolite Industry Revenue Share (%), by Country 2024 & 2032
- Figure 118: Saudi Arabia Zeolite Industry Volume Share (%), by Country 2024 & 2032
List of Tables
- Table 1: Global Zeolite Industry Revenue Million Forecast, by Region 2019 & 2032
- Table 2: Global Zeolite Industry Volume K Tons Forecast, by Region 2019 & 2032
- Table 3: Global Zeolite Industry Revenue Million Forecast, by Product Type 2019 & 2032
- Table 4: Global Zeolite Industry Volume K Tons Forecast, by Product Type 2019 & 2032
- Table 5: Global Zeolite Industry Revenue Million Forecast, by Application 2019 & 2032
- Table 6: Global Zeolite Industry Volume K Tons Forecast, by Application 2019 & 2032
- Table 7: Global Zeolite Industry Revenue Million Forecast, by End-user Industry 2019 & 2032
- Table 8: Global Zeolite Industry Volume K Tons Forecast, by End-user Industry 2019 & 2032
- Table 9: Global Zeolite Industry Revenue Million Forecast, by Region 2019 & 2032
- Table 10: Global Zeolite Industry Volume K Tons Forecast, by Region 2019 & 2032
- Table 11: Global Zeolite Industry Revenue Million Forecast, by Country 2019 & 2032
- Table 12: Global Zeolite Industry Volume K Tons Forecast, by Country 2019 & 2032
- Table 13: United States Zeolite Industry Revenue (Million) Forecast, by Application 2019 & 2032
- Table 14: United States Zeolite Industry Volume (K Tons) Forecast, by Application 2019 & 2032
- Table 15: Canada Zeolite Industry Revenue (Million) Forecast, by Application 2019 & 2032
- Table 16: Canada Zeolite Industry Volume (K Tons) Forecast, by Application 2019 & 2032
- Table 17: Mexico Zeolite Industry Revenue (Million) Forecast, by Application 2019 & 2032
- Table 18: Mexico Zeolite Industry Volume (K Tons) Forecast, by Application 2019 & 2032
- Table 19: Global Zeolite Industry Revenue Million Forecast, by Country 2019 & 2032
- Table 20: Global Zeolite Industry Volume K Tons Forecast, by Country 2019 & 2032
- Table 21: Germany Zeolite Industry Revenue (Million) Forecast, by Application 2019 & 2032
- Table 22: Germany Zeolite Industry Volume (K Tons) Forecast, by Application 2019 & 2032
- Table 23: France Zeolite Industry Revenue (Million) Forecast, by Application 2019 & 2032
- Table 24: France Zeolite Industry Volume (K Tons) Forecast, by Application 2019 & 2032
- Table 25: Italy Zeolite Industry Revenue (Million) Forecast, by Application 2019 & 2032
- Table 26: Italy Zeolite Industry Volume (K Tons) Forecast, by Application 2019 & 2032
- Table 27: United Kingdom Zeolite Industry Revenue (Million) Forecast, by Application 2019 & 2032
- Table 28: United Kingdom Zeolite Industry Volume (K Tons) Forecast, by Application 2019 & 2032
- Table 29: Netherlands Zeolite Industry Revenue (Million) Forecast, by Application 2019 & 2032
- Table 30: Netherlands Zeolite Industry Volume (K Tons) Forecast, by Application 2019 & 2032
- Table 31: Rest of Europe Zeolite Industry Revenue (Million) Forecast, by Application 2019 & 2032
- Table 32: Rest of Europe Zeolite Industry Volume (K Tons) Forecast, by Application 2019 & 2032
- Table 33: Global Zeolite Industry Revenue Million Forecast, by Country 2019 & 2032
- Table 34: Global Zeolite Industry Volume K Tons Forecast, by Country 2019 & 2032
- Table 35: China Zeolite Industry Revenue (Million) Forecast, by Application 2019 & 2032
- Table 36: China Zeolite Industry Volume (K Tons) Forecast, by Application 2019 & 2032
- Table 37: Japan Zeolite Industry Revenue (Million) Forecast, by Application 2019 & 2032
- Table 38: Japan Zeolite Industry Volume (K Tons) Forecast, by Application 2019 & 2032
- Table 39: India Zeolite Industry Revenue (Million) Forecast, by Application 2019 & 2032
- Table 40: India Zeolite Industry Volume (K Tons) Forecast, by Application 2019 & 2032
- Table 41: South Korea Zeolite Industry Revenue (Million) Forecast, by Application 2019 & 2032
- Table 42: South Korea Zeolite Industry Volume (K Tons) Forecast, by Application 2019 & 2032
- Table 43: Taiwan Zeolite Industry Revenue (Million) Forecast, by Application 2019 & 2032
- Table 44: Taiwan Zeolite Industry Volume (K Tons) Forecast, by Application 2019 & 2032
- Table 45: Australia Zeolite Industry Revenue (Million) Forecast, by Application 2019 & 2032
- Table 46: Australia Zeolite Industry Volume (K Tons) Forecast, by Application 2019 & 2032
- Table 47: Rest of Asia-Pacific Zeolite Industry Revenue (Million) Forecast, by Application 2019 & 2032
- Table 48: Rest of Asia-Pacific Zeolite Industry Volume (K Tons) Forecast, by Application 2019 & 2032
- Table 49: Global Zeolite Industry Revenue Million Forecast, by Country 2019 & 2032
- Table 50: Global Zeolite Industry Volume K Tons Forecast, by Country 2019 & 2032
- Table 51: Brazil Zeolite Industry Revenue (Million) Forecast, by Application 2019 & 2032
- Table 52: Brazil Zeolite Industry Volume (K Tons) Forecast, by Application 2019 & 2032
- Table 53: Argentina Zeolite Industry Revenue (Million) Forecast, by Application 2019 & 2032
- Table 54: Argentina Zeolite Industry Volume (K Tons) Forecast, by Application 2019 & 2032
- Table 55: Rest of South America Zeolite Industry Revenue (Million) Forecast, by Application 2019 & 2032
- Table 56: Rest of South America Zeolite Industry Volume (K Tons) Forecast, by Application 2019 & 2032
- Table 57: Global Zeolite Industry Revenue Million Forecast, by Country 2019 & 2032
- Table 58: Global Zeolite Industry Volume K Tons Forecast, by Country 2019 & 2032
- Table 59: Middle East Zeolite Industry Revenue (Million) Forecast, by Application 2019 & 2032
- Table 60: Middle East Zeolite Industry Volume (K Tons) Forecast, by Application 2019 & 2032
- Table 61: Africa Zeolite Industry Revenue (Million) Forecast, by Application 2019 & 2032
- Table 62: Africa Zeolite Industry Volume (K Tons) Forecast, by Application 2019 & 2032
- Table 63: Global Zeolite Industry Revenue Million Forecast, by Product Type 2019 & 2032
- Table 64: Global Zeolite Industry Volume K Tons Forecast, by Product Type 2019 & 2032
- Table 65: Global Zeolite Industry Revenue Million Forecast, by Application 2019 & 2032
- Table 66: Global Zeolite Industry Volume K Tons Forecast, by Application 2019 & 2032
- Table 67: Global Zeolite Industry Revenue Million Forecast, by End-user Industry 2019 & 2032
- Table 68: Global Zeolite Industry Volume K Tons Forecast, by End-user Industry 2019 & 2032
- Table 69: Global Zeolite Industry Revenue Million Forecast, by Country 2019 & 2032
- Table 70: Global Zeolite Industry Volume K Tons Forecast, by Country 2019 & 2032
- Table 71: China Zeolite Industry Revenue (Million) Forecast, by Application 2019 & 2032
- Table 72: China Zeolite Industry Volume (K Tons) Forecast, by Application 2019 & 2032
- Table 73: India Zeolite Industry Revenue (Million) Forecast, by Application 2019 & 2032
- Table 74: India Zeolite Industry Volume (K Tons) Forecast, by Application 2019 & 2032
- Table 75: Japan Zeolite Industry Revenue (Million) Forecast, by Application 2019 & 2032
- Table 76: Japan Zeolite Industry Volume (K Tons) Forecast, by Application 2019 & 2032
- Table 77: South Korea Zeolite Industry Revenue (Million) Forecast, by Application 2019 & 2032
- Table 78: South Korea Zeolite Industry Volume (K Tons) Forecast, by Application 2019 & 2032
- Table 79: Rest of Asia Pacific Zeolite Industry Revenue (Million) Forecast, by Application 2019 & 2032
- Table 80: Rest of Asia Pacific Zeolite Industry Volume (K Tons) Forecast, by Application 2019 & 2032
- Table 81: Global Zeolite Industry Revenue Million Forecast, by Product Type 2019 & 2032
- Table 82: Global Zeolite Industry Volume K Tons Forecast, by Product Type 2019 & 2032
- Table 83: Global Zeolite Industry Revenue Million Forecast, by Application 2019 & 2032
- Table 84: Global Zeolite Industry Volume K Tons Forecast, by Application 2019 & 2032
- Table 85: Global Zeolite Industry Revenue Million Forecast, by End-user Industry 2019 & 2032
- Table 86: Global Zeolite Industry Volume K Tons Forecast, by End-user Industry 2019 & 2032
- Table 87: Global Zeolite Industry Revenue Million Forecast, by Country 2019 & 2032
- Table 88: Global Zeolite Industry Volume K Tons Forecast, by Country 2019 & 2032
- Table 89: United States Zeolite Industry Revenue (Million) Forecast, by Application 2019 & 2032
- Table 90: United States Zeolite Industry Volume (K Tons) Forecast, by Application 2019 & 2032
- Table 91: Canada Zeolite Industry Revenue (Million) Forecast, by Application 2019 & 2032
- Table 92: Canada Zeolite Industry Volume (K Tons) Forecast, by Application 2019 & 2032
- Table 93: Mexico Zeolite Industry Revenue (Million) Forecast, by Application 2019 & 2032
- Table 94: Mexico Zeolite Industry Volume (K Tons) Forecast, by Application 2019 & 2032
- Table 95: Global Zeolite Industry Revenue Million Forecast, by Product Type 2019 & 2032
- Table 96: Global Zeolite Industry Volume K Tons Forecast, by Product Type 2019 & 2032
- Table 97: Global Zeolite Industry Revenue Million Forecast, by Application 2019 & 2032
- Table 98: Global Zeolite Industry Volume K Tons Forecast, by Application 2019 & 2032
- Table 99: Global Zeolite Industry Revenue Million Forecast, by End-user Industry 2019 & 2032
- Table 100: Global Zeolite Industry Volume K Tons Forecast, by End-user Industry 2019 & 2032
- Table 101: Global Zeolite Industry Revenue Million Forecast, by Country 2019 & 2032
- Table 102: Global Zeolite Industry Volume K Tons Forecast, by Country 2019 & 2032
- Table 103: Germany Zeolite Industry Revenue (Million) Forecast, by Application 2019 & 2032
- Table 104: Germany Zeolite Industry Volume (K Tons) Forecast, by Application 2019 & 2032
- Table 105: United Kingdom Zeolite Industry Revenue (Million) Forecast, by Application 2019 & 2032
- Table 106: United Kingdom Zeolite Industry Volume (K Tons) Forecast, by Application 2019 & 2032
- Table 107: Italy Zeolite Industry Revenue (Million) Forecast, by Application 2019 & 2032
- Table 108: Italy Zeolite Industry Volume (K Tons) Forecast, by Application 2019 & 2032
- Table 109: France Zeolite Industry Revenue (Million) Forecast, by Application 2019 & 2032
- Table 110: France Zeolite Industry Volume (K Tons) Forecast, by Application 2019 & 2032
- Table 111: Rest of Europe Zeolite Industry Revenue (Million) Forecast, by Application 2019 & 2032
- Table 112: Rest of Europe Zeolite Industry Volume (K Tons) Forecast, by Application 2019 & 2032
- Table 113: Global Zeolite Industry Revenue Million Forecast, by Product Type 2019 & 2032
- Table 114: Global Zeolite Industry Volume K Tons Forecast, by Product Type 2019 & 2032
- Table 115: Global Zeolite Industry Revenue Million Forecast, by Application 2019 & 2032
- Table 116: Global Zeolite Industry Volume K Tons Forecast, by Application 2019 & 2032
- Table 117: Global Zeolite Industry Revenue Million Forecast, by End-user Industry 2019 & 2032
- Table 118: Global Zeolite Industry Volume K Tons Forecast, by End-user Industry 2019 & 2032
- Table 119: Global Zeolite Industry Revenue Million Forecast, by Country 2019 & 2032
- Table 120: Global Zeolite Industry Volume K Tons Forecast, by Country 2019 & 2032
- Table 121: Brazil Zeolite Industry Revenue (Million) Forecast, by Application 2019 & 2032
- Table 122: Brazil Zeolite Industry Volume (K Tons) Forecast, by Application 2019 & 2032
- Table 123: Argentina Zeolite Industry Revenue (Million) Forecast, by Application 2019 & 2032
- Table 124: Argentina Zeolite Industry Volume (K Tons) Forecast, by Application 2019 & 2032
- Table 125: Rest of South America Zeolite Industry Revenue (Million) Forecast, by Application 2019 & 2032
- Table 126: Rest of South America Zeolite Industry Volume (K Tons) Forecast, by Application 2019 & 2032
- Table 127: Global Zeolite Industry Revenue Million Forecast, by Product Type 2019 & 2032
- Table 128: Global Zeolite Industry Volume K Tons Forecast, by Product Type 2019 & 2032
- Table 129: Global Zeolite Industry Revenue Million Forecast, by Application 2019 & 2032
- Table 130: Global Zeolite Industry Volume K Tons Forecast, by Application 2019 & 2032
- Table 131: Global Zeolite Industry Revenue Million Forecast, by End-user Industry 2019 & 2032
- Table 132: Global Zeolite Industry Volume K Tons Forecast, by End-user Industry 2019 & 2032
- Table 133: Global Zeolite Industry Revenue Million Forecast, by Country 2019 & 2032
- Table 134: Global Zeolite Industry Volume K Tons Forecast, by Country 2019 & 2032
- Table 135: Global Zeolite Industry Revenue Million Forecast, by Product Type 2019 & 2032
- Table 136: Global Zeolite Industry Volume K Tons Forecast, by Product Type 2019 & 2032
- Table 137: Global Zeolite Industry Revenue Million Forecast, by Application 2019 & 2032
- Table 138: Global Zeolite Industry Volume K Tons Forecast, by Application 2019 & 2032
- Table 139: Global Zeolite Industry Revenue Million Forecast, by End-user Industry 2019 & 2032
- Table 140: Global Zeolite Industry Volume K Tons Forecast, by End-user Industry 2019 & 2032
- Table 141: Global Zeolite Industry Revenue Million Forecast, by Country 2019 & 2032
- Table 142: Global Zeolite Industry Volume K Tons Forecast, by Country 2019 & 2032
- Table 143: South Africa Zeolite Industry Revenue (Million) Forecast, by Application 2019 & 2032
- Table 144: South Africa Zeolite Industry Volume (K Tons) Forecast, by Application 2019 & 2032
- Table 145: Rest of Middle East Zeolite Industry Revenue (Million) Forecast, by Application 2019 & 2032
- Table 146: Rest of Middle East Zeolite Industry Volume (K Tons) Forecast, by Application 2019 & 2032
Frequently Asked Questions
1. What is the projected Compound Annual Growth Rate (CAGR) of the Zeolite Industry?
The projected CAGR is approximately > 2.50%.
2. Which companies are prominent players in the Zeolite Industry?
Key companies in the market include Honeywell International Inc, Clariant, SHOWA DENKO KK, International Zeolite Corp, Zeomex, Interra Global, KNT Group, ZEOCEM AS, BASF SE, Arkema Group, Tosoh Corporation, W R Grace & Co, Zeolyst International Inc.
3. What are the main segments of the Zeolite Industry?
The market segments include Product Type, Application, End-user Industry.
4. Can you provide details about the market size?
The market size is estimated to be USD XX Million as of 2022.
5. What are some drivers contributing to market growth?
Increasing Demand from Water Treatment Industry; Increasing Use of Zeolite as Refrigeration Adsorbents; Significant Usage of Zeolites for Catalytic Cracking in the Petroleum Industry.
6. What are the notable trends driving market growth?
Agriculture Industry to Dominate the Market.
7. Are there any restraints impacting market growth?
Usage of Substitutes for Zeolites.
8. Can you provide examples of recent developments in the market?
December 2022: International Zeolite Corp. is pleased to announce an agreement between Niagara College's Horticultural & Environmental Sciences Innovation Centre (HESIC). Under the terms of the agreement, Niagara College will provide priority and support for research projects in relationship to IZ's proprietary grow system NEREA, which HESIC will carry out.
9. What pricing options are available for accessing the report?
Pricing options include single-user, multi-user, and enterprise licenses priced at USD 4750, USD 5250, and USD 8750 respectively.
10. Is the market size provided in terms of value or volume?
The market size is provided in terms of value, measured in Million and volume, measured in K Tons.
11. Are there any specific market keywords associated with the report?
Yes, the market keyword associated with the report is "Zeolite Industry," which aids in identifying and referencing the specific market segment covered.
12. How do I determine which pricing option suits my needs best?
The pricing options vary based on user requirements and access needs. Individual users may opt for single-user licenses, while businesses requiring broader access may choose multi-user or enterprise licenses for cost-effective access to the report.
13. Are there any additional resources or data provided in the Zeolite Industry report?
While the report offers comprehensive insights, it's advisable to review the specific contents or supplementary materials provided to ascertain if additional resources or data are available.
14. How can I stay updated on further developments or reports in the Zeolite Industry?
To stay informed about further developments, trends, and reports in the Zeolite Industry, consider subscribing to industry newsletters, following relevant companies and organizations, or regularly checking reputable industry news sources and publications.
Methodology
Step 1 - Identification of Relevant Samples Size from Population Database


Step 2 - Approaches for Defining Global Market Size (Value, Volume* & Price*)

Note*: In applicable scenarios
Step 3 - Data Sources
Primary Research
- Web Analytics
- Survey Reports
- Research Institute
- Latest Research Reports
- Opinion Leaders
Secondary Research
- Annual Reports
- White Paper
- Latest Press Release
- Industry Association
- Paid Database
- Investor Presentations

Step 4 - Data Triangulation
Involves using different sources of information in order to increase the validity of a study
These sources are likely to be stakeholders in a program - participants, other researchers, program staff, other community members, and so on.
Then we put all data in single framework & apply various statistical tools to find out the dynamic on the market.
During the analysis stage, feedback from the stakeholder groups would be compared to determine areas of agreement as well as areas of divergence
