

Key Insights
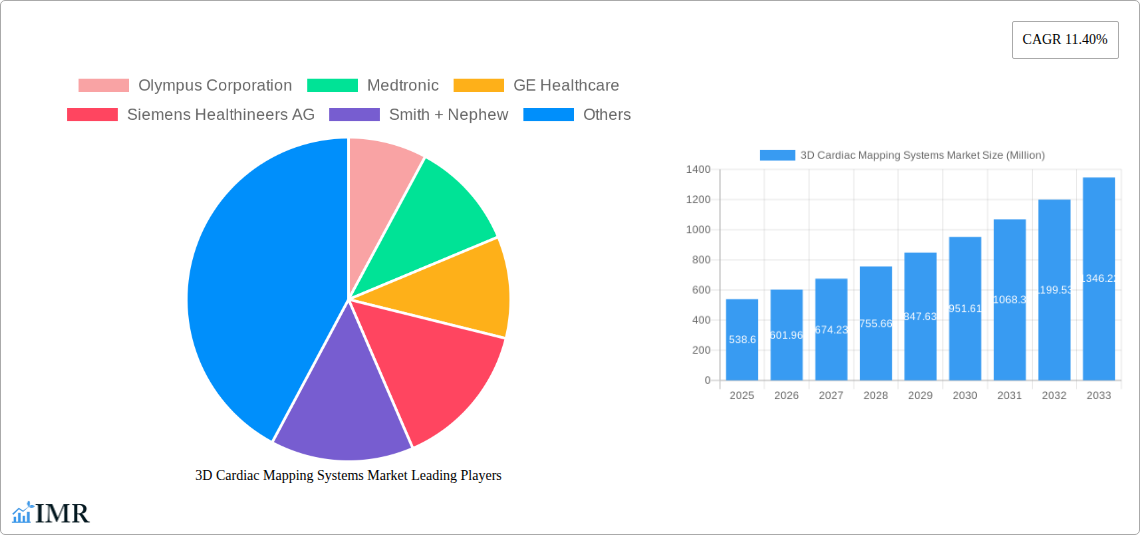
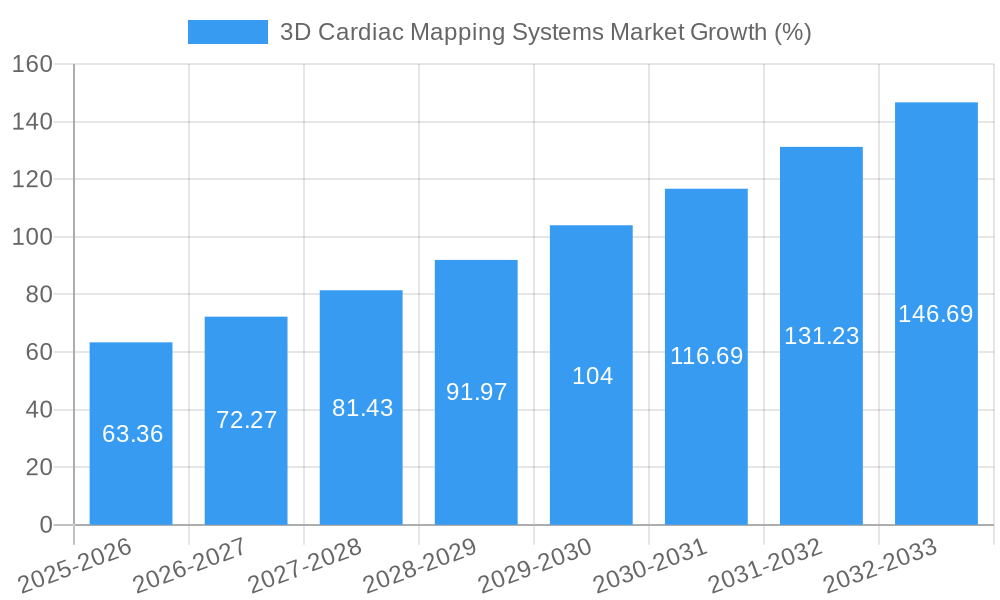
The 3D Cardiac Mapping Systems market is experiencing robust growth, projected to reach a market size of $538.60 million in 2025 and maintain a Compound Annual Growth Rate (CAGR) of 11.40% from 2025 to 2033. This expansion is fueled by several key drivers. Advancements in imaging technology are leading to more precise and detailed cardiac maps, enabling improved diagnosis and treatment of arrhythmias. The rising prevalence of heart conditions globally, coupled with an aging population, significantly increases the demand for sophisticated diagnostic tools like 3D cardiac mapping systems. Minimally invasive procedures, enabled by these systems, are also contributing to market growth, as they reduce patient recovery times and hospital stays. Furthermore, technological innovations such as AI-powered analysis tools are enhancing the efficiency and accuracy of cardiac mapping procedures, further stimulating market growth. Competition among established players like Olympus Corporation, Medtronic, GE Healthcare, and Siemens Healthineers, alongside emerging companies, drives innovation and affordability.
However, several factors could restrain market growth. High initial investment costs associated with the purchase and maintenance of these sophisticated systems can be a barrier for smaller healthcare facilities. Furthermore, the need for specialized training and expertise to operate these systems effectively can limit their adoption in regions with limited healthcare infrastructure. Regulatory hurdles and reimbursement policies can also impact market penetration. Despite these restraints, the long-term outlook for the 3D cardiac mapping systems market remains positive, driven by continuous technological advancements and the increasing need for precise and efficient cardiac diagnostics and treatments. The market is expected to see substantial expansion in regions with growing healthcare infrastructure and increasing awareness of cardiac health.
3D Cardiac Mapping Systems Market: A Comprehensive Report (2019-2033)
This in-depth report provides a comprehensive analysis of the 3D Cardiac Mapping Systems market, encompassing market dynamics, growth trends, regional dominance, product landscape, key players, and future outlook. The report covers the period from 2019 to 2033, with 2025 serving as the base and estimated year. The parent market is the broader Cardiac Rhythm Management (CRM) devices market, while the child market is specifically Electrophysiology (EP) diagnostic and therapeutic systems. The global market size is projected at xx Million units in 2025.
3D Cardiac Mapping Systems Market Dynamics & Structure
The 3D Cardiac Mapping Systems market is characterized by moderate concentration, with key players like Medtronic, Biosense Webster (Johnson & Johnson), and GE Healthcare holding significant market share. Technological innovation, particularly in areas like AI-driven image processing and improved catheter technology, is a primary driver. Regulatory approvals and reimbursement policies significantly influence market adoption rates. Competitive substitutes include traditional mapping techniques, but 3D mapping offers superior precision and efficiency, driving market growth. The end-user demographic primarily includes hospitals and specialized cardiac centers. M&A activity has been moderate, with a few notable acquisitions over the past five years, resulting in a xx% market share change amongst the top 5 players.
- Market Concentration: Moderately concentrated, with top 5 players holding approximately xx% of the market share in 2024.
- Innovation Drivers: AI-powered image analysis, improved catheter design, and miniaturization.
- Regulatory Framework: Stringent regulatory approvals (e.g., FDA, CE Mark) impact market entry.
- Competitive Substitutes: Traditional mapping techniques, but 3D mapping offers superior accuracy.
- End-User Demographics: Primarily hospitals and specialized cardiac centers.
- M&A Trends: Moderate activity, with xx major mergers and acquisitions reported between 2019 and 2024.
3D Cardiac Mapping Systems Market Growth Trends & Insights
The global 3D Cardiac Mapping Systems market experienced substantial growth during the historical period (2019-2024), driven by increasing prevalence of cardiac arrhythmias, technological advancements, and rising healthcare expenditure. The market is projected to witness a Compound Annual Growth Rate (CAGR) of xx% during the forecast period (2025-2033), reaching an estimated xx Million units by 2033. This growth is fueled by the increasing adoption of minimally invasive procedures, the growing demand for advanced diagnostic tools, and the expanding geriatric population. Market penetration remains relatively low in emerging economies, representing a significant growth opportunity. Technological disruptions, such as the integration of AI and machine learning, are further accelerating market expansion and improving diagnostic accuracy. Shifts in consumer behavior toward minimally invasive procedures are also positively impacting market growth.
Dominant Regions, Countries, or Segments in 3D Cardiac Mapping Systems Market
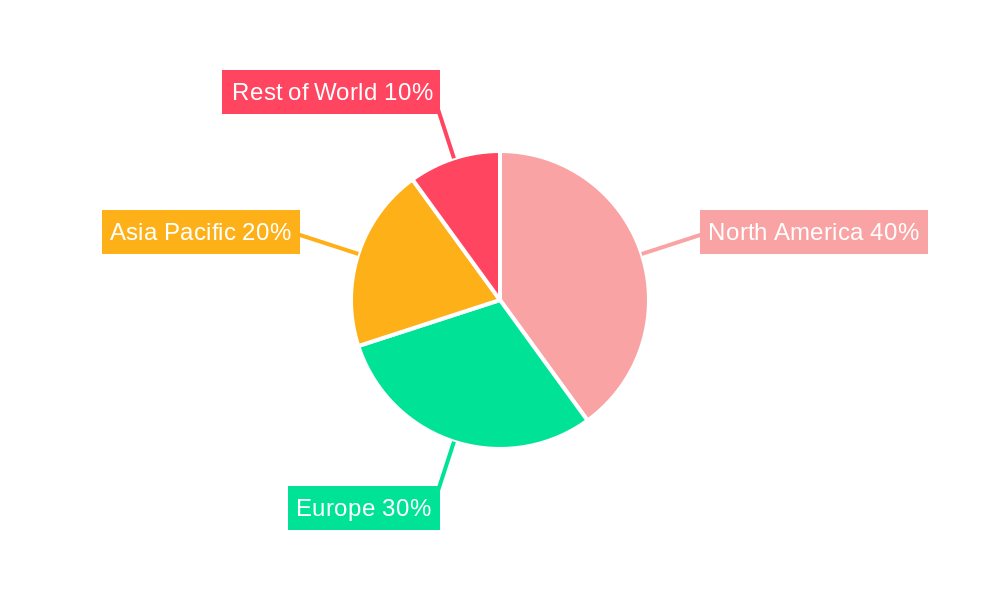
North America currently dominates the 3D Cardiac Mapping Systems market, driven by advanced healthcare infrastructure, high adoption rates of advanced technologies, and favorable reimbursement policies. Europe follows as a significant market, fueled by the rising prevalence of cardiovascular diseases. Asia-Pacific is expected to exhibit the highest growth rate during the forecast period, owing to increasing healthcare investments, growing awareness of cardiac diseases, and rising disposable incomes.
- North America: High adoption rates, advanced healthcare infrastructure, favorable reimbursement policies.
- Europe: Significant market share, driven by rising prevalence of cardiovascular diseases.
- Asia-Pacific: Fastest-growing region, driven by increasing healthcare investments and rising disposable incomes.
- Rest of the World: Steady growth, with potential for expansion in untapped markets.
3D Cardiac Mapping Systems Market Product Landscape
The 3D cardiac mapping systems market offers a range of products, including systems with varying levels of image resolution, software functionalities, and catheter designs. Key features include real-time 3D visualization of the heart, advanced mapping algorithms for accurate lesion localization, and integration with ablation systems for treatment guidance. Technological advancements focus on improving image quality, minimizing invasiveness, and incorporating AI for improved diagnostic accuracy and treatment planning. Unique selling propositions often include ease of use, integration with existing workflows, and enhanced clinical outcomes.
Key Drivers, Barriers & Challenges in 3D Cardiac Mapping Systems Market
Key Drivers:
- Increasing prevalence of cardiac arrhythmias globally.
- Technological advancements leading to improved accuracy and efficiency.
- Rising healthcare expenditure and investment in advanced medical technologies.
- Growing demand for minimally invasive procedures.
Challenges & Restraints:
- High initial cost of the systems, limiting accessibility in resource-constrained settings.
- Stringent regulatory approvals and reimbursement complexities.
- Potential for technical malfunctions and complications during procedures. This leads to approximately xx% of procedures experiencing minor delays due to technical issues.
- Intense competition among major players.
Emerging Opportunities in 3D Cardiac Mapping Systems Market
- Expansion into emerging markets with growing healthcare infrastructure.
- Development of innovative applications for different types of cardiac arrhythmias.
- Integration of AI and machine learning for improved diagnostic accuracy and treatment planning.
- Development of more user-friendly and cost-effective systems.
Growth Accelerators in the 3D Cardiac Mapping Systems Market Industry
The long-term growth of the 3D cardiac mapping systems market is expected to be driven by continued technological advancements, strategic partnerships between manufacturers and healthcare providers, and expansion into new geographic markets. Furthermore, the increasing adoption of telehealth and remote monitoring technologies has the potential to expand the reach of these systems.
Key Players Shaping the 3D Cardiac Mapping Systems Market Market
- Olympus Corporation
- Medtronic
- GE Healthcare
- Siemens Healthineers AG
- Smith + Nephew
- Abbott
- Intuitive Surgical Inc
- Koninklijke Philips NV
- Stryker Corporation
- Zimmer Biomet
- List Not Exhaustive
Notable Milestones in 3D Cardiac Mapping Systems Market Sector
- May 2024: Biosense Webster Inc. launched the CARTO 3 System Version 8, enhancing 3D heart mapping capabilities for cardiac ablation procedures.
- March 2023: Medtronic received CE Mark for the Affer Mapping and Ablation System, expanding treatment options.
In-Depth 3D Cardiac Mapping Systems Market Market Outlook
The future of the 3D cardiac mapping systems market is promising, with continued growth driven by technological innovations, expanding applications, and increasing demand for precise and minimally invasive cardiac procedures. Strategic partnerships, expansion into untapped markets, and the development of AI-powered systems will further fuel market expansion. The market is poised for significant growth in the coming years, offering substantial opportunities for industry players.
3D Cardiac Mapping Systems Market Segmentation
-
1. Technology
- 1.1. Electroanatomical Mapping
- 1.2. Basket Catheter Mapping
- 1.3. Real-time Positional Management
-
2. End User
- 2.1. Hospitals
- 2.2. Clinics
- 2.3. Diagnostic Centers
3D Cardiac Mapping Systems Market Segmentation By Geography
-
1. North America
- 1.1. United States
- 1.2. Canada
- 1.3. Mexico
-
2. Europe
- 2.1. Germany
- 2.2. United Kingdom
- 2.3. France
- 2.4. Italy
- 2.5. Spain
- 2.6. Rest of Europe
-
3. Asia Pacific
- 3.1. China
- 3.2. Japan
- 3.3. India
- 3.4. Australia
- 3.5. South Korea
- 3.6. Rest of Asia Pacific
-
4. Middle East and Africa
- 4.1. GCC
- 4.2. South Africa
- 4.3. Rest of Middle East and Africa
-
5. South America
- 5.1. Brazil
- 5.2. Argentina
- 5.3. Rest of South America
3D Cardiac Mapping Systems Market REPORT HIGHLIGHTS
| Aspects | Details |
|---|---|
| Study Period | 2019-2033 |
| Base Year | 2024 |
| Estimated Year | 2025 |
| Forecast Period | 2025-2033 |
| Historical Period | 2019-2024 |
| Growth Rate | CAGR of 11.40% from 2019-2033 |
| Segmentation |
|
Table of Contents
- 1. Introduction
- 1.1. Research Scope
- 1.2. Market Segmentation
- 1.3. Research Methodology
- 1.4. Definitions and Assumptions
- 2. Executive Summary
- 2.1. Introduction
- 3. Market Dynamics
- 3.1. Introduction
- 3.2. Market Drivers
- 3.2.1. Rising Prevalence of Cardiovascular Diseases Coupled with the Rising Geriatric Population; Increasing Number of Technological Advancements
- 3.3. Market Restrains
- 3.3.1. Rising Prevalence of Cardiovascular Diseases Coupled with the Rising Geriatric Population; Increasing Number of Technological Advancements
- 3.4. Market Trends
- 3.4.1. The Electroanatomical Mapping Segment is Expected to Hold Significant Market Share During the Forecast Period
- 4. Market Factor Analysis
- 4.1. Porters Five Forces
- 4.2. Supply/Value Chain
- 4.3. PESTEL analysis
- 4.4. Market Entropy
- 4.5. Patent/Trademark Analysis
- 5. Global 3D Cardiac Mapping Systems Market Analysis, Insights and Forecast, 2019-2031
- 5.1. Market Analysis, Insights and Forecast - by Technology
- 5.1.1. Electroanatomical Mapping
- 5.1.2. Basket Catheter Mapping
- 5.1.3. Real-time Positional Management
- 5.2. Market Analysis, Insights and Forecast - by End User
- 5.2.1. Hospitals
- 5.2.2. Clinics
- 5.2.3. Diagnostic Centers
- 5.3. Market Analysis, Insights and Forecast - by Region
- 5.3.1. North America
- 5.3.2. Europe
- 5.3.3. Asia Pacific
- 5.3.4. Middle East and Africa
- 5.3.5. South America
- 5.1. Market Analysis, Insights and Forecast - by Technology
- 6. North America 3D Cardiac Mapping Systems Market Analysis, Insights and Forecast, 2019-2031
- 6.1. Market Analysis, Insights and Forecast - by Technology
- 6.1.1. Electroanatomical Mapping
- 6.1.2. Basket Catheter Mapping
- 6.1.3. Real-time Positional Management
- 6.2. Market Analysis, Insights and Forecast - by End User
- 6.2.1. Hospitals
- 6.2.2. Clinics
- 6.2.3. Diagnostic Centers
- 6.1. Market Analysis, Insights and Forecast - by Technology
- 7. Europe 3D Cardiac Mapping Systems Market Analysis, Insights and Forecast, 2019-2031
- 7.1. Market Analysis, Insights and Forecast - by Technology
- 7.1.1. Electroanatomical Mapping
- 7.1.2. Basket Catheter Mapping
- 7.1.3. Real-time Positional Management
- 7.2. Market Analysis, Insights and Forecast - by End User
- 7.2.1. Hospitals
- 7.2.2. Clinics
- 7.2.3. Diagnostic Centers
- 7.1. Market Analysis, Insights and Forecast - by Technology
- 8. Asia Pacific 3D Cardiac Mapping Systems Market Analysis, Insights and Forecast, 2019-2031
- 8.1. Market Analysis, Insights and Forecast - by Technology
- 8.1.1. Electroanatomical Mapping
- 8.1.2. Basket Catheter Mapping
- 8.1.3. Real-time Positional Management
- 8.2. Market Analysis, Insights and Forecast - by End User
- 8.2.1. Hospitals
- 8.2.2. Clinics
- 8.2.3. Diagnostic Centers
- 8.1. Market Analysis, Insights and Forecast - by Technology
- 9. Middle East and Africa 3D Cardiac Mapping Systems Market Analysis, Insights and Forecast, 2019-2031
- 9.1. Market Analysis, Insights and Forecast - by Technology
- 9.1.1. Electroanatomical Mapping
- 9.1.2. Basket Catheter Mapping
- 9.1.3. Real-time Positional Management
- 9.2. Market Analysis, Insights and Forecast - by End User
- 9.2.1. Hospitals
- 9.2.2. Clinics
- 9.2.3. Diagnostic Centers
- 9.1. Market Analysis, Insights and Forecast - by Technology
- 10. South America 3D Cardiac Mapping Systems Market Analysis, Insights and Forecast, 2019-2031
- 10.1. Market Analysis, Insights and Forecast - by Technology
- 10.1.1. Electroanatomical Mapping
- 10.1.2. Basket Catheter Mapping
- 10.1.3. Real-time Positional Management
- 10.2. Market Analysis, Insights and Forecast - by End User
- 10.2.1. Hospitals
- 10.2.2. Clinics
- 10.2.3. Diagnostic Centers
- 10.1. Market Analysis, Insights and Forecast - by Technology
- 11. Competitive Analysis
- 11.1. Global Market Share Analysis 2024
- 11.2. Company Profiles
- 11.2.1 Olympus Corporation
- 11.2.1.1. Overview
- 11.2.1.2. Products
- 11.2.1.3. SWOT Analysis
- 11.2.1.4. Recent Developments
- 11.2.1.5. Financials (Based on Availability)
- 11.2.2 Medtronic
- 11.2.2.1. Overview
- 11.2.2.2. Products
- 11.2.2.3. SWOT Analysis
- 11.2.2.4. Recent Developments
- 11.2.2.5. Financials (Based on Availability)
- 11.2.3 GE Healthcare
- 11.2.3.1. Overview
- 11.2.3.2. Products
- 11.2.3.3. SWOT Analysis
- 11.2.3.4. Recent Developments
- 11.2.3.5. Financials (Based on Availability)
- 11.2.4 Siemens Healthineers AG
- 11.2.4.1. Overview
- 11.2.4.2. Products
- 11.2.4.3. SWOT Analysis
- 11.2.4.4. Recent Developments
- 11.2.4.5. Financials (Based on Availability)
- 11.2.5 Smith + Nephew
- 11.2.5.1. Overview
- 11.2.5.2. Products
- 11.2.5.3. SWOT Analysis
- 11.2.5.4. Recent Developments
- 11.2.5.5. Financials (Based on Availability)
- 11.2.6 Abbott
- 11.2.6.1. Overview
- 11.2.6.2. Products
- 11.2.6.3. SWOT Analysis
- 11.2.6.4. Recent Developments
- 11.2.6.5. Financials (Based on Availability)
- 11.2.7 Intuitive Surgical Inc
- 11.2.7.1. Overview
- 11.2.7.2. Products
- 11.2.7.3. SWOT Analysis
- 11.2.7.4. Recent Developments
- 11.2.7.5. Financials (Based on Availability)
- 11.2.8 Koninklijke Philips NV
- 11.2.8.1. Overview
- 11.2.8.2. Products
- 11.2.8.3. SWOT Analysis
- 11.2.8.4. Recent Developments
- 11.2.8.5. Financials (Based on Availability)
- 11.2.9 Stryker Corporation
- 11.2.9.1. Overview
- 11.2.9.2. Products
- 11.2.9.3. SWOT Analysis
- 11.2.9.4. Recent Developments
- 11.2.9.5. Financials (Based on Availability)
- 11.2.10 Zimmer Biomet*List Not Exhaustive
- 11.2.10.1. Overview
- 11.2.10.2. Products
- 11.2.10.3. SWOT Analysis
- 11.2.10.4. Recent Developments
- 11.2.10.5. Financials (Based on Availability)
- 11.2.1 Olympus Corporation
List of Figures
- Figure 1: Global 3D Cardiac Mapping Systems Market Revenue Breakdown (Million, %) by Region 2024 & 2032
- Figure 2: Global 3D Cardiac Mapping Systems Market Volume Breakdown (Million, %) by Region 2024 & 2032
- Figure 3: North America 3D Cardiac Mapping Systems Market Revenue (Million), by Technology 2024 & 2032
- Figure 4: North America 3D Cardiac Mapping Systems Market Volume (Million), by Technology 2024 & 2032
- Figure 5: North America 3D Cardiac Mapping Systems Market Revenue Share (%), by Technology 2024 & 2032
- Figure 6: North America 3D Cardiac Mapping Systems Market Volume Share (%), by Technology 2024 & 2032
- Figure 7: North America 3D Cardiac Mapping Systems Market Revenue (Million), by End User 2024 & 2032
- Figure 8: North America 3D Cardiac Mapping Systems Market Volume (Million), by End User 2024 & 2032
- Figure 9: North America 3D Cardiac Mapping Systems Market Revenue Share (%), by End User 2024 & 2032
- Figure 10: North America 3D Cardiac Mapping Systems Market Volume Share (%), by End User 2024 & 2032
- Figure 11: North America 3D Cardiac Mapping Systems Market Revenue (Million), by Country 2024 & 2032
- Figure 12: North America 3D Cardiac Mapping Systems Market Volume (Million), by Country 2024 & 2032
- Figure 13: North America 3D Cardiac Mapping Systems Market Revenue Share (%), by Country 2024 & 2032
- Figure 14: North America 3D Cardiac Mapping Systems Market Volume Share (%), by Country 2024 & 2032
- Figure 15: Europe 3D Cardiac Mapping Systems Market Revenue (Million), by Technology 2024 & 2032
- Figure 16: Europe 3D Cardiac Mapping Systems Market Volume (Million), by Technology 2024 & 2032
- Figure 17: Europe 3D Cardiac Mapping Systems Market Revenue Share (%), by Technology 2024 & 2032
- Figure 18: Europe 3D Cardiac Mapping Systems Market Volume Share (%), by Technology 2024 & 2032
- Figure 19: Europe 3D Cardiac Mapping Systems Market Revenue (Million), by End User 2024 & 2032
- Figure 20: Europe 3D Cardiac Mapping Systems Market Volume (Million), by End User 2024 & 2032
- Figure 21: Europe 3D Cardiac Mapping Systems Market Revenue Share (%), by End User 2024 & 2032
- Figure 22: Europe 3D Cardiac Mapping Systems Market Volume Share (%), by End User 2024 & 2032
- Figure 23: Europe 3D Cardiac Mapping Systems Market Revenue (Million), by Country 2024 & 2032
- Figure 24: Europe 3D Cardiac Mapping Systems Market Volume (Million), by Country 2024 & 2032
- Figure 25: Europe 3D Cardiac Mapping Systems Market Revenue Share (%), by Country 2024 & 2032
- Figure 26: Europe 3D Cardiac Mapping Systems Market Volume Share (%), by Country 2024 & 2032
- Figure 27: Asia Pacific 3D Cardiac Mapping Systems Market Revenue (Million), by Technology 2024 & 2032
- Figure 28: Asia Pacific 3D Cardiac Mapping Systems Market Volume (Million), by Technology 2024 & 2032
- Figure 29: Asia Pacific 3D Cardiac Mapping Systems Market Revenue Share (%), by Technology 2024 & 2032
- Figure 30: Asia Pacific 3D Cardiac Mapping Systems Market Volume Share (%), by Technology 2024 & 2032
- Figure 31: Asia Pacific 3D Cardiac Mapping Systems Market Revenue (Million), by End User 2024 & 2032
- Figure 32: Asia Pacific 3D Cardiac Mapping Systems Market Volume (Million), by End User 2024 & 2032
- Figure 33: Asia Pacific 3D Cardiac Mapping Systems Market Revenue Share (%), by End User 2024 & 2032
- Figure 34: Asia Pacific 3D Cardiac Mapping Systems Market Volume Share (%), by End User 2024 & 2032
- Figure 35: Asia Pacific 3D Cardiac Mapping Systems Market Revenue (Million), by Country 2024 & 2032
- Figure 36: Asia Pacific 3D Cardiac Mapping Systems Market Volume (Million), by Country 2024 & 2032
- Figure 37: Asia Pacific 3D Cardiac Mapping Systems Market Revenue Share (%), by Country 2024 & 2032
- Figure 38: Asia Pacific 3D Cardiac Mapping Systems Market Volume Share (%), by Country 2024 & 2032
- Figure 39: Middle East and Africa 3D Cardiac Mapping Systems Market Revenue (Million), by Technology 2024 & 2032
- Figure 40: Middle East and Africa 3D Cardiac Mapping Systems Market Volume (Million), by Technology 2024 & 2032
- Figure 41: Middle East and Africa 3D Cardiac Mapping Systems Market Revenue Share (%), by Technology 2024 & 2032
- Figure 42: Middle East and Africa 3D Cardiac Mapping Systems Market Volume Share (%), by Technology 2024 & 2032
- Figure 43: Middle East and Africa 3D Cardiac Mapping Systems Market Revenue (Million), by End User 2024 & 2032
- Figure 44: Middle East and Africa 3D Cardiac Mapping Systems Market Volume (Million), by End User 2024 & 2032
- Figure 45: Middle East and Africa 3D Cardiac Mapping Systems Market Revenue Share (%), by End User 2024 & 2032
- Figure 46: Middle East and Africa 3D Cardiac Mapping Systems Market Volume Share (%), by End User 2024 & 2032
- Figure 47: Middle East and Africa 3D Cardiac Mapping Systems Market Revenue (Million), by Country 2024 & 2032
- Figure 48: Middle East and Africa 3D Cardiac Mapping Systems Market Volume (Million), by Country 2024 & 2032
- Figure 49: Middle East and Africa 3D Cardiac Mapping Systems Market Revenue Share (%), by Country 2024 & 2032
- Figure 50: Middle East and Africa 3D Cardiac Mapping Systems Market Volume Share (%), by Country 2024 & 2032
- Figure 51: South America 3D Cardiac Mapping Systems Market Revenue (Million), by Technology 2024 & 2032
- Figure 52: South America 3D Cardiac Mapping Systems Market Volume (Million), by Technology 2024 & 2032
- Figure 53: South America 3D Cardiac Mapping Systems Market Revenue Share (%), by Technology 2024 & 2032
- Figure 54: South America 3D Cardiac Mapping Systems Market Volume Share (%), by Technology 2024 & 2032
- Figure 55: South America 3D Cardiac Mapping Systems Market Revenue (Million), by End User 2024 & 2032
- Figure 56: South America 3D Cardiac Mapping Systems Market Volume (Million), by End User 2024 & 2032
- Figure 57: South America 3D Cardiac Mapping Systems Market Revenue Share (%), by End User 2024 & 2032
- Figure 58: South America 3D Cardiac Mapping Systems Market Volume Share (%), by End User 2024 & 2032
- Figure 59: South America 3D Cardiac Mapping Systems Market Revenue (Million), by Country 2024 & 2032
- Figure 60: South America 3D Cardiac Mapping Systems Market Volume (Million), by Country 2024 & 2032
- Figure 61: South America 3D Cardiac Mapping Systems Market Revenue Share (%), by Country 2024 & 2032
- Figure 62: South America 3D Cardiac Mapping Systems Market Volume Share (%), by Country 2024 & 2032
List of Tables
- Table 1: Global 3D Cardiac Mapping Systems Market Revenue Million Forecast, by Region 2019 & 2032
- Table 2: Global 3D Cardiac Mapping Systems Market Volume Million Forecast, by Region 2019 & 2032
- Table 3: Global 3D Cardiac Mapping Systems Market Revenue Million Forecast, by Technology 2019 & 2032
- Table 4: Global 3D Cardiac Mapping Systems Market Volume Million Forecast, by Technology 2019 & 2032
- Table 5: Global 3D Cardiac Mapping Systems Market Revenue Million Forecast, by End User 2019 & 2032
- Table 6: Global 3D Cardiac Mapping Systems Market Volume Million Forecast, by End User 2019 & 2032
- Table 7: Global 3D Cardiac Mapping Systems Market Revenue Million Forecast, by Region 2019 & 2032
- Table 8: Global 3D Cardiac Mapping Systems Market Volume Million Forecast, by Region 2019 & 2032
- Table 9: Global 3D Cardiac Mapping Systems Market Revenue Million Forecast, by Technology 2019 & 2032
- Table 10: Global 3D Cardiac Mapping Systems Market Volume Million Forecast, by Technology 2019 & 2032
- Table 11: Global 3D Cardiac Mapping Systems Market Revenue Million Forecast, by End User 2019 & 2032
- Table 12: Global 3D Cardiac Mapping Systems Market Volume Million Forecast, by End User 2019 & 2032
- Table 13: Global 3D Cardiac Mapping Systems Market Revenue Million Forecast, by Country 2019 & 2032
- Table 14: Global 3D Cardiac Mapping Systems Market Volume Million Forecast, by Country 2019 & 2032
- Table 15: United States 3D Cardiac Mapping Systems Market Revenue (Million) Forecast, by Application 2019 & 2032
- Table 16: United States 3D Cardiac Mapping Systems Market Volume (Million) Forecast, by Application 2019 & 2032
- Table 17: Canada 3D Cardiac Mapping Systems Market Revenue (Million) Forecast, by Application 2019 & 2032
- Table 18: Canada 3D Cardiac Mapping Systems Market Volume (Million) Forecast, by Application 2019 & 2032
- Table 19: Mexico 3D Cardiac Mapping Systems Market Revenue (Million) Forecast, by Application 2019 & 2032
- Table 20: Mexico 3D Cardiac Mapping Systems Market Volume (Million) Forecast, by Application 2019 & 2032
- Table 21: Global 3D Cardiac Mapping Systems Market Revenue Million Forecast, by Technology 2019 & 2032
- Table 22: Global 3D Cardiac Mapping Systems Market Volume Million Forecast, by Technology 2019 & 2032
- Table 23: Global 3D Cardiac Mapping Systems Market Revenue Million Forecast, by End User 2019 & 2032
- Table 24: Global 3D Cardiac Mapping Systems Market Volume Million Forecast, by End User 2019 & 2032
- Table 25: Global 3D Cardiac Mapping Systems Market Revenue Million Forecast, by Country 2019 & 2032
- Table 26: Global 3D Cardiac Mapping Systems Market Volume Million Forecast, by Country 2019 & 2032
- Table 27: Germany 3D Cardiac Mapping Systems Market Revenue (Million) Forecast, by Application 2019 & 2032
- Table 28: Germany 3D Cardiac Mapping Systems Market Volume (Million) Forecast, by Application 2019 & 2032
- Table 29: United Kingdom 3D Cardiac Mapping Systems Market Revenue (Million) Forecast, by Application 2019 & 2032
- Table 30: United Kingdom 3D Cardiac Mapping Systems Market Volume (Million) Forecast, by Application 2019 & 2032
- Table 31: France 3D Cardiac Mapping Systems Market Revenue (Million) Forecast, by Application 2019 & 2032
- Table 32: France 3D Cardiac Mapping Systems Market Volume (Million) Forecast, by Application 2019 & 2032
- Table 33: Italy 3D Cardiac Mapping Systems Market Revenue (Million) Forecast, by Application 2019 & 2032
- Table 34: Italy 3D Cardiac Mapping Systems Market Volume (Million) Forecast, by Application 2019 & 2032
- Table 35: Spain 3D Cardiac Mapping Systems Market Revenue (Million) Forecast, by Application 2019 & 2032
- Table 36: Spain 3D Cardiac Mapping Systems Market Volume (Million) Forecast, by Application 2019 & 2032
- Table 37: Rest of Europe 3D Cardiac Mapping Systems Market Revenue (Million) Forecast, by Application 2019 & 2032
- Table 38: Rest of Europe 3D Cardiac Mapping Systems Market Volume (Million) Forecast, by Application 2019 & 2032
- Table 39: Global 3D Cardiac Mapping Systems Market Revenue Million Forecast, by Technology 2019 & 2032
- Table 40: Global 3D Cardiac Mapping Systems Market Volume Million Forecast, by Technology 2019 & 2032
- Table 41: Global 3D Cardiac Mapping Systems Market Revenue Million Forecast, by End User 2019 & 2032
- Table 42: Global 3D Cardiac Mapping Systems Market Volume Million Forecast, by End User 2019 & 2032
- Table 43: Global 3D Cardiac Mapping Systems Market Revenue Million Forecast, by Country 2019 & 2032
- Table 44: Global 3D Cardiac Mapping Systems Market Volume Million Forecast, by Country 2019 & 2032
- Table 45: China 3D Cardiac Mapping Systems Market Revenue (Million) Forecast, by Application 2019 & 2032
- Table 46: China 3D Cardiac Mapping Systems Market Volume (Million) Forecast, by Application 2019 & 2032
- Table 47: Japan 3D Cardiac Mapping Systems Market Revenue (Million) Forecast, by Application 2019 & 2032
- Table 48: Japan 3D Cardiac Mapping Systems Market Volume (Million) Forecast, by Application 2019 & 2032
- Table 49: India 3D Cardiac Mapping Systems Market Revenue (Million) Forecast, by Application 2019 & 2032
- Table 50: India 3D Cardiac Mapping Systems Market Volume (Million) Forecast, by Application 2019 & 2032
- Table 51: Australia 3D Cardiac Mapping Systems Market Revenue (Million) Forecast, by Application 2019 & 2032
- Table 52: Australia 3D Cardiac Mapping Systems Market Volume (Million) Forecast, by Application 2019 & 2032
- Table 53: South Korea 3D Cardiac Mapping Systems Market Revenue (Million) Forecast, by Application 2019 & 2032
- Table 54: South Korea 3D Cardiac Mapping Systems Market Volume (Million) Forecast, by Application 2019 & 2032
- Table 55: Rest of Asia Pacific 3D Cardiac Mapping Systems Market Revenue (Million) Forecast, by Application 2019 & 2032
- Table 56: Rest of Asia Pacific 3D Cardiac Mapping Systems Market Volume (Million) Forecast, by Application 2019 & 2032
- Table 57: Global 3D Cardiac Mapping Systems Market Revenue Million Forecast, by Technology 2019 & 2032
- Table 58: Global 3D Cardiac Mapping Systems Market Volume Million Forecast, by Technology 2019 & 2032
- Table 59: Global 3D Cardiac Mapping Systems Market Revenue Million Forecast, by End User 2019 & 2032
- Table 60: Global 3D Cardiac Mapping Systems Market Volume Million Forecast, by End User 2019 & 2032
- Table 61: Global 3D Cardiac Mapping Systems Market Revenue Million Forecast, by Country 2019 & 2032
- Table 62: Global 3D Cardiac Mapping Systems Market Volume Million Forecast, by Country 2019 & 2032
- Table 63: GCC 3D Cardiac Mapping Systems Market Revenue (Million) Forecast, by Application 2019 & 2032
- Table 64: GCC 3D Cardiac Mapping Systems Market Volume (Million) Forecast, by Application 2019 & 2032
- Table 65: South Africa 3D Cardiac Mapping Systems Market Revenue (Million) Forecast, by Application 2019 & 2032
- Table 66: South Africa 3D Cardiac Mapping Systems Market Volume (Million) Forecast, by Application 2019 & 2032
- Table 67: Rest of Middle East and Africa 3D Cardiac Mapping Systems Market Revenue (Million) Forecast, by Application 2019 & 2032
- Table 68: Rest of Middle East and Africa 3D Cardiac Mapping Systems Market Volume (Million) Forecast, by Application 2019 & 2032
- Table 69: Global 3D Cardiac Mapping Systems Market Revenue Million Forecast, by Technology 2019 & 2032
- Table 70: Global 3D Cardiac Mapping Systems Market Volume Million Forecast, by Technology 2019 & 2032
- Table 71: Global 3D Cardiac Mapping Systems Market Revenue Million Forecast, by End User 2019 & 2032
- Table 72: Global 3D Cardiac Mapping Systems Market Volume Million Forecast, by End User 2019 & 2032
- Table 73: Global 3D Cardiac Mapping Systems Market Revenue Million Forecast, by Country 2019 & 2032
- Table 74: Global 3D Cardiac Mapping Systems Market Volume Million Forecast, by Country 2019 & 2032
- Table 75: Brazil 3D Cardiac Mapping Systems Market Revenue (Million) Forecast, by Application 2019 & 2032
- Table 76: Brazil 3D Cardiac Mapping Systems Market Volume (Million) Forecast, by Application 2019 & 2032
- Table 77: Argentina 3D Cardiac Mapping Systems Market Revenue (Million) Forecast, by Application 2019 & 2032
- Table 78: Argentina 3D Cardiac Mapping Systems Market Volume (Million) Forecast, by Application 2019 & 2032
- Table 79: Rest of South America 3D Cardiac Mapping Systems Market Revenue (Million) Forecast, by Application 2019 & 2032
- Table 80: Rest of South America 3D Cardiac Mapping Systems Market Volume (Million) Forecast, by Application 2019 & 2032
Frequently Asked Questions
1. What is the projected Compound Annual Growth Rate (CAGR) of the 3D Cardiac Mapping Systems Market?
The projected CAGR is approximately 11.40%.
2. Which companies are prominent players in the 3D Cardiac Mapping Systems Market?
Key companies in the market include Olympus Corporation, Medtronic, GE Healthcare, Siemens Healthineers AG, Smith + Nephew, Abbott, Intuitive Surgical Inc, Koninklijke Philips NV, Stryker Corporation, Zimmer Biomet*List Not Exhaustive.
3. What are the main segments of the 3D Cardiac Mapping Systems Market?
The market segments include Technology, End User.
4. Can you provide details about the market size?
The market size is estimated to be USD 538.60 Million as of 2022.
5. What are some drivers contributing to market growth?
Rising Prevalence of Cardiovascular Diseases Coupled with the Rising Geriatric Population; Increasing Number of Technological Advancements.
6. What are the notable trends driving market growth?
The Electroanatomical Mapping Segment is Expected to Hold Significant Market Share During the Forecast Period.
7. Are there any restraints impacting market growth?
Rising Prevalence of Cardiovascular Diseases Coupled with the Rising Geriatric Population; Increasing Number of Technological Advancements.
8. Can you provide examples of recent developments in the market?
May 2024: Biosense Webster Inc., a cardiac arrhythmia treatment devices provider and part of Johnson & Johnson MedTech, launched the CARTO 3 System Version 8, the latest version of the company’s leading three-dimension (3D) heart mapping system used in cardiac ablation procedures.
9. What pricing options are available for accessing the report?
Pricing options include single-user, multi-user, and enterprise licenses priced at USD 4750, USD 5250, and USD 8750 respectively.
10. Is the market size provided in terms of value or volume?
The market size is provided in terms of value, measured in Million and volume, measured in Million.
11. Are there any specific market keywords associated with the report?
Yes, the market keyword associated with the report is "3D Cardiac Mapping Systems Market," which aids in identifying and referencing the specific market segment covered.
12. How do I determine which pricing option suits my needs best?
The pricing options vary based on user requirements and access needs. Individual users may opt for single-user licenses, while businesses requiring broader access may choose multi-user or enterprise licenses for cost-effective access to the report.
13. Are there any additional resources or data provided in the 3D Cardiac Mapping Systems Market report?
While the report offers comprehensive insights, it's advisable to review the specific contents or supplementary materials provided to ascertain if additional resources or data are available.
14. How can I stay updated on further developments or reports in the 3D Cardiac Mapping Systems Market?
To stay informed about further developments, trends, and reports in the 3D Cardiac Mapping Systems Market, consider subscribing to industry newsletters, following relevant companies and organizations, or regularly checking reputable industry news sources and publications.
Methodology
Step 1 - Identification of Relevant Samples Size from Population Database


Step 2 - Approaches for Defining Global Market Size (Value, Volume* & Price*)

Note*: In applicable scenarios
Step 3 - Data Sources
Primary Research
- Web Analytics
- Survey Reports
- Research Institute
- Latest Research Reports
- Opinion Leaders
Secondary Research
- Annual Reports
- White Paper
- Latest Press Release
- Industry Association
- Paid Database
- Investor Presentations

Step 4 - Data Triangulation
Involves using different sources of information in order to increase the validity of a study
These sources are likely to be stakeholders in a program - participants, other researchers, program staff, other community members, and so on.
Then we put all data in single framework & apply various statistical tools to find out the dynamic on the market.
During the analysis stage, feedback from the stakeholder groups would be compared to determine areas of agreement as well as areas of divergence
