

Key Insights
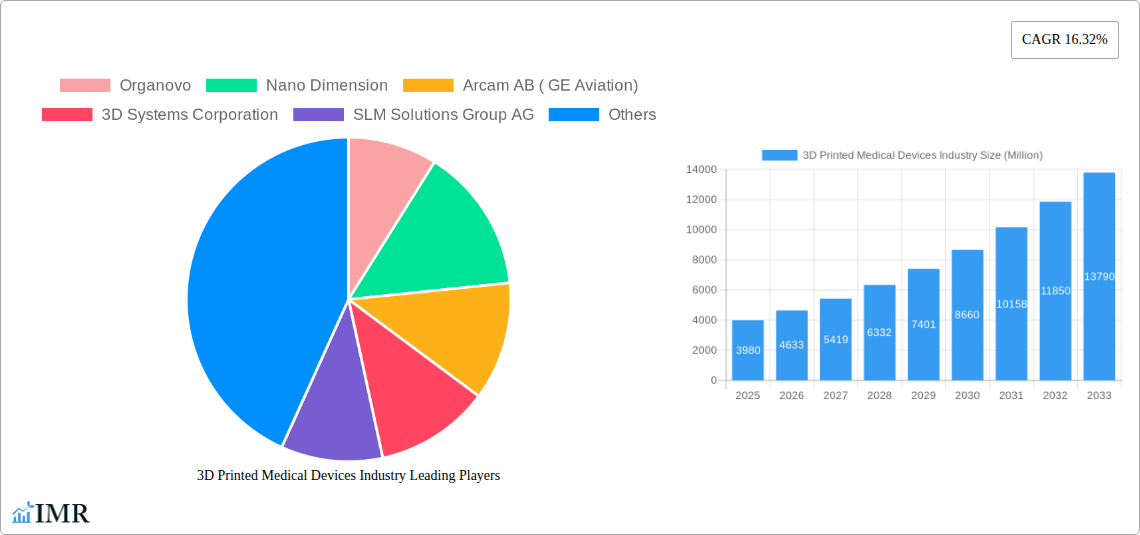
The 3D printed medical devices market is experiencing robust growth, projected to reach \$3.98 billion in 2025 and exhibiting a Compound Annual Growth Rate (CAGR) of 16.32% from 2025 to 2033. This expansion is driven by several key factors. The increasing demand for personalized medicine and customized implants tailored to individual patient needs fuels market growth. Advancements in 3D printing technologies, enabling greater precision, biocompatibility, and faster production times, are significant contributors. Furthermore, the rising prevalence of chronic diseases necessitates more sophisticated medical devices, further bolstering market demand. The ability to create complex geometries and intricate designs unattainable through traditional manufacturing methods provides a clear advantage. Growth is particularly strong in segments like surgical guides and personalized prosthetics and implants, driven by improved surgical outcomes and enhanced patient quality of life. While regulatory hurdles and material costs represent challenges, the overall market trajectory is overwhelmingly positive.
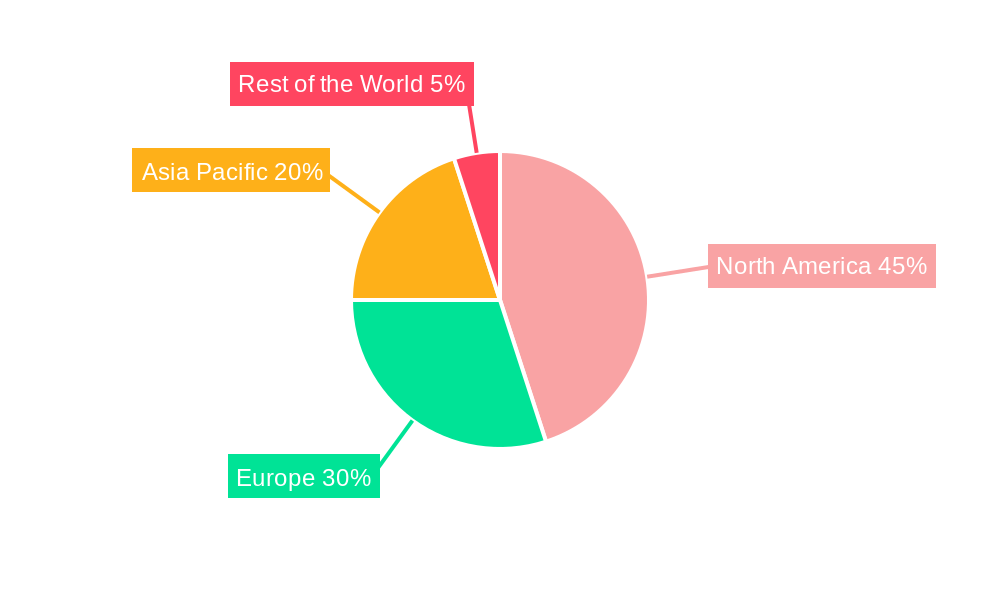
The market segmentation reveals significant opportunities across various offerings (hardware and software), device types (surgical guides, instruments, prosthetics & implants, tissue engineering products), and materials (plastics, metals & alloys, and others). North America currently holds a significant market share, owing to advanced healthcare infrastructure and technological adoption. However, the Asia-Pacific region is expected to witness substantial growth driven by increasing healthcare expenditure and a burgeoning middle class. Key players like Organovo, 3D Systems, Stratasys, and others are strategically investing in research and development, driving innovation and competition within this dynamic sector. This competitive landscape further accelerates innovation and drives down costs, making 3D printed medical devices more accessible and affordable. The continuous evolution of biocompatible materials and the integration of advanced imaging technologies into the 3D printing process will further shape the future of this exciting market.
3D Printed Medical Devices Industry: A Comprehensive Market Report (2019-2033)
This comprehensive report provides an in-depth analysis of the 3D printed medical devices market, encompassing market dynamics, growth trends, regional analysis, product landscape, key challenges and opportunities, and a detailed outlook for the forecast period 2025-2033. The study period covers 2019-2024 (historical) and 2025-2033 (forecast), with 2025 as the base year. The report is essential for industry professionals, investors, and researchers seeking a detailed understanding of this rapidly evolving sector. The market is segmented by offerings (hardware, software), device type (surgical guides, surgical instruments, prosthetics & implants, tissue engineering products), and materials (plastics, metal & metal alloy powders, others).
3D Printed Medical Devices Industry Market Dynamics & Structure
The 3D printed medical devices market is characterized by a moderately concentrated structure with several key players vying for market share. Technological innovation, particularly in materials science and additive manufacturing processes, is a primary growth driver. Stringent regulatory frameworks, however, pose significant challenges, necessitating extensive clinical trials and certifications. The market faces competition from traditional manufacturing methods, but the unique advantages of 3D printing, such as customization and reduced lead times, are gradually increasing adoption. End-user demographics are expanding, with increasing demand from hospitals, clinics, and research institutions. M&A activity within the sector is expected to remain significant, with larger companies acquiring smaller specialized firms to broaden their product portfolios and technological capabilities.
- Market Concentration: Moderately concentrated, with a top 5 market share of approximately xx%.
- Technological Innovation: Focus on biocompatible materials, improved printing resolution, and automation.
- Regulatory Framework: Stringent FDA and other international regulatory requirements impacting time-to-market.
- Competitive Substitutes: Traditional manufacturing processes (injection molding, machining).
- End-User Demographics: Hospitals, clinics, research institutions, and individual patients (prostheses).
- M&A Trends: xx M&A deals recorded in the last 5 years, driven by technology acquisition and market consolidation.
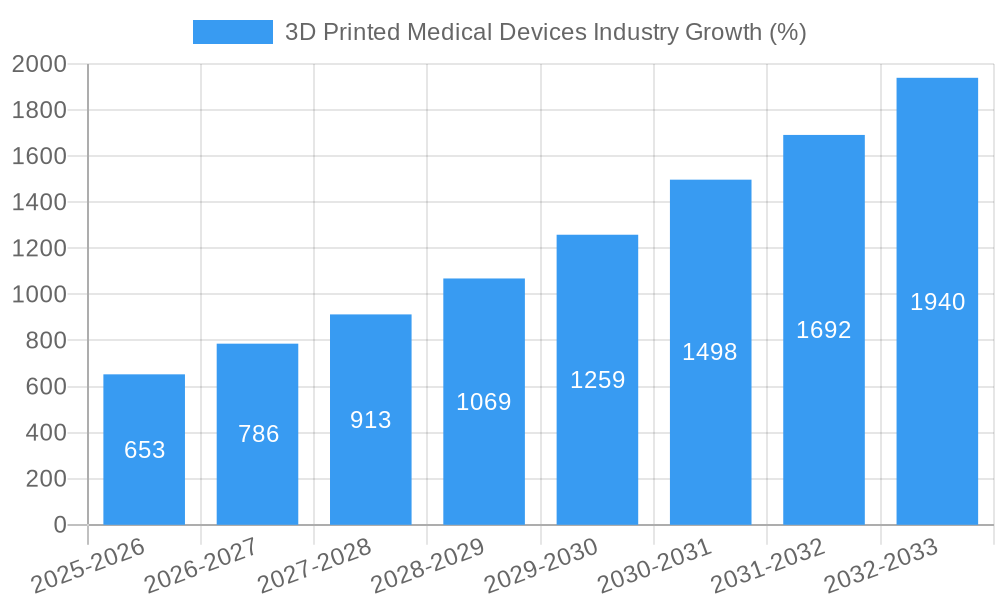
3D Printed Medical Devices Industry Growth Trends & Insights
The 3D printed medical devices market exhibits robust growth, driven by increasing demand for personalized medicine, advancements in 3D printing technologies, and favorable regulatory landscapes in key regions. The market size is estimated at xx million units in 2025 and is projected to reach xx million units by 2033, registering a CAGR of xx% during the forecast period. Adoption rates are rising across various segments, particularly in surgical guides and prosthetics. Technological disruptions, including the introduction of new materials and improved printing speeds, further accelerate market expansion. Consumer behavior shifts towards personalized healthcare and minimally invasive procedures contribute to increased demand.
Dominant Regions, Countries, or Segments in 3D Printed Medical Devices Industry
North America currently dominates the 3D printed medical devices market, driven by a strong regulatory framework, high technological adoption rates, and substantial investments in healthcare infrastructure. Europe and Asia-Pacific are also witnessing significant growth, propelled by increasing awareness and rising healthcare expenditure.
- By Offering: The hardware segment holds the largest market share, followed by the software segment.
- By Type: Surgical guides and prosthetics and implants represent major revenue contributors.
- By Material: Plastics and metal & metal alloy powders are the most prevalent materials.
- Key Drivers: High healthcare expenditure, increasing demand for personalized medicine, technological advancements.
- Dominance Factors: North America’s strong regulatory landscape and early adoption of 3D printing technology contribute to its dominance.
3D Printed Medical Devices Industry Product Landscape
3D printed medical devices offer significant advantages over traditional methods, including improved precision, customization capabilities, and faster prototyping. Innovations focus on biocompatible materials, intricate designs, and improved functionalities. For instance, the development of patient-specific implants enables precise fitting and improved patient outcomes. Technological advancements encompass faster printing speeds, improved resolution, and multi-material printing capabilities. Unique selling propositions include personalization, cost-effectiveness in long-term, and improved patient outcomes.
Key Drivers, Barriers & Challenges in 3D Printed Medical Devices Industry
Key Drivers:
- Technological advancements in materials and printing processes.
- Increasing demand for personalized medicine.
- Rising healthcare expenditure globally.
- Favorable regulatory changes in certain regions.
Challenges & Restraints:
- High initial investment costs for equipment.
- Stringent regulatory approvals and certification processes.
- Potential supply chain disruptions for specialized materials.
- Competition from traditional manufacturing methods.
- xx% of manufacturers cite regulatory hurdles as a major barrier to market entry.
Emerging Opportunities in 3D Printed Medical Devices Industry
- Expansion into untapped markets in developing economies.
- Development of new biocompatible materials with improved properties.
- Integration of artificial intelligence (AI) for design optimization and process automation.
- Focus on creating customized products for specific patients, like tailored prosthetics.
Growth Accelerators in the 3D Printed Medical Devices Industry
Technological breakthroughs, particularly in bioprinting and the development of advanced biocompatible materials, will significantly influence long-term growth. Strategic partnerships between 3D printing companies and healthcare providers will accelerate adoption and market expansion. Furthermore, initiatives focusing on education and awareness will further fuel market growth.
Key Players Shaping the 3D Printed Medical Devices Industry Market
- Organovo
- Nano Dimension
- Arcam AB (GE Aviation)
- 3D Systems Corporation
- SLM Solutions Group AG
- Renishaw plc
- Prodways Group (Groupe Gorgé)
- Carbon Inc
- Materialise NV
- Concept Laser GmbH (General Electric)
- Stratasys Ltd
- ExOne Company
Notable Milestones in 3D Printed Medical Devices Industry Sector
- 2020: FDA approval of a 3D-printed personalized implant.
- 2022: Launch of a new biocompatible material for 3D printing of medical devices.
- 2023: Partnership between a major 3D printing company and a leading hospital system.
- 2024: Acquisition of a smaller 3D printing company by a larger medical device manufacturer.
In-Depth 3D Printed Medical Devices Industry Market Outlook
The future of the 3D printed medical devices market is exceptionally promising. Continued technological advancements, coupled with increasing regulatory support and rising healthcare spending, will propel market growth over the next decade. Strategic collaborations, focused on optimizing product development and expanding market access, will further strengthen the industry. The market is poised for significant expansion, presenting lucrative opportunities for businesses involved in research, development, manufacturing, and distribution of 3D printed medical devices.
3D Printed Medical Devices Industry Segmentation
-
1. Offerings
- 1.1. Hardware
- 1.2. Software
-
2. Type
- 2.1. Surgical Guides
- 2.2. Surgical Instruments
- 2.3. Prosthetics and Implants
- 2.4. Tissue Engineering Products
-
3. Materials
- 3.1. Plastics
- 3.2. Metal & Metal Alloy Powders
- 3.3. Others
3D Printed Medical Devices Industry Segmentation By Geography
-
1. North America
- 1.1. United States
- 1.2. Canada
-
2. Europe
- 2.1. Germany
- 2.2. United Kingdom
- 2.3. France
- 2.4. Rest of Europe
-
3. Asia Pacific
- 3.1. Japan
- 3.2. China
- 3.3. India
- 3.4. Rest of Asia Pacific
-
4. Rest of the World
- 4.1. Latin America
- 4.2. Middle East
3D Printed Medical Devices Industry REPORT HIGHLIGHTS
| Aspects | Details |
|---|---|
| Study Period | 2019-2033 |
| Base Year | 2024 |
| Estimated Year | 2025 |
| Forecast Period | 2025-2033 |
| Historical Period | 2019-2024 |
| Growth Rate | CAGR of 16.32% from 2019-2033 |
| Segmentation |
|
Table of Contents
- 1. Introduction
- 1.1. Research Scope
- 1.2. Market Segmentation
- 1.3. Research Methodology
- 1.4. Definitions and Assumptions
- 2. Executive Summary
- 2.1. Introduction
- 3. Market Dynamics
- 3.1. Introduction
- 3.2. Market Drivers
- 3.2.1. ; Easy Development of Customized Medical Products Using 3D Printing; Growing Demand for Organ Transplant
- 3.3. Market Restrains
- 3.3.1. ; Stringent Regulatory Process for the Approval of 3D-Printed Medical Devices
- 3.4. Market Trends
- 3.4.1. Orthopedics and Prosthetics is Expected to Have the Fastest Growth
- 4. Market Factor Analysis
- 4.1. Porters Five Forces
- 4.2. Supply/Value Chain
- 4.3. PESTEL analysis
- 4.4. Market Entropy
- 4.5. Patent/Trademark Analysis
- 5. Global 3D Printed Medical Devices Industry Analysis, Insights and Forecast, 2019-2031
- 5.1. Market Analysis, Insights and Forecast - by Offerings
- 5.1.1. Hardware
- 5.1.2. Software
- 5.2. Market Analysis, Insights and Forecast - by Type
- 5.2.1. Surgical Guides
- 5.2.2. Surgical Instruments
- 5.2.3. Prosthetics and Implants
- 5.2.4. Tissue Engineering Products
- 5.3. Market Analysis, Insights and Forecast - by Materials
- 5.3.1. Plastics
- 5.3.2. Metal & Metal Alloy Powders
- 5.3.3. Others
- 5.4. Market Analysis, Insights and Forecast - by Region
- 5.4.1. North America
- 5.4.2. Europe
- 5.4.3. Asia Pacific
- 5.4.4. Rest of the World
- 5.1. Market Analysis, Insights and Forecast - by Offerings
- 6. North America 3D Printed Medical Devices Industry Analysis, Insights and Forecast, 2019-2031
- 6.1. Market Analysis, Insights and Forecast - by Offerings
- 6.1.1. Hardware
- 6.1.2. Software
- 6.2. Market Analysis, Insights and Forecast - by Type
- 6.2.1. Surgical Guides
- 6.2.2. Surgical Instruments
- 6.2.3. Prosthetics and Implants
- 6.2.4. Tissue Engineering Products
- 6.3. Market Analysis, Insights and Forecast - by Materials
- 6.3.1. Plastics
- 6.3.2. Metal & Metal Alloy Powders
- 6.3.3. Others
- 6.1. Market Analysis, Insights and Forecast - by Offerings
- 7. Europe 3D Printed Medical Devices Industry Analysis, Insights and Forecast, 2019-2031
- 7.1. Market Analysis, Insights and Forecast - by Offerings
- 7.1.1. Hardware
- 7.1.2. Software
- 7.2. Market Analysis, Insights and Forecast - by Type
- 7.2.1. Surgical Guides
- 7.2.2. Surgical Instruments
- 7.2.3. Prosthetics and Implants
- 7.2.4. Tissue Engineering Products
- 7.3. Market Analysis, Insights and Forecast - by Materials
- 7.3.1. Plastics
- 7.3.2. Metal & Metal Alloy Powders
- 7.3.3. Others
- 7.1. Market Analysis, Insights and Forecast - by Offerings
- 8. Asia Pacific 3D Printed Medical Devices Industry Analysis, Insights and Forecast, 2019-2031
- 8.1. Market Analysis, Insights and Forecast - by Offerings
- 8.1.1. Hardware
- 8.1.2. Software
- 8.2. Market Analysis, Insights and Forecast - by Type
- 8.2.1. Surgical Guides
- 8.2.2. Surgical Instruments
- 8.2.3. Prosthetics and Implants
- 8.2.4. Tissue Engineering Products
- 8.3. Market Analysis, Insights and Forecast - by Materials
- 8.3.1. Plastics
- 8.3.2. Metal & Metal Alloy Powders
- 8.3.3. Others
- 8.1. Market Analysis, Insights and Forecast - by Offerings
- 9. Rest of the World 3D Printed Medical Devices Industry Analysis, Insights and Forecast, 2019-2031
- 9.1. Market Analysis, Insights and Forecast - by Offerings
- 9.1.1. Hardware
- 9.1.2. Software
- 9.2. Market Analysis, Insights and Forecast - by Type
- 9.2.1. Surgical Guides
- 9.2.2. Surgical Instruments
- 9.2.3. Prosthetics and Implants
- 9.2.4. Tissue Engineering Products
- 9.3. Market Analysis, Insights and Forecast - by Materials
- 9.3.1. Plastics
- 9.3.2. Metal & Metal Alloy Powders
- 9.3.3. Others
- 9.1. Market Analysis, Insights and Forecast - by Offerings
- 10. North America 3D Printed Medical Devices Industry Analysis, Insights and Forecast, 2019-2031
- 10.1. Market Analysis, Insights and Forecast - By Country/Sub-region
- 10.1.1 United States
- 10.1.2 Canada
- 11. Europe 3D Printed Medical Devices Industry Analysis, Insights and Forecast, 2019-2031
- 11.1. Market Analysis, Insights and Forecast - By Country/Sub-region
- 11.1.1 Germany
- 11.1.2 United Kingdom
- 11.1.3 France
- 11.1.4 Rest of Europe
- 12. Asia Pacific 3D Printed Medical Devices Industry Analysis, Insights and Forecast, 2019-2031
- 12.1. Market Analysis, Insights and Forecast - By Country/Sub-region
- 12.1.1 Japan
- 12.1.2 China
- 12.1.3 India
- 12.1.4 Rest of Asia Pacific
- 13. Rest of the World 3D Printed Medical Devices Industry Analysis, Insights and Forecast, 2019-2031
- 13.1. Market Analysis, Insights and Forecast - By Country/Sub-region
- 13.1.1 Latin America
- 13.1.2 Middle East
- 14. Competitive Analysis
- 14.1. Global Market Share Analysis 2024
- 14.2. Company Profiles
- 14.2.1 Organovo
- 14.2.1.1. Overview
- 14.2.1.2. Products
- 14.2.1.3. SWOT Analysis
- 14.2.1.4. Recent Developments
- 14.2.1.5. Financials (Based on Availability)
- 14.2.2 Nano Dimension
- 14.2.2.1. Overview
- 14.2.2.2. Products
- 14.2.2.3. SWOT Analysis
- 14.2.2.4. Recent Developments
- 14.2.2.5. Financials (Based on Availability)
- 14.2.3 Arcam AB ( GE Aviation)
- 14.2.3.1. Overview
- 14.2.3.2. Products
- 14.2.3.3. SWOT Analysis
- 14.2.3.4. Recent Developments
- 14.2.3.5. Financials (Based on Availability)
- 14.2.4 3D Systems Corporation
- 14.2.4.1. Overview
- 14.2.4.2. Products
- 14.2.4.3. SWOT Analysis
- 14.2.4.4. Recent Developments
- 14.2.4.5. Financials (Based on Availability)
- 14.2.5 SLM Solutions Group AG
- 14.2.5.1. Overview
- 14.2.5.2. Products
- 14.2.5.3. SWOT Analysis
- 14.2.5.4. Recent Developments
- 14.2.5.5. Financials (Based on Availability)
- 14.2.6 Renishaw plc
- 14.2.6.1. Overview
- 14.2.6.2. Products
- 14.2.6.3. SWOT Analysis
- 14.2.6.4. Recent Developments
- 14.2.6.5. Financials (Based on Availability)
- 14.2.7 Prodways Group ( Groupe Gorge )
- 14.2.7.1. Overview
- 14.2.7.2. Products
- 14.2.7.3. SWOT Analysis
- 14.2.7.4. Recent Developments
- 14.2.7.5. Financials (Based on Availability)
- 14.2.8 Carbon Inc
- 14.2.8.1. Overview
- 14.2.8.2. Products
- 14.2.8.3. SWOT Analysis
- 14.2.8.4. Recent Developments
- 14.2.8.5. Financials (Based on Availability)
- 14.2.9 Materialise NV
- 14.2.9.1. Overview
- 14.2.9.2. Products
- 14.2.9.3. SWOT Analysis
- 14.2.9.4. Recent Developments
- 14.2.9.5. Financials (Based on Availability)
- 14.2.10 Concept Laser GmbH ( General Electric )*List Not Exhaustive
- 14.2.10.1. Overview
- 14.2.10.2. Products
- 14.2.10.3. SWOT Analysis
- 14.2.10.4. Recent Developments
- 14.2.10.5. Financials (Based on Availability)
- 14.2.11 Stratasys Ltd
- 14.2.11.1. Overview
- 14.2.11.2. Products
- 14.2.11.3. SWOT Analysis
- 14.2.11.4. Recent Developments
- 14.2.11.5. Financials (Based on Availability)
- 14.2.12 ExOne Company
- 14.2.12.1. Overview
- 14.2.12.2. Products
- 14.2.12.3. SWOT Analysis
- 14.2.12.4. Recent Developments
- 14.2.12.5. Financials (Based on Availability)
- 14.2.1 Organovo
List of Figures
- Figure 1: Global 3D Printed Medical Devices Industry Revenue Breakdown (Million, %) by Region 2024 & 2032
- Figure 2: North America 3D Printed Medical Devices Industry Revenue (Million), by Country 2024 & 2032
- Figure 3: North America 3D Printed Medical Devices Industry Revenue Share (%), by Country 2024 & 2032
- Figure 4: Europe 3D Printed Medical Devices Industry Revenue (Million), by Country 2024 & 2032
- Figure 5: Europe 3D Printed Medical Devices Industry Revenue Share (%), by Country 2024 & 2032
- Figure 6: Asia Pacific 3D Printed Medical Devices Industry Revenue (Million), by Country 2024 & 2032
- Figure 7: Asia Pacific 3D Printed Medical Devices Industry Revenue Share (%), by Country 2024 & 2032
- Figure 8: Rest of the World 3D Printed Medical Devices Industry Revenue (Million), by Country 2024 & 2032
- Figure 9: Rest of the World 3D Printed Medical Devices Industry Revenue Share (%), by Country 2024 & 2032
- Figure 10: North America 3D Printed Medical Devices Industry Revenue (Million), by Offerings 2024 & 2032
- Figure 11: North America 3D Printed Medical Devices Industry Revenue Share (%), by Offerings 2024 & 2032
- Figure 12: North America 3D Printed Medical Devices Industry Revenue (Million), by Type 2024 & 2032
- Figure 13: North America 3D Printed Medical Devices Industry Revenue Share (%), by Type 2024 & 2032
- Figure 14: North America 3D Printed Medical Devices Industry Revenue (Million), by Materials 2024 & 2032
- Figure 15: North America 3D Printed Medical Devices Industry Revenue Share (%), by Materials 2024 & 2032
- Figure 16: North America 3D Printed Medical Devices Industry Revenue (Million), by Country 2024 & 2032
- Figure 17: North America 3D Printed Medical Devices Industry Revenue Share (%), by Country 2024 & 2032
- Figure 18: Europe 3D Printed Medical Devices Industry Revenue (Million), by Offerings 2024 & 2032
- Figure 19: Europe 3D Printed Medical Devices Industry Revenue Share (%), by Offerings 2024 & 2032
- Figure 20: Europe 3D Printed Medical Devices Industry Revenue (Million), by Type 2024 & 2032
- Figure 21: Europe 3D Printed Medical Devices Industry Revenue Share (%), by Type 2024 & 2032
- Figure 22: Europe 3D Printed Medical Devices Industry Revenue (Million), by Materials 2024 & 2032
- Figure 23: Europe 3D Printed Medical Devices Industry Revenue Share (%), by Materials 2024 & 2032
- Figure 24: Europe 3D Printed Medical Devices Industry Revenue (Million), by Country 2024 & 2032
- Figure 25: Europe 3D Printed Medical Devices Industry Revenue Share (%), by Country 2024 & 2032
- Figure 26: Asia Pacific 3D Printed Medical Devices Industry Revenue (Million), by Offerings 2024 & 2032
- Figure 27: Asia Pacific 3D Printed Medical Devices Industry Revenue Share (%), by Offerings 2024 & 2032
- Figure 28: Asia Pacific 3D Printed Medical Devices Industry Revenue (Million), by Type 2024 & 2032
- Figure 29: Asia Pacific 3D Printed Medical Devices Industry Revenue Share (%), by Type 2024 & 2032
- Figure 30: Asia Pacific 3D Printed Medical Devices Industry Revenue (Million), by Materials 2024 & 2032
- Figure 31: Asia Pacific 3D Printed Medical Devices Industry Revenue Share (%), by Materials 2024 & 2032
- Figure 32: Asia Pacific 3D Printed Medical Devices Industry Revenue (Million), by Country 2024 & 2032
- Figure 33: Asia Pacific 3D Printed Medical Devices Industry Revenue Share (%), by Country 2024 & 2032
- Figure 34: Rest of the World 3D Printed Medical Devices Industry Revenue (Million), by Offerings 2024 & 2032
- Figure 35: Rest of the World 3D Printed Medical Devices Industry Revenue Share (%), by Offerings 2024 & 2032
- Figure 36: Rest of the World 3D Printed Medical Devices Industry Revenue (Million), by Type 2024 & 2032
- Figure 37: Rest of the World 3D Printed Medical Devices Industry Revenue Share (%), by Type 2024 & 2032
- Figure 38: Rest of the World 3D Printed Medical Devices Industry Revenue (Million), by Materials 2024 & 2032
- Figure 39: Rest of the World 3D Printed Medical Devices Industry Revenue Share (%), by Materials 2024 & 2032
- Figure 40: Rest of the World 3D Printed Medical Devices Industry Revenue (Million), by Country 2024 & 2032
- Figure 41: Rest of the World 3D Printed Medical Devices Industry Revenue Share (%), by Country 2024 & 2032
List of Tables
- Table 1: Global 3D Printed Medical Devices Industry Revenue Million Forecast, by Region 2019 & 2032
- Table 2: Global 3D Printed Medical Devices Industry Revenue Million Forecast, by Offerings 2019 & 2032
- Table 3: Global 3D Printed Medical Devices Industry Revenue Million Forecast, by Type 2019 & 2032
- Table 4: Global 3D Printed Medical Devices Industry Revenue Million Forecast, by Materials 2019 & 2032
- Table 5: Global 3D Printed Medical Devices Industry Revenue Million Forecast, by Region 2019 & 2032
- Table 6: Global 3D Printed Medical Devices Industry Revenue Million Forecast, by Country 2019 & 2032
- Table 7: United States 3D Printed Medical Devices Industry Revenue (Million) Forecast, by Application 2019 & 2032
- Table 8: Canada 3D Printed Medical Devices Industry Revenue (Million) Forecast, by Application 2019 & 2032
- Table 9: Global 3D Printed Medical Devices Industry Revenue Million Forecast, by Country 2019 & 2032
- Table 10: Germany 3D Printed Medical Devices Industry Revenue (Million) Forecast, by Application 2019 & 2032
- Table 11: United Kingdom 3D Printed Medical Devices Industry Revenue (Million) Forecast, by Application 2019 & 2032
- Table 12: France 3D Printed Medical Devices Industry Revenue (Million) Forecast, by Application 2019 & 2032
- Table 13: Rest of Europe 3D Printed Medical Devices Industry Revenue (Million) Forecast, by Application 2019 & 2032
- Table 14: Global 3D Printed Medical Devices Industry Revenue Million Forecast, by Country 2019 & 2032
- Table 15: Japan 3D Printed Medical Devices Industry Revenue (Million) Forecast, by Application 2019 & 2032
- Table 16: China 3D Printed Medical Devices Industry Revenue (Million) Forecast, by Application 2019 & 2032
- Table 17: India 3D Printed Medical Devices Industry Revenue (Million) Forecast, by Application 2019 & 2032
- Table 18: Rest of Asia Pacific 3D Printed Medical Devices Industry Revenue (Million) Forecast, by Application 2019 & 2032
- Table 19: Global 3D Printed Medical Devices Industry Revenue Million Forecast, by Country 2019 & 2032
- Table 20: Latin America 3D Printed Medical Devices Industry Revenue (Million) Forecast, by Application 2019 & 2032
- Table 21: Middle East 3D Printed Medical Devices Industry Revenue (Million) Forecast, by Application 2019 & 2032
- Table 22: Global 3D Printed Medical Devices Industry Revenue Million Forecast, by Offerings 2019 & 2032
- Table 23: Global 3D Printed Medical Devices Industry Revenue Million Forecast, by Type 2019 & 2032
- Table 24: Global 3D Printed Medical Devices Industry Revenue Million Forecast, by Materials 2019 & 2032
- Table 25: Global 3D Printed Medical Devices Industry Revenue Million Forecast, by Country 2019 & 2032
- Table 26: United States 3D Printed Medical Devices Industry Revenue (Million) Forecast, by Application 2019 & 2032
- Table 27: Canada 3D Printed Medical Devices Industry Revenue (Million) Forecast, by Application 2019 & 2032
- Table 28: Global 3D Printed Medical Devices Industry Revenue Million Forecast, by Offerings 2019 & 2032
- Table 29: Global 3D Printed Medical Devices Industry Revenue Million Forecast, by Type 2019 & 2032
- Table 30: Global 3D Printed Medical Devices Industry Revenue Million Forecast, by Materials 2019 & 2032
- Table 31: Global 3D Printed Medical Devices Industry Revenue Million Forecast, by Country 2019 & 2032
- Table 32: Germany 3D Printed Medical Devices Industry Revenue (Million) Forecast, by Application 2019 & 2032
- Table 33: United Kingdom 3D Printed Medical Devices Industry Revenue (Million) Forecast, by Application 2019 & 2032
- Table 34: France 3D Printed Medical Devices Industry Revenue (Million) Forecast, by Application 2019 & 2032
- Table 35: Rest of Europe 3D Printed Medical Devices Industry Revenue (Million) Forecast, by Application 2019 & 2032
- Table 36: Global 3D Printed Medical Devices Industry Revenue Million Forecast, by Offerings 2019 & 2032
- Table 37: Global 3D Printed Medical Devices Industry Revenue Million Forecast, by Type 2019 & 2032
- Table 38: Global 3D Printed Medical Devices Industry Revenue Million Forecast, by Materials 2019 & 2032
- Table 39: Global 3D Printed Medical Devices Industry Revenue Million Forecast, by Country 2019 & 2032
- Table 40: Japan 3D Printed Medical Devices Industry Revenue (Million) Forecast, by Application 2019 & 2032
- Table 41: China 3D Printed Medical Devices Industry Revenue (Million) Forecast, by Application 2019 & 2032
- Table 42: India 3D Printed Medical Devices Industry Revenue (Million) Forecast, by Application 2019 & 2032
- Table 43: Rest of Asia Pacific 3D Printed Medical Devices Industry Revenue (Million) Forecast, by Application 2019 & 2032
- Table 44: Global 3D Printed Medical Devices Industry Revenue Million Forecast, by Offerings 2019 & 2032
- Table 45: Global 3D Printed Medical Devices Industry Revenue Million Forecast, by Type 2019 & 2032
- Table 46: Global 3D Printed Medical Devices Industry Revenue Million Forecast, by Materials 2019 & 2032
- Table 47: Global 3D Printed Medical Devices Industry Revenue Million Forecast, by Country 2019 & 2032
- Table 48: Latin America 3D Printed Medical Devices Industry Revenue (Million) Forecast, by Application 2019 & 2032
- Table 49: Middle East 3D Printed Medical Devices Industry Revenue (Million) Forecast, by Application 2019 & 2032
Frequently Asked Questions
1. What is the projected Compound Annual Growth Rate (CAGR) of the 3D Printed Medical Devices Industry?
The projected CAGR is approximately 16.32%.
2. Which companies are prominent players in the 3D Printed Medical Devices Industry?
Key companies in the market include Organovo, Nano Dimension, Arcam AB ( GE Aviation), 3D Systems Corporation, SLM Solutions Group AG, Renishaw plc, Prodways Group ( Groupe Gorge ), Carbon Inc, Materialise NV, Concept Laser GmbH ( General Electric )*List Not Exhaustive, Stratasys Ltd, ExOne Company.
3. What are the main segments of the 3D Printed Medical Devices Industry?
The market segments include Offerings, Type, Materials.
4. Can you provide details about the market size?
The market size is estimated to be USD 3.98 Million as of 2022.
5. What are some drivers contributing to market growth?
; Easy Development of Customized Medical Products Using 3D Printing; Growing Demand for Organ Transplant.
6. What are the notable trends driving market growth?
Orthopedics and Prosthetics is Expected to Have the Fastest Growth.
7. Are there any restraints impacting market growth?
; Stringent Regulatory Process for the Approval of 3D-Printed Medical Devices.
8. Can you provide examples of recent developments in the market?
N/A
9. What pricing options are available for accessing the report?
Pricing options include single-user, multi-user, and enterprise licenses priced at USD 4750, USD 5250, and USD 8750 respectively.
10. Is the market size provided in terms of value or volume?
The market size is provided in terms of value, measured in Million.
11. Are there any specific market keywords associated with the report?
Yes, the market keyword associated with the report is "3D Printed Medical Devices Industry," which aids in identifying and referencing the specific market segment covered.
12. How do I determine which pricing option suits my needs best?
The pricing options vary based on user requirements and access needs. Individual users may opt for single-user licenses, while businesses requiring broader access may choose multi-user or enterprise licenses for cost-effective access to the report.
13. Are there any additional resources or data provided in the 3D Printed Medical Devices Industry report?
While the report offers comprehensive insights, it's advisable to review the specific contents or supplementary materials provided to ascertain if additional resources or data are available.
14. How can I stay updated on further developments or reports in the 3D Printed Medical Devices Industry?
To stay informed about further developments, trends, and reports in the 3D Printed Medical Devices Industry, consider subscribing to industry newsletters, following relevant companies and organizations, or regularly checking reputable industry news sources and publications.
Methodology
Step 1 - Identification of Relevant Samples Size from Population Database


Step 2 - Approaches for Defining Global Market Size (Value, Volume* & Price*)

Note*: In applicable scenarios
Step 3 - Data Sources
Primary Research
- Web Analytics
- Survey Reports
- Research Institute
- Latest Research Reports
- Opinion Leaders
Secondary Research
- Annual Reports
- White Paper
- Latest Press Release
- Industry Association
- Paid Database
- Investor Presentations

Step 4 - Data Triangulation
Involves using different sources of information in order to increase the validity of a study
These sources are likely to be stakeholders in a program - participants, other researchers, program staff, other community members, and so on.
Then we put all data in single framework & apply various statistical tools to find out the dynamic on the market.
During the analysis stage, feedback from the stakeholder groups would be compared to determine areas of agreement as well as areas of divergence
