

Key Insights
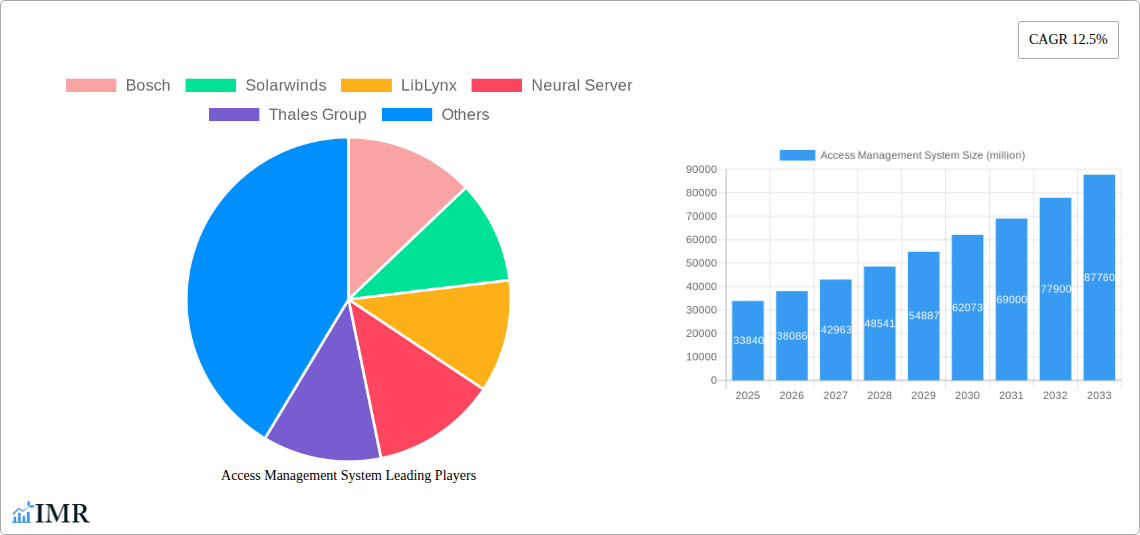
The Access Management System (AMS) market is experiencing robust growth, projected to reach a market size of $33.84 billion in 2025, expanding at a Compound Annual Growth Rate (CAGR) of 12.5% from 2019 to 2033. This significant expansion is driven by several key factors. The increasing adoption of cloud computing and remote work models necessitates more sophisticated and secure access control solutions. The rising frequency and sophistication of cyberattacks are also fueling demand for robust AMS solutions capable of mitigating risks associated with unauthorized access and data breaches. Furthermore, the growing emphasis on regulatory compliance, such as GDPR and CCPA, compels organizations to implement stringent access management policies, boosting market growth. The market is segmented by deployment type (cloud, on-premises), organization size (SMEs, large enterprises), and industry vertical (BFSI, healthcare, IT, etc.). Major players such as Bosch, SolarWinds, CyberArk, and Microsoft are driving innovation through advanced technologies like multi-factor authentication, biometrics, and AI-powered threat detection, enhancing the security and efficiency of access management.
The forecast period (2025-2033) is expected to witness continued growth, driven by the increasing adoption of Zero Trust security architectures and the expanding integration of AMS solutions with other security technologies like Identity and Access Management (IAM). While challenges remain, such as the complexity of managing access across diverse systems and the need for skilled professionals to implement and maintain AMS solutions, the overall market outlook remains positive. The competitive landscape is dynamic, with established players and emerging startups vying for market share through product innovation, strategic partnerships, and acquisitions. This competitive environment benefits end-users by driving down costs and improving the overall quality and functionality of available solutions. The long-term growth trajectory of the AMS market remains firmly upward, reflecting the ongoing need for robust and secure access control in an increasingly digital world.
Access Management System Market Report: 2019-2033
This comprehensive report provides an in-depth analysis of the Access Management System market, encompassing market dynamics, growth trends, regional analysis, product landscape, key players, and future outlook. The study covers the period from 2019 to 2033, with a base year of 2025 and a forecast period of 2025-2033. The total market size in 2025 is estimated at $XX billion, experiencing a CAGR of XX% during the forecast period. This report is crucial for industry professionals, investors, and strategists seeking to understand and capitalize on the opportunities within this rapidly evolving sector. The parent market is IT security, while the child market is Identity and Access Management (IAM).
Access Management System Market Dynamics & Structure
The Access Management System market is characterized by moderate concentration, with a few major players holding significant market share. The market is driven by technological innovation, particularly in areas like cloud-based solutions, AI-powered authentication, and zero-trust architectures. Stringent regulatory frameworks, such as GDPR and CCPA, are further driving adoption. Competitive substitutes include basic password systems and traditional security measures, but the increasing sophistication of cyber threats fuels demand for robust access management solutions. The end-user demographic spans various industries, including BFSI, healthcare, government, and retail. M&A activity has been relatively high in the last five years, with approximately XX deals valued at $XX billion.
- Market Concentration: Moderately concentrated, with top 5 players holding approximately XX% market share in 2025.
- Technological Drivers: Cloud computing, AI/ML in authentication, zero-trust security, biometric technologies.
- Regulatory Landscape: GDPR, CCPA, and other regional data privacy regulations.
- Competitive Substitutes: Basic password systems, traditional security infrastructure.
- M&A Activity: Approximately XX deals valued at $XX billion from 2020-2024.
- Innovation Barriers: High initial investment costs, integration complexity, lack of skilled workforce.
Access Management System Growth Trends & Insights
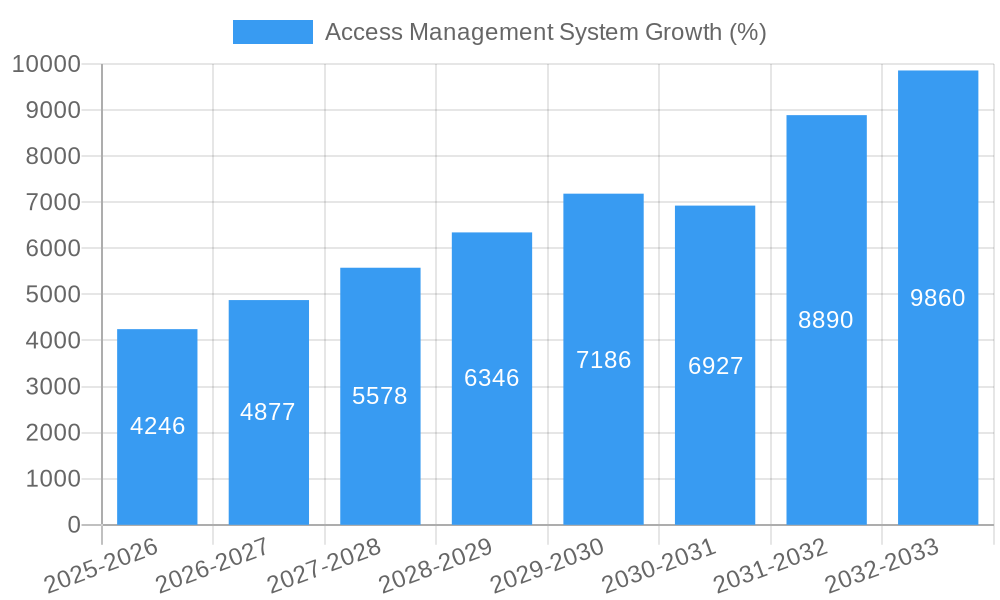
The Access Management System market witnessed significant growth during the historical period (2019-2024), driven by increasing cyber threats and the rising adoption of cloud-based services. Market size grew from $XX billion in 2019 to an estimated $XX billion in 2024. This growth is expected to continue throughout the forecast period (2025-2033), propelled by factors such as the increasing adoption of remote work models, the expanding IoT landscape, and heightened security concerns across various industries. The market is expected to reach $XX billion by 2033, reflecting a CAGR of XX%. Market penetration in key sectors like BFSI and healthcare is projected to increase significantly. Technological disruptions, such as the shift towards passwordless authentication and the integration of behavioral biometrics, will further fuel growth.
Dominant Regions, Countries, or Segments in Access Management System
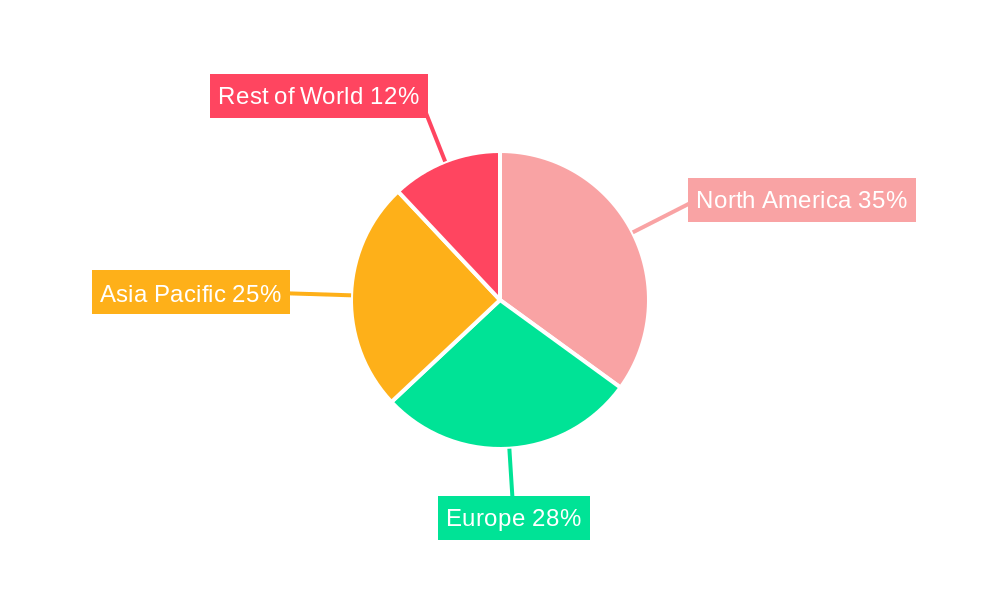
North America currently holds the largest market share, driven by robust technological infrastructure, stringent data privacy regulations, and high adoption rates among enterprises. However, Asia-Pacific is expected to exhibit the fastest growth rate during the forecast period, fueled by rapid digital transformation, rising internet penetration, and increasing government investments in cybersecurity infrastructure. The BFSI segment constitutes the largest share of the market, driven by high security requirements for financial transactions.
- North America: High adoption, stringent regulations, robust technological infrastructure.
- Europe: Strong regulatory push, rising cybersecurity awareness.
- Asia-Pacific: Fastest-growing region, driven by digitalization and rising internet penetration.
- BFSI Segment: Largest market share, driven by stringent regulatory compliance needs.
- Healthcare Segment: Significant growth potential, driven by the need to protect sensitive patient data.
Access Management System Product Landscape
The Access Management System market offers a diverse range of products, including on-premise, cloud-based, and hybrid solutions. Recent innovations focus on passwordless authentication, multi-factor authentication (MFA), and risk-based authentication. Key performance indicators include authentication speed, security strength, user experience, and integration capabilities. Unique selling propositions often revolve around ease of use, strong security, seamless integration with existing systems, and scalability. Technological advancements are constantly improving the efficiency and security of these solutions.
Key Drivers, Barriers & Challenges in Access Management System
Key Drivers: Increasing cyber threats, growing adoption of cloud computing, stringent data privacy regulations, expanding IoT ecosystem.
Key Challenges: High implementation costs, integration complexities with legacy systems, shortage of skilled cybersecurity professionals, resistance to change among end-users, and evolving threat landscape requiring continuous updates. The impact of these challenges is estimated to cause a reduction in market growth by approximately XX% annually.
Emerging Opportunities in Access Management System
The growing adoption of mobile devices, the rise of the Internet of Things (IoT), and the increasing use of AI and machine learning in authentication are creating significant opportunities in the Access Management System market. Untapped markets include smaller businesses and organizations with limited IT resources, requiring user-friendly and cost-effective solutions. The development of innovative applications like behavioral biometrics and passwordless authentication will further shape the market landscape.
Growth Accelerators in the Access Management System Industry
Strategic partnerships between technology vendors and security service providers, coupled with aggressive market expansion strategies targeting emerging economies, are key growth accelerators. Continuous technological innovation, including enhanced security algorithms and improved user interfaces, will drive adoption. Furthermore, increasing government investments in cybersecurity infrastructure and a heightened awareness of data security among individuals and businesses are poised to accelerate market growth.
Key Players Shaping the Access Management System Market
- Bosch
- SolarWinds
- LibLynx
- Neural Server
- Thales Group
- CyberArk
- Amazon Web Services
- Akamai Technologies
- HP Development Company
- Microsoft Corporation
- Oracle Corporation
- ForgeRock
- Avatier
- Symantec
- Beta Systems
- CATechnologies
- Centrify
- Core Security
- Crossmatch
- Fischer Identity
Notable Milestones in Access Management System Sector
- 2020: Increased adoption of MFA due to the rise in remote work.
- 2021: Significant investments in passwordless authentication technologies.
- 2022: Launch of several cloud-based access management platforms.
- 2023: Growing integration of AI and ML in risk-based authentication.
- 2024: Several mergers and acquisitions within the IAM sector.
In-Depth Access Management System Market Outlook
The Access Management System market is poised for robust growth in the coming years, driven by continuous innovation, increasing security concerns, and evolving regulatory landscapes. Strategic opportunities lie in developing innovative solutions tailored to specific industry needs, leveraging emerging technologies like AI and blockchain, and expanding into untapped markets. The long-term potential is significant, with projections indicating a substantial market expansion over the next decade. The focus will shift towards seamless user experience, advanced security features, and proactive threat management.
Access Management System Segmentation
-
1. Application
- 1.1. Government Agency
- 1.2. Enterprise
- 1.3. Educational Institution
- 1.4. Others
-
2. Type
- 2.1. Cloud Based
- 2.2. On-premises
Access Management System Segmentation By Geography
-
1. North America
- 1.1. United States
- 1.2. Canada
- 1.3. Mexico
-
2. South America
- 2.1. Brazil
- 2.2. Argentina
- 2.3. Rest of South America
-
3. Europe
- 3.1. United Kingdom
- 3.2. Germany
- 3.3. France
- 3.4. Italy
- 3.5. Spain
- 3.6. Russia
- 3.7. Benelux
- 3.8. Nordics
- 3.9. Rest of Europe
-
4. Middle East & Africa
- 4.1. Turkey
- 4.2. Israel
- 4.3. GCC
- 4.4. North Africa
- 4.5. South Africa
- 4.6. Rest of Middle East & Africa
-
5. Asia Pacific
- 5.1. China
- 5.2. India
- 5.3. Japan
- 5.4. South Korea
- 5.5. ASEAN
- 5.6. Oceania
- 5.7. Rest of Asia Pacific
Access Management System REPORT HIGHLIGHTS
| Aspects | Details |
|---|---|
| Study Period | 2019-2033 |
| Base Year | 2024 |
| Estimated Year | 2025 |
| Forecast Period | 2025-2033 |
| Historical Period | 2019-2024 |
| Growth Rate | CAGR of 12.5% from 2019-2033 |
| Segmentation |
|
Table of Contents
- 1. Introduction
- 1.1. Research Scope
- 1.2. Market Segmentation
- 1.3. Research Methodology
- 1.4. Definitions and Assumptions
- 2. Executive Summary
- 2.1. Introduction
- 3. Market Dynamics
- 3.1. Introduction
- 3.2. Market Drivers
- 3.3. Market Restrains
- 3.4. Market Trends
- 4. Market Factor Analysis
- 4.1. Porters Five Forces
- 4.2. Supply/Value Chain
- 4.3. PESTEL analysis
- 4.4. Market Entropy
- 4.5. Patent/Trademark Analysis
- 5. Global Access Management System Analysis, Insights and Forecast, 2019-2031
- 5.1. Market Analysis, Insights and Forecast - by Application
- 5.1.1. Government Agency
- 5.1.2. Enterprise
- 5.1.3. Educational Institution
- 5.1.4. Others
- 5.2. Market Analysis, Insights and Forecast - by Type
- 5.2.1. Cloud Based
- 5.2.2. On-premises
- 5.3. Market Analysis, Insights and Forecast - by Region
- 5.3.1. North America
- 5.3.2. South America
- 5.3.3. Europe
- 5.3.4. Middle East & Africa
- 5.3.5. Asia Pacific
- 5.1. Market Analysis, Insights and Forecast - by Application
- 6. North America Access Management System Analysis, Insights and Forecast, 2019-2031
- 6.1. Market Analysis, Insights and Forecast - by Application
- 6.1.1. Government Agency
- 6.1.2. Enterprise
- 6.1.3. Educational Institution
- 6.1.4. Others
- 6.2. Market Analysis, Insights and Forecast - by Type
- 6.2.1. Cloud Based
- 6.2.2. On-premises
- 6.1. Market Analysis, Insights and Forecast - by Application
- 7. South America Access Management System Analysis, Insights and Forecast, 2019-2031
- 7.1. Market Analysis, Insights and Forecast - by Application
- 7.1.1. Government Agency
- 7.1.2. Enterprise
- 7.1.3. Educational Institution
- 7.1.4. Others
- 7.2. Market Analysis, Insights and Forecast - by Type
- 7.2.1. Cloud Based
- 7.2.2. On-premises
- 7.1. Market Analysis, Insights and Forecast - by Application
- 8. Europe Access Management System Analysis, Insights and Forecast, 2019-2031
- 8.1. Market Analysis, Insights and Forecast - by Application
- 8.1.1. Government Agency
- 8.1.2. Enterprise
- 8.1.3. Educational Institution
- 8.1.4. Others
- 8.2. Market Analysis, Insights and Forecast - by Type
- 8.2.1. Cloud Based
- 8.2.2. On-premises
- 8.1. Market Analysis, Insights and Forecast - by Application
- 9. Middle East & Africa Access Management System Analysis, Insights and Forecast, 2019-2031
- 9.1. Market Analysis, Insights and Forecast - by Application
- 9.1.1. Government Agency
- 9.1.2. Enterprise
- 9.1.3. Educational Institution
- 9.1.4. Others
- 9.2. Market Analysis, Insights and Forecast - by Type
- 9.2.1. Cloud Based
- 9.2.2. On-premises
- 9.1. Market Analysis, Insights and Forecast - by Application
- 10. Asia Pacific Access Management System Analysis, Insights and Forecast, 2019-2031
- 10.1. Market Analysis, Insights and Forecast - by Application
- 10.1.1. Government Agency
- 10.1.2. Enterprise
- 10.1.3. Educational Institution
- 10.1.4. Others
- 10.2. Market Analysis, Insights and Forecast - by Type
- 10.2.1. Cloud Based
- 10.2.2. On-premises
- 10.1. Market Analysis, Insights and Forecast - by Application
- 11. Competitive Analysis
- 11.1. Global Market Share Analysis 2024
- 11.2. Company Profiles
- 11.2.1 Bosch
- 11.2.1.1. Overview
- 11.2.1.2. Products
- 11.2.1.3. SWOT Analysis
- 11.2.1.4. Recent Developments
- 11.2.1.5. Financials (Based on Availability)
- 11.2.2 Solarwinds
- 11.2.2.1. Overview
- 11.2.2.2. Products
- 11.2.2.3. SWOT Analysis
- 11.2.2.4. Recent Developments
- 11.2.2.5. Financials (Based on Availability)
- 11.2.3 LibLynx
- 11.2.3.1. Overview
- 11.2.3.2. Products
- 11.2.3.3. SWOT Analysis
- 11.2.3.4. Recent Developments
- 11.2.3.5. Financials (Based on Availability)
- 11.2.4 Neural Server
- 11.2.4.1. Overview
- 11.2.4.2. Products
- 11.2.4.3. SWOT Analysis
- 11.2.4.4. Recent Developments
- 11.2.4.5. Financials (Based on Availability)
- 11.2.5 Thales Group
- 11.2.5.1. Overview
- 11.2.5.2. Products
- 11.2.5.3. SWOT Analysis
- 11.2.5.4. Recent Developments
- 11.2.5.5. Financials (Based on Availability)
- 11.2.6 Cyberark
- 11.2.6.1. Overview
- 11.2.6.2. Products
- 11.2.6.3. SWOT Analysis
- 11.2.6.4. Recent Developments
- 11.2.6.5. Financials (Based on Availability)
- 11.2.7 Amazon Web Services
- 11.2.7.1. Overview
- 11.2.7.2. Products
- 11.2.7.3. SWOT Analysis
- 11.2.7.4. Recent Developments
- 11.2.7.5. Financials (Based on Availability)
- 11.2.8 Akamai Technologies
- 11.2.8.1. Overview
- 11.2.8.2. Products
- 11.2.8.3. SWOT Analysis
- 11.2.8.4. Recent Developments
- 11.2.8.5. Financials (Based on Availability)
- 11.2.9 HP Development Company
- 11.2.9.1. Overview
- 11.2.9.2. Products
- 11.2.9.3. SWOT Analysis
- 11.2.9.4. Recent Developments
- 11.2.9.5. Financials (Based on Availability)
- 11.2.10 Microsoft Corporation
- 11.2.10.1. Overview
- 11.2.10.2. Products
- 11.2.10.3. SWOT Analysis
- 11.2.10.4. Recent Developments
- 11.2.10.5. Financials (Based on Availability)
- 11.2.11 Oracle Corporation
- 11.2.11.1. Overview
- 11.2.11.2. Products
- 11.2.11.3. SWOT Analysis
- 11.2.11.4. Recent Developments
- 11.2.11.5. Financials (Based on Availability)
- 11.2.12 ForgeRock
- 11.2.12.1. Overview
- 11.2.12.2. Products
- 11.2.12.3. SWOT Analysis
- 11.2.12.4. Recent Developments
- 11.2.12.5. Financials (Based on Availability)
- 11.2.13 Avatier
- 11.2.13.1. Overview
- 11.2.13.2. Products
- 11.2.13.3. SWOT Analysis
- 11.2.13.4. Recent Developments
- 11.2.13.5. Financials (Based on Availability)
- 11.2.14 Symantec
- 11.2.14.1. Overview
- 11.2.14.2. Products
- 11.2.14.3. SWOT Analysis
- 11.2.14.4. Recent Developments
- 11.2.14.5. Financials (Based on Availability)
- 11.2.15 Beta Systems
- 11.2.15.1. Overview
- 11.2.15.2. Products
- 11.2.15.3. SWOT Analysis
- 11.2.15.4. Recent Developments
- 11.2.15.5. Financials (Based on Availability)
- 11.2.16 CATechnologies
- 11.2.16.1. Overview
- 11.2.16.2. Products
- 11.2.16.3. SWOT Analysis
- 11.2.16.4. Recent Developments
- 11.2.16.5. Financials (Based on Availability)
- 11.2.17 Centrify
- 11.2.17.1. Overview
- 11.2.17.2. Products
- 11.2.17.3. SWOT Analysis
- 11.2.17.4. Recent Developments
- 11.2.17.5. Financials (Based on Availability)
- 11.2.18 Core Security
- 11.2.18.1. Overview
- 11.2.18.2. Products
- 11.2.18.3. SWOT Analysis
- 11.2.18.4. Recent Developments
- 11.2.18.5. Financials (Based on Availability)
- 11.2.19 Crossmatch
- 11.2.19.1. Overview
- 11.2.19.2. Products
- 11.2.19.3. SWOT Analysis
- 11.2.19.4. Recent Developments
- 11.2.19.5. Financials (Based on Availability)
- 11.2.20 Fischer ldentity
- 11.2.20.1. Overview
- 11.2.20.2. Products
- 11.2.20.3. SWOT Analysis
- 11.2.20.4. Recent Developments
- 11.2.20.5. Financials (Based on Availability)
- 11.2.1 Bosch
List of Figures
- Figure 1: Global Access Management System Revenue Breakdown (million, %) by Region 2024 & 2032
- Figure 2: North America Access Management System Revenue (million), by Application 2024 & 2032
- Figure 3: North America Access Management System Revenue Share (%), by Application 2024 & 2032
- Figure 4: North America Access Management System Revenue (million), by Type 2024 & 2032
- Figure 5: North America Access Management System Revenue Share (%), by Type 2024 & 2032
- Figure 6: North America Access Management System Revenue (million), by Country 2024 & 2032
- Figure 7: North America Access Management System Revenue Share (%), by Country 2024 & 2032
- Figure 8: South America Access Management System Revenue (million), by Application 2024 & 2032
- Figure 9: South America Access Management System Revenue Share (%), by Application 2024 & 2032
- Figure 10: South America Access Management System Revenue (million), by Type 2024 & 2032
- Figure 11: South America Access Management System Revenue Share (%), by Type 2024 & 2032
- Figure 12: South America Access Management System Revenue (million), by Country 2024 & 2032
- Figure 13: South America Access Management System Revenue Share (%), by Country 2024 & 2032
- Figure 14: Europe Access Management System Revenue (million), by Application 2024 & 2032
- Figure 15: Europe Access Management System Revenue Share (%), by Application 2024 & 2032
- Figure 16: Europe Access Management System Revenue (million), by Type 2024 & 2032
- Figure 17: Europe Access Management System Revenue Share (%), by Type 2024 & 2032
- Figure 18: Europe Access Management System Revenue (million), by Country 2024 & 2032
- Figure 19: Europe Access Management System Revenue Share (%), by Country 2024 & 2032
- Figure 20: Middle East & Africa Access Management System Revenue (million), by Application 2024 & 2032
- Figure 21: Middle East & Africa Access Management System Revenue Share (%), by Application 2024 & 2032
- Figure 22: Middle East & Africa Access Management System Revenue (million), by Type 2024 & 2032
- Figure 23: Middle East & Africa Access Management System Revenue Share (%), by Type 2024 & 2032
- Figure 24: Middle East & Africa Access Management System Revenue (million), by Country 2024 & 2032
- Figure 25: Middle East & Africa Access Management System Revenue Share (%), by Country 2024 & 2032
- Figure 26: Asia Pacific Access Management System Revenue (million), by Application 2024 & 2032
- Figure 27: Asia Pacific Access Management System Revenue Share (%), by Application 2024 & 2032
- Figure 28: Asia Pacific Access Management System Revenue (million), by Type 2024 & 2032
- Figure 29: Asia Pacific Access Management System Revenue Share (%), by Type 2024 & 2032
- Figure 30: Asia Pacific Access Management System Revenue (million), by Country 2024 & 2032
- Figure 31: Asia Pacific Access Management System Revenue Share (%), by Country 2024 & 2032
List of Tables
- Table 1: Global Access Management System Revenue million Forecast, by Region 2019 & 2032
- Table 2: Global Access Management System Revenue million Forecast, by Application 2019 & 2032
- Table 3: Global Access Management System Revenue million Forecast, by Type 2019 & 2032
- Table 4: Global Access Management System Revenue million Forecast, by Region 2019 & 2032
- Table 5: Global Access Management System Revenue million Forecast, by Application 2019 & 2032
- Table 6: Global Access Management System Revenue million Forecast, by Type 2019 & 2032
- Table 7: Global Access Management System Revenue million Forecast, by Country 2019 & 2032
- Table 8: United States Access Management System Revenue (million) Forecast, by Application 2019 & 2032
- Table 9: Canada Access Management System Revenue (million) Forecast, by Application 2019 & 2032
- Table 10: Mexico Access Management System Revenue (million) Forecast, by Application 2019 & 2032
- Table 11: Global Access Management System Revenue million Forecast, by Application 2019 & 2032
- Table 12: Global Access Management System Revenue million Forecast, by Type 2019 & 2032
- Table 13: Global Access Management System Revenue million Forecast, by Country 2019 & 2032
- Table 14: Brazil Access Management System Revenue (million) Forecast, by Application 2019 & 2032
- Table 15: Argentina Access Management System Revenue (million) Forecast, by Application 2019 & 2032
- Table 16: Rest of South America Access Management System Revenue (million) Forecast, by Application 2019 & 2032
- Table 17: Global Access Management System Revenue million Forecast, by Application 2019 & 2032
- Table 18: Global Access Management System Revenue million Forecast, by Type 2019 & 2032
- Table 19: Global Access Management System Revenue million Forecast, by Country 2019 & 2032
- Table 20: United Kingdom Access Management System Revenue (million) Forecast, by Application 2019 & 2032
- Table 21: Germany Access Management System Revenue (million) Forecast, by Application 2019 & 2032
- Table 22: France Access Management System Revenue (million) Forecast, by Application 2019 & 2032
- Table 23: Italy Access Management System Revenue (million) Forecast, by Application 2019 & 2032
- Table 24: Spain Access Management System Revenue (million) Forecast, by Application 2019 & 2032
- Table 25: Russia Access Management System Revenue (million) Forecast, by Application 2019 & 2032
- Table 26: Benelux Access Management System Revenue (million) Forecast, by Application 2019 & 2032
- Table 27: Nordics Access Management System Revenue (million) Forecast, by Application 2019 & 2032
- Table 28: Rest of Europe Access Management System Revenue (million) Forecast, by Application 2019 & 2032
- Table 29: Global Access Management System Revenue million Forecast, by Application 2019 & 2032
- Table 30: Global Access Management System Revenue million Forecast, by Type 2019 & 2032
- Table 31: Global Access Management System Revenue million Forecast, by Country 2019 & 2032
- Table 32: Turkey Access Management System Revenue (million) Forecast, by Application 2019 & 2032
- Table 33: Israel Access Management System Revenue (million) Forecast, by Application 2019 & 2032
- Table 34: GCC Access Management System Revenue (million) Forecast, by Application 2019 & 2032
- Table 35: North Africa Access Management System Revenue (million) Forecast, by Application 2019 & 2032
- Table 36: South Africa Access Management System Revenue (million) Forecast, by Application 2019 & 2032
- Table 37: Rest of Middle East & Africa Access Management System Revenue (million) Forecast, by Application 2019 & 2032
- Table 38: Global Access Management System Revenue million Forecast, by Application 2019 & 2032
- Table 39: Global Access Management System Revenue million Forecast, by Type 2019 & 2032
- Table 40: Global Access Management System Revenue million Forecast, by Country 2019 & 2032
- Table 41: China Access Management System Revenue (million) Forecast, by Application 2019 & 2032
- Table 42: India Access Management System Revenue (million) Forecast, by Application 2019 & 2032
- Table 43: Japan Access Management System Revenue (million) Forecast, by Application 2019 & 2032
- Table 44: South Korea Access Management System Revenue (million) Forecast, by Application 2019 & 2032
- Table 45: ASEAN Access Management System Revenue (million) Forecast, by Application 2019 & 2032
- Table 46: Oceania Access Management System Revenue (million) Forecast, by Application 2019 & 2032
- Table 47: Rest of Asia Pacific Access Management System Revenue (million) Forecast, by Application 2019 & 2032
Frequently Asked Questions
1. What is the projected Compound Annual Growth Rate (CAGR) of the Access Management System?
The projected CAGR is approximately 12.5%.
2. Which companies are prominent players in the Access Management System?
Key companies in the market include Bosch, Solarwinds, LibLynx, Neural Server, Thales Group, Cyberark, Amazon Web Services, Akamai Technologies, HP Development Company, Microsoft Corporation, Oracle Corporation, ForgeRock, Avatier, Symantec, Beta Systems, CATechnologies, Centrify, Core Security, Crossmatch, Fischer ldentity.
3. What are the main segments of the Access Management System?
The market segments include Application, Type.
4. Can you provide details about the market size?
The market size is estimated to be USD 33840 million as of 2022.
5. What are some drivers contributing to market growth?
N/A
6. What are the notable trends driving market growth?
N/A
7. Are there any restraints impacting market growth?
N/A
8. Can you provide examples of recent developments in the market?
N/A
9. What pricing options are available for accessing the report?
Pricing options include single-user, multi-user, and enterprise licenses priced at USD 3950.00, USD 5925.00, and USD 7900.00 respectively.
10. Is the market size provided in terms of value or volume?
The market size is provided in terms of value, measured in million.
11. Are there any specific market keywords associated with the report?
Yes, the market keyword associated with the report is "Access Management System," which aids in identifying and referencing the specific market segment covered.
12. How do I determine which pricing option suits my needs best?
The pricing options vary based on user requirements and access needs. Individual users may opt for single-user licenses, while businesses requiring broader access may choose multi-user or enterprise licenses for cost-effective access to the report.
13. Are there any additional resources or data provided in the Access Management System report?
While the report offers comprehensive insights, it's advisable to review the specific contents or supplementary materials provided to ascertain if additional resources or data are available.
14. How can I stay updated on further developments or reports in the Access Management System?
To stay informed about further developments, trends, and reports in the Access Management System, consider subscribing to industry newsletters, following relevant companies and organizations, or regularly checking reputable industry news sources and publications.
Methodology
Step 1 - Identification of Relevant Samples Size from Population Database


Step 2 - Approaches for Defining Global Market Size (Value, Volume* & Price*)

Note*: In applicable scenarios
Step 3 - Data Sources
Primary Research
- Web Analytics
- Survey Reports
- Research Institute
- Latest Research Reports
- Opinion Leaders
Secondary Research
- Annual Reports
- White Paper
- Latest Press Release
- Industry Association
- Paid Database
- Investor Presentations

Step 4 - Data Triangulation
Involves using different sources of information in order to increase the validity of a study
These sources are likely to be stakeholders in a program - participants, other researchers, program staff, other community members, and so on.
Then we put all data in single framework & apply various statistical tools to find out the dynamic on the market.
During the analysis stage, feedback from the stakeholder groups would be compared to determine areas of agreement as well as areas of divergence
