

Key Insights
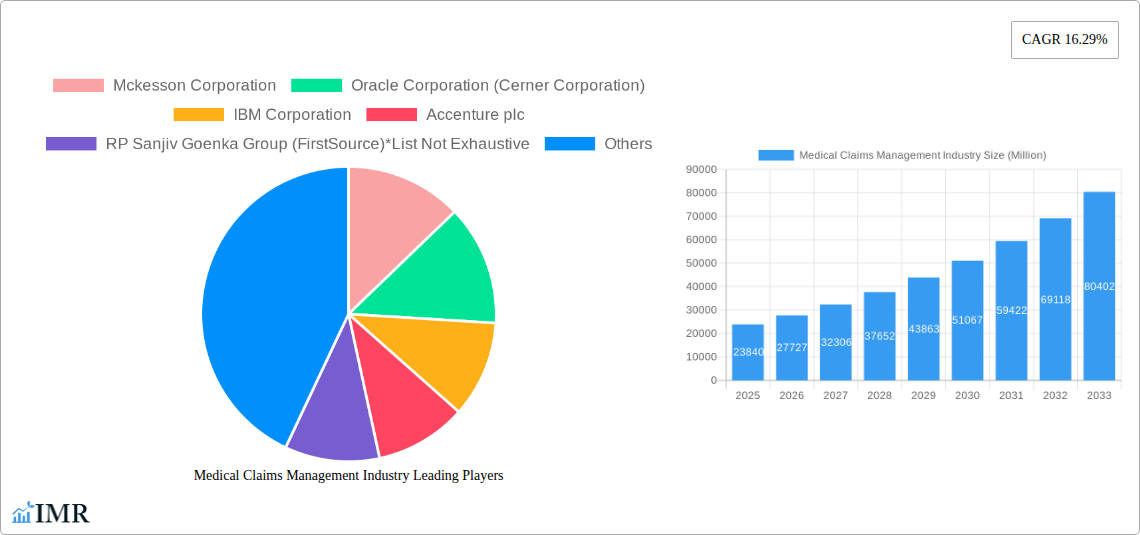
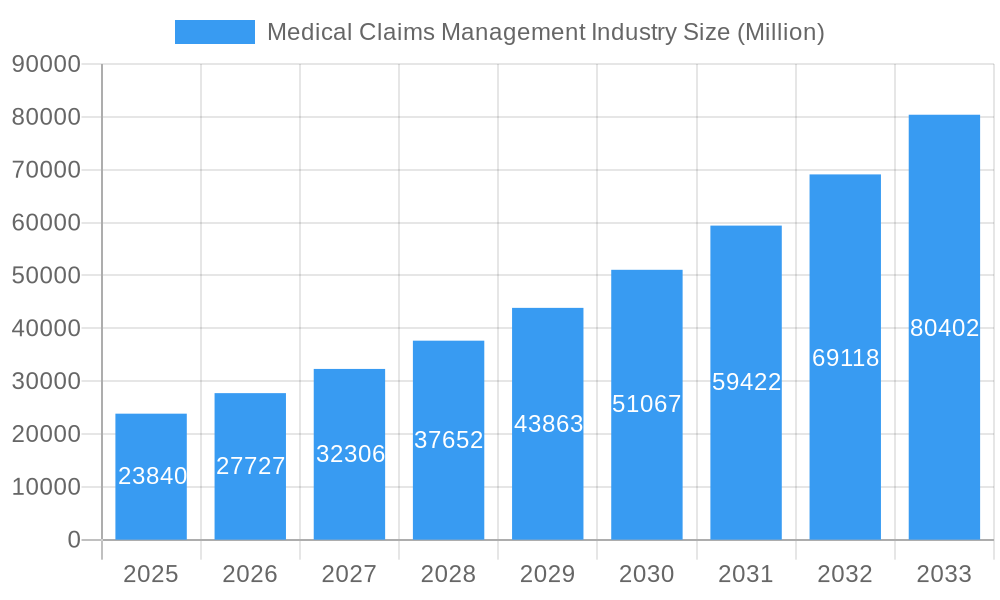
The Medical Claims Management market is experiencing robust growth, projected to reach $23.84 billion in 2025 and maintain a Compound Annual Growth Rate (CAGR) of 16.29% from 2025 to 2033. This expansion is fueled by several key drivers. The increasing volume of healthcare claims due to an aging population and rising chronic disease prevalence necessitates efficient and automated claims processing solutions. Furthermore, the industry's shift towards value-based care models requires sophisticated analytics and data management capabilities for accurate reimbursement and performance tracking. Stringent regulatory compliance mandates and the need to reduce administrative costs further stimulate market growth. Technological advancements, such as artificial intelligence (AI) and machine learning (ML) for fraud detection and automation, are transforming claims processing, enabling faster turnaround times and improved accuracy. The rising adoption of cloud-based solutions offers scalability and cost-effectiveness, attracting both healthcare providers and payers. While data security concerns and the complexity of integrating legacy systems present some challenges, the overall market outlook remains highly positive.
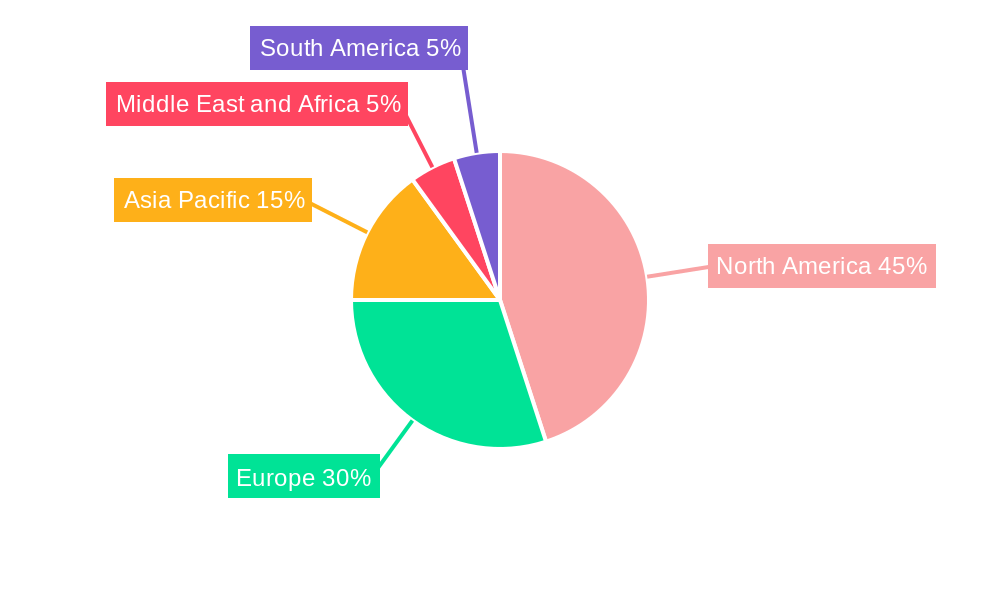
Medical Claims Management Industry Market Size (In Billion)
The market segmentation reveals a diverse landscape. Integrated solutions are gaining traction over standalone solutions due to their comprehensive functionalities. Software solutions are dominant, reflecting the industry's increasing reliance on technology. Cloud-based delivery models are rapidly gaining market share over on-premise solutions, driven by their flexibility and accessibility. Healthcare payers represent a significant portion of the end-user market, followed by healthcare providers. Key players like McKesson, Oracle (Cerner), IBM, Accenture, and Optum are shaping the competitive landscape through continuous innovation and strategic acquisitions. Regional variations exist, with North America currently holding a leading market share due to advanced healthcare infrastructure and high technology adoption rates. However, Asia-Pacific is poised for significant growth, driven by increasing healthcare spending and expanding digital health initiatives. The continued adoption of advanced technologies and expanding regulatory frameworks will shape the future of this dynamic industry.
Medical Claims Management Industry Company Market Share
Medical Claims Management Industry Market Report: 2019-2033
This comprehensive report provides a detailed analysis of the Medical Claims Management Industry, encompassing market dynamics, growth trends, regional analysis, competitive landscape, and future outlook. The study period covers 2019-2033, with a base year of 2025 and a forecast period of 2025-2033. The report segments the market by solution type (Integrated Solutions, Standalone Solutions), component (Services, Software), delivery mode (On-Premise, Cloud-Based), and end-user (Healthcare Payers, Healthcare Providers, Other End Users). Key players analyzed include McKesson Corporation, Oracle Corporation (Cerner Corporation), IBM Corporation, Accenture plc, RP Sanjiv Goenka Group (FirstSource), Optum Inc, Conduent Inc (Health Solutions Plus), Allscripts Healthcare Solutions Inc, OSP Labs, Genpact Limited, and Athenahealth Inc. The total market size in 2025 is estimated at XXX Million.
Medical Claims Management Industry Market Dynamics & Structure
The Medical Claims Management industry is characterized by moderate concentration, with a few large players holding significant market share. Technological advancements, particularly in AI and automation, are driving significant innovation, while stringent regulatory frameworks (HIPAA, GDPR) shape industry practices. The market witnesses consistent M&A activity, as larger players consolidate their position and smaller companies seek strategic acquisitions. Competitive substitutes include in-house claim processing systems, but these often lack the scalability and advanced features offered by dedicated solutions.
- Market Concentration: Top 5 players hold approximately xx% market share in 2025.
- Technological Innovation: AI-driven automation, blockchain for security, and cloud-based solutions are key drivers.
- Regulatory Landscape: HIPAA compliance, data privacy regulations, and interoperability standards are significant factors.
- M&A Activity: An average of xx M&A deals per year were observed during the historical period (2019-2024).
- End-User Demographics: Growth is fueled by increasing healthcare spending and the rising adoption of electronic health records (EHRs).
- Innovation Barriers: High initial investment costs, integration complexities, and data security concerns hinder innovation.
Medical Claims Management Industry Growth Trends & Insights
The Medical Claims Management market is experiencing robust growth, driven by the increasing volume of healthcare claims, rising demand for efficient claim processing, and the adoption of advanced technologies. The market size exhibited a CAGR of xx% during the historical period (2019-2024) and is projected to reach XXX Million by 2033, with a CAGR of xx% during the forecast period (2025-2033). This growth is fueled by increasing adoption of cloud-based solutions, improved automation, and a shift towards value-based care models. Market penetration of cloud-based solutions is estimated at xx% in 2025 and is expected to reach xx% by 2033. Consumer behavior shifts include a growing preference for digital and self-service options, further accelerating the market's evolution.
Dominant Regions, Countries, or Segments in Medical Claims Management Industry
North America currently dominates the Medical Claims Management market, followed by Europe. Within the segment breakdown, the Cloud-Based delivery mode is experiencing the fastest growth, driven by its scalability and cost-effectiveness. The Integrated Solutions segment holds the largest market share due to its comprehensive capabilities, while the Healthcare Payers segment represents the largest end-user group. Growth in Asia-Pacific is fueled by increasing healthcare infrastructure investments and rising healthcare expenditure.
- Key Drivers: Favorable regulatory environments, robust healthcare IT infrastructure (North America), government initiatives (Asia-Pacific), high adoption rates of EHRs.
- North America: High market share due to established healthcare systems and advanced technology adoption.
- Europe: Strong growth driven by increasing digitization efforts and government regulations.
- Asia-Pacific: Rapid growth fueled by increasing healthcare investments and rising healthcare expenditure.
- Cloud-Based Delivery: Fastest-growing segment due to cost efficiency, scalability, and improved accessibility.
- Integrated Solutions: Largest market share due to comprehensive functionalities and streamlined workflows.
- Healthcare Payers: Largest end-user segment due to their need for efficient claim processing and cost management.
Medical Claims Management Industry Product Landscape
The Medical Claims Management product landscape is characterized by innovative solutions that integrate AI, machine learning, and blockchain technologies to improve accuracy, efficiency, and security of claim processing. Products offer features such as automated claim adjudication, fraud detection, and real-time analytics, enhancing operational efficiency and reducing costs for healthcare providers and payers. Unique selling propositions often center around seamless integration with existing EHR systems, robust security protocols, and user-friendly interfaces. Advancements focus on improving interoperability, enhancing analytics capabilities, and addressing emerging regulatory requirements.
Key Drivers, Barriers & Challenges in Medical Claims Management Industry
Key Drivers:
- Rising healthcare expenditure and claims volume.
- Increasing adoption of EHRs and telehealth.
- Government initiatives promoting healthcare IT modernization.
- Growing demand for efficient and cost-effective claim processing.
Challenges:
- High implementation costs and integration complexities.
- Data security and privacy concerns.
- Stringent regulatory compliance requirements.
- Competition from established and emerging players. The competitive landscape is intensifying, with market share shifts projected at xx% by 2033.
Emerging Opportunities in Medical Claims Management Industry
- Expanding into untapped markets, such as developing countries.
- Leveraging AI and machine learning for advanced analytics and fraud detection.
- Developing specialized solutions for specific healthcare segments, such as behavioral health or long-term care.
- Integrating with emerging technologies, such as blockchain and IoT, for enhanced security and interoperability.
Growth Accelerators in the Medical Claims Management Industry
Technological breakthroughs, particularly in AI and automation, are driving significant growth. Strategic partnerships between technology providers and healthcare organizations are crucial, fostering innovation and widespread adoption. Expansion into emerging markets and the development of value-added services, like predictive analytics and risk management tools, will accelerate market growth.
Key Players Shaping the Medical Claims Management Industry Market
- McKesson Corporation
- Oracle Corporation (Cerner Corporation)
- IBM Corporation
- Accenture plc
- RP Sanjiv Goenka Group (FirstSource)
- Optum Inc
- Conduent Inc (Health Solutions Plus)
- Allscripts Healthcare Solutions Inc
- OSP Labs
- Genpact Limited
- Athenahealth Inc
Notable Milestones in Medical Claims Management Industry Sector
- 2020: Increased adoption of telehealth solutions due to COVID-19 pandemic.
- 2021: Several major M&A deals reshaped the competitive landscape.
- 2022: Launch of several AI-powered claim processing solutions.
- 2023: Increased focus on interoperability and data standardization.
In-Depth Medical Claims Management Industry Market Outlook
The Medical Claims Management market presents significant growth potential driven by technological advancements, increasing healthcare spending, and evolving regulatory landscapes. Strategic opportunities exist in developing innovative solutions, expanding into new markets, and forging strategic partnerships. The market's future success hinges on adapting to evolving consumer preferences, addressing data security concerns, and navigating a complex regulatory environment. The projected market size of XXX Million in 2033 represents a substantial opportunity for established players and new entrants alike.
Medical Claims Management Industry Segmentation
-
1. Solution Type
- 1.1. Integrated Solutions
- 1.2. Standalone Solutions
-
2. Component
- 2.1. Services
- 2.2. Software
-
3. Delivery Mode
- 3.1. On-Premise
- 3.2. Cloud-Based
-
4. End User
- 4.1. Healthcare Payers
- 4.2. Healthcare Providers
- 4.3. Other End Users
Medical Claims Management Industry Segmentation By Geography
-
1. North America
- 1.1. United States
- 1.2. Canada
- 1.3. Mexico
-
2. Europe
- 2.1. Germany
- 2.2. United Kingdom
- 2.3. France
- 2.4. Italy
- 2.5. Spain
- 2.6. Rest of Europe
-
3. Asia Pacific
- 3.1. China
- 3.2. Japan
- 3.3. India
- 3.4. Australia
- 3.5. South Korea
- 3.6. Rest of Asia Pacific
-
4. Middle East and Africa
- 4.1. GCC
- 4.2. South Africa
- 4.3. Rest of Middle East and Africa
-
5. South America
- 5.1. Brazil
- 5.2. Argentina
- 5.3. Rest of South America
Medical Claims Management Industry Regional Market Share
Geographic Coverage of Medical Claims Management Industry
Medical Claims Management Industry REPORT HIGHLIGHTS
| Aspects | Details |
|---|---|
| Study Period | 2020-2034 |
| Base Year | 2025 |
| Estimated Year | 2026 |
| Forecast Period | 2026-2034 |
| Historical Period | 2020-2025 |
| Growth Rate | CAGR of 16.29% from 2020-2034 |
| Segmentation |
|
Table of Contents
- 1. Introduction
- 1.1. Research Scope
- 1.2. Market Segmentation
- 1.3. Research Objective
- 1.4. Definitions and Assumptions
- 2. Executive Summary
- 2.1. Market Snapshot
- 3. Market Dynamics
- 3.1. Market Drivers
- 3.2. Market Restrains
- 3.3. Market Trends
- 3.4. Market Opportunities
- 4. Market Factor Analysis
- 4.1. Porters Five Forces
- 4.1.1. Bargaining Power of Suppliers
- 4.1.2. Bargaining Power of Buyers
- 4.1.3. Threat of New Entrants
- 4.1.4. Threat of Substitutes
- 4.1.5. Competitive Rivalry
- 4.2. PESTEL analysis
- 4.3. BCG Analysis
- 4.3.1. Stars (High Growth, High Market Share)
- 4.3.2. Cash Cows (Low Growth, High Market Share)
- 4.3.3. Question Mark (High Growth, Low Market Share)
- 4.3.4. Dogs (Low Growth, Low Market Share)
- 4.4. Ansoff Matrix Analysis
- 4.5. Supply Chain Analysis
- 4.6. Regulatory Landscape
- 4.7. Current Market Potential and Opportunity Assessment (TAM–SAM–SOM Framework)
- 4.8. IMR Analyst Note
- 4.1. Porters Five Forces
- 5. Market Analysis, Insights and Forecast 2021-2033
- 5.1. Market Analysis, Insights and Forecast - by Solution Type
- 5.1.1. Integrated Solutions
- 5.1.2. Standalone Solutions
- 5.2. Market Analysis, Insights and Forecast - by Component
- 5.2.1. Services
- 5.2.2. Software
- 5.3. Market Analysis, Insights and Forecast - by Delivery Mode
- 5.3.1. On-Premise
- 5.3.2. Cloud-Based
- 5.4. Market Analysis, Insights and Forecast - by End User
- 5.4.1. Healthcare Payers
- 5.4.2. Healthcare Providers
- 5.4.3. Other End Users
- 5.5. Market Analysis, Insights and Forecast - by Region
- 5.5.1. North America
- 5.5.2. Europe
- 5.5.3. Asia Pacific
- 5.5.4. Middle East and Africa
- 5.5.5. South America
- 5.1. Market Analysis, Insights and Forecast - by Solution Type
- 6. Global Medical Claims Management Industry Analysis, Insights and Forecast, 2021-2033
- 6.1. Market Analysis, Insights and Forecast - by Solution Type
- 6.1.1. Integrated Solutions
- 6.1.2. Standalone Solutions
- 6.2. Market Analysis, Insights and Forecast - by Component
- 6.2.1. Services
- 6.2.2. Software
- 6.3. Market Analysis, Insights and Forecast - by Delivery Mode
- 6.3.1. On-Premise
- 6.3.2. Cloud-Based
- 6.4. Market Analysis, Insights and Forecast - by End User
- 6.4.1. Healthcare Payers
- 6.4.2. Healthcare Providers
- 6.4.3. Other End Users
- 6.1. Market Analysis, Insights and Forecast - by Solution Type
- 7. North America Medical Claims Management Industry Analysis, Insights and Forecast, 2020-2032
- 7.1. Market Analysis, Insights and Forecast - by Solution Type
- 7.1.1. Integrated Solutions
- 7.1.2. Standalone Solutions
- 7.2. Market Analysis, Insights and Forecast - by Component
- 7.2.1. Services
- 7.2.2. Software
- 7.3. Market Analysis, Insights and Forecast - by Delivery Mode
- 7.3.1. On-Premise
- 7.3.2. Cloud-Based
- 7.4. Market Analysis, Insights and Forecast - by End User
- 7.4.1. Healthcare Payers
- 7.4.2. Healthcare Providers
- 7.4.3. Other End Users
- 7.1. Market Analysis, Insights and Forecast - by Solution Type
- 8. Europe Medical Claims Management Industry Analysis, Insights and Forecast, 2020-2032
- 8.1. Market Analysis, Insights and Forecast - by Solution Type
- 8.1.1. Integrated Solutions
- 8.1.2. Standalone Solutions
- 8.2. Market Analysis, Insights and Forecast - by Component
- 8.2.1. Services
- 8.2.2. Software
- 8.3. Market Analysis, Insights and Forecast - by Delivery Mode
- 8.3.1. On-Premise
- 8.3.2. Cloud-Based
- 8.4. Market Analysis, Insights and Forecast - by End User
- 8.4.1. Healthcare Payers
- 8.4.2. Healthcare Providers
- 8.4.3. Other End Users
- 8.1. Market Analysis, Insights and Forecast - by Solution Type
- 9. Asia Pacific Medical Claims Management Industry Analysis, Insights and Forecast, 2020-2032
- 9.1. Market Analysis, Insights and Forecast - by Solution Type
- 9.1.1. Integrated Solutions
- 9.1.2. Standalone Solutions
- 9.2. Market Analysis, Insights and Forecast - by Component
- 9.2.1. Services
- 9.2.2. Software
- 9.3. Market Analysis, Insights and Forecast - by Delivery Mode
- 9.3.1. On-Premise
- 9.3.2. Cloud-Based
- 9.4. Market Analysis, Insights and Forecast - by End User
- 9.4.1. Healthcare Payers
- 9.4.2. Healthcare Providers
- 9.4.3. Other End Users
- 9.1. Market Analysis, Insights and Forecast - by Solution Type
- 10. Middle East and Africa Medical Claims Management Industry Analysis, Insights and Forecast, 2020-2032
- 10.1. Market Analysis, Insights and Forecast - by Solution Type
- 10.1.1. Integrated Solutions
- 10.1.2. Standalone Solutions
- 10.2. Market Analysis, Insights and Forecast - by Component
- 10.2.1. Services
- 10.2.2. Software
- 10.3. Market Analysis, Insights and Forecast - by Delivery Mode
- 10.3.1. On-Premise
- 10.3.2. Cloud-Based
- 10.4. Market Analysis, Insights and Forecast - by End User
- 10.4.1. Healthcare Payers
- 10.4.2. Healthcare Providers
- 10.4.3. Other End Users
- 10.1. Market Analysis, Insights and Forecast - by Solution Type
- 11. South America Medical Claims Management Industry Analysis, Insights and Forecast, 2020-2032
- 11.1. Market Analysis, Insights and Forecast - by Solution Type
- 11.1.1. Integrated Solutions
- 11.1.2. Standalone Solutions
- 11.2. Market Analysis, Insights and Forecast - by Component
- 11.2.1. Services
- 11.2.2. Software
- 11.3. Market Analysis, Insights and Forecast - by Delivery Mode
- 11.3.1. On-Premise
- 11.3.2. Cloud-Based
- 11.4. Market Analysis, Insights and Forecast - by End User
- 11.4.1. Healthcare Payers
- 11.4.2. Healthcare Providers
- 11.4.3. Other End Users
- 11.1. Market Analysis, Insights and Forecast - by Solution Type
- 12. Competitive Analysis
- 12.1. Company Profiles
- 12.1.1 Mckesson Corporation
- 12.1.1.1. Company Overview
- 12.1.1.2. Products
- 12.1.1.3. Company Financials
- 12.1.1.4. SWOT Analysis
- 12.1.2 Oracle Corporation (Cerner Corporation)
- 12.1.2.1. Company Overview
- 12.1.2.2. Products
- 12.1.2.3. Company Financials
- 12.1.2.4. SWOT Analysis
- 12.1.3 IBM Corporation
- 12.1.3.1. Company Overview
- 12.1.3.2. Products
- 12.1.3.3. Company Financials
- 12.1.3.4. SWOT Analysis
- 12.1.4 Accenture plc
- 12.1.4.1. Company Overview
- 12.1.4.2. Products
- 12.1.4.3. Company Financials
- 12.1.4.4. SWOT Analysis
- 12.1.5 RP Sanjiv Goenka Group (FirstSource)*List Not Exhaustive
- 12.1.5.1. Company Overview
- 12.1.5.2. Products
- 12.1.5.3. Company Financials
- 12.1.5.4. SWOT Analysis
- 12.1.6 Optum Inc
- 12.1.6.1. Company Overview
- 12.1.6.2. Products
- 12.1.6.3. Company Financials
- 12.1.6.4. SWOT Analysis
- 12.1.7 Conduent Inc (Health Solutions Plus)
- 12.1.7.1. Company Overview
- 12.1.7.2. Products
- 12.1.7.3. Company Financials
- 12.1.7.4. SWOT Analysis
- 12.1.8 Allscripts Healthcare Solutions Inc
- 12.1.8.1. Company Overview
- 12.1.8.2. Products
- 12.1.8.3. Company Financials
- 12.1.8.4. SWOT Analysis
- 12.1.9 OSP Labs
- 12.1.9.1. Company Overview
- 12.1.9.2. Products
- 12.1.9.3. Company Financials
- 12.1.9.4. SWOT Analysis
- 12.1.10 Genpact Limited
- 12.1.10.1. Company Overview
- 12.1.10.2. Products
- 12.1.10.3. Company Financials
- 12.1.10.4. SWOT Analysis
- 12.1.11 Athenahealth Inc
- 12.1.11.1. Company Overview
- 12.1.11.2. Products
- 12.1.11.3. Company Financials
- 12.1.11.4. SWOT Analysis
- 12.1.1 Mckesson Corporation
- 12.2. Market Entropy
- 12.2.1 Company's Key Areas Served
- 12.2.2 Recent Developments
- 12.3. Company Market Share Analysis 2025
- 12.3.1 Top 5 Companies Market Share Analysis
- 12.3.2 Top 3 Companies Market Share Analysis
- 12.4. List of Potential Customers
- 13. Research Methodology
List of Figures
- Figure 1: Global Medical Claims Management Industry Revenue Breakdown (Million, %) by Region 2025 & 2033
- Figure 2: North America Medical Claims Management Industry Revenue (Million), by Solution Type 2025 & 2033
- Figure 3: North America Medical Claims Management Industry Revenue Share (%), by Solution Type 2025 & 2033
- Figure 4: North America Medical Claims Management Industry Revenue (Million), by Component 2025 & 2033
- Figure 5: North America Medical Claims Management Industry Revenue Share (%), by Component 2025 & 2033
- Figure 6: North America Medical Claims Management Industry Revenue (Million), by Delivery Mode 2025 & 2033
- Figure 7: North America Medical Claims Management Industry Revenue Share (%), by Delivery Mode 2025 & 2033
- Figure 8: North America Medical Claims Management Industry Revenue (Million), by End User 2025 & 2033
- Figure 9: North America Medical Claims Management Industry Revenue Share (%), by End User 2025 & 2033
- Figure 10: North America Medical Claims Management Industry Revenue (Million), by Country 2025 & 2033
- Figure 11: North America Medical Claims Management Industry Revenue Share (%), by Country 2025 & 2033
- Figure 12: Europe Medical Claims Management Industry Revenue (Million), by Solution Type 2025 & 2033
- Figure 13: Europe Medical Claims Management Industry Revenue Share (%), by Solution Type 2025 & 2033
- Figure 14: Europe Medical Claims Management Industry Revenue (Million), by Component 2025 & 2033
- Figure 15: Europe Medical Claims Management Industry Revenue Share (%), by Component 2025 & 2033
- Figure 16: Europe Medical Claims Management Industry Revenue (Million), by Delivery Mode 2025 & 2033
- Figure 17: Europe Medical Claims Management Industry Revenue Share (%), by Delivery Mode 2025 & 2033
- Figure 18: Europe Medical Claims Management Industry Revenue (Million), by End User 2025 & 2033
- Figure 19: Europe Medical Claims Management Industry Revenue Share (%), by End User 2025 & 2033
- Figure 20: Europe Medical Claims Management Industry Revenue (Million), by Country 2025 & 2033
- Figure 21: Europe Medical Claims Management Industry Revenue Share (%), by Country 2025 & 2033
- Figure 22: Asia Pacific Medical Claims Management Industry Revenue (Million), by Solution Type 2025 & 2033
- Figure 23: Asia Pacific Medical Claims Management Industry Revenue Share (%), by Solution Type 2025 & 2033
- Figure 24: Asia Pacific Medical Claims Management Industry Revenue (Million), by Component 2025 & 2033
- Figure 25: Asia Pacific Medical Claims Management Industry Revenue Share (%), by Component 2025 & 2033
- Figure 26: Asia Pacific Medical Claims Management Industry Revenue (Million), by Delivery Mode 2025 & 2033
- Figure 27: Asia Pacific Medical Claims Management Industry Revenue Share (%), by Delivery Mode 2025 & 2033
- Figure 28: Asia Pacific Medical Claims Management Industry Revenue (Million), by End User 2025 & 2033
- Figure 29: Asia Pacific Medical Claims Management Industry Revenue Share (%), by End User 2025 & 2033
- Figure 30: Asia Pacific Medical Claims Management Industry Revenue (Million), by Country 2025 & 2033
- Figure 31: Asia Pacific Medical Claims Management Industry Revenue Share (%), by Country 2025 & 2033
- Figure 32: Middle East and Africa Medical Claims Management Industry Revenue (Million), by Solution Type 2025 & 2033
- Figure 33: Middle East and Africa Medical Claims Management Industry Revenue Share (%), by Solution Type 2025 & 2033
- Figure 34: Middle East and Africa Medical Claims Management Industry Revenue (Million), by Component 2025 & 2033
- Figure 35: Middle East and Africa Medical Claims Management Industry Revenue Share (%), by Component 2025 & 2033
- Figure 36: Middle East and Africa Medical Claims Management Industry Revenue (Million), by Delivery Mode 2025 & 2033
- Figure 37: Middle East and Africa Medical Claims Management Industry Revenue Share (%), by Delivery Mode 2025 & 2033
- Figure 38: Middle East and Africa Medical Claims Management Industry Revenue (Million), by End User 2025 & 2033
- Figure 39: Middle East and Africa Medical Claims Management Industry Revenue Share (%), by End User 2025 & 2033
- Figure 40: Middle East and Africa Medical Claims Management Industry Revenue (Million), by Country 2025 & 2033
- Figure 41: Middle East and Africa Medical Claims Management Industry Revenue Share (%), by Country 2025 & 2033
- Figure 42: South America Medical Claims Management Industry Revenue (Million), by Solution Type 2025 & 2033
- Figure 43: South America Medical Claims Management Industry Revenue Share (%), by Solution Type 2025 & 2033
- Figure 44: South America Medical Claims Management Industry Revenue (Million), by Component 2025 & 2033
- Figure 45: South America Medical Claims Management Industry Revenue Share (%), by Component 2025 & 2033
- Figure 46: South America Medical Claims Management Industry Revenue (Million), by Delivery Mode 2025 & 2033
- Figure 47: South America Medical Claims Management Industry Revenue Share (%), by Delivery Mode 2025 & 2033
- Figure 48: South America Medical Claims Management Industry Revenue (Million), by End User 2025 & 2033
- Figure 49: South America Medical Claims Management Industry Revenue Share (%), by End User 2025 & 2033
- Figure 50: South America Medical Claims Management Industry Revenue (Million), by Country 2025 & 2033
- Figure 51: South America Medical Claims Management Industry Revenue Share (%), by Country 2025 & 2033
List of Tables
- Table 1: Global Medical Claims Management Industry Revenue Million Forecast, by Solution Type 2020 & 2033
- Table 2: Global Medical Claims Management Industry Revenue Million Forecast, by Component 2020 & 2033
- Table 3: Global Medical Claims Management Industry Revenue Million Forecast, by Delivery Mode 2020 & 2033
- Table 4: Global Medical Claims Management Industry Revenue Million Forecast, by End User 2020 & 2033
- Table 5: Global Medical Claims Management Industry Revenue Million Forecast, by Region 2020 & 2033
- Table 6: Global Medical Claims Management Industry Revenue Million Forecast, by Solution Type 2020 & 2033
- Table 7: Global Medical Claims Management Industry Revenue Million Forecast, by Component 2020 & 2033
- Table 8: Global Medical Claims Management Industry Revenue Million Forecast, by Delivery Mode 2020 & 2033
- Table 9: Global Medical Claims Management Industry Revenue Million Forecast, by End User 2020 & 2033
- Table 10: Global Medical Claims Management Industry Revenue Million Forecast, by Country 2020 & 2033
- Table 11: United States Medical Claims Management Industry Revenue (Million) Forecast, by Application 2020 & 2033
- Table 12: Canada Medical Claims Management Industry Revenue (Million) Forecast, by Application 2020 & 2033
- Table 13: Mexico Medical Claims Management Industry Revenue (Million) Forecast, by Application 2020 & 2033
- Table 14: Global Medical Claims Management Industry Revenue Million Forecast, by Solution Type 2020 & 2033
- Table 15: Global Medical Claims Management Industry Revenue Million Forecast, by Component 2020 & 2033
- Table 16: Global Medical Claims Management Industry Revenue Million Forecast, by Delivery Mode 2020 & 2033
- Table 17: Global Medical Claims Management Industry Revenue Million Forecast, by End User 2020 & 2033
- Table 18: Global Medical Claims Management Industry Revenue Million Forecast, by Country 2020 & 2033
- Table 19: Germany Medical Claims Management Industry Revenue (Million) Forecast, by Application 2020 & 2033
- Table 20: United Kingdom Medical Claims Management Industry Revenue (Million) Forecast, by Application 2020 & 2033
- Table 21: France Medical Claims Management Industry Revenue (Million) Forecast, by Application 2020 & 2033
- Table 22: Italy Medical Claims Management Industry Revenue (Million) Forecast, by Application 2020 & 2033
- Table 23: Spain Medical Claims Management Industry Revenue (Million) Forecast, by Application 2020 & 2033
- Table 24: Rest of Europe Medical Claims Management Industry Revenue (Million) Forecast, by Application 2020 & 2033
- Table 25: Global Medical Claims Management Industry Revenue Million Forecast, by Solution Type 2020 & 2033
- Table 26: Global Medical Claims Management Industry Revenue Million Forecast, by Component 2020 & 2033
- Table 27: Global Medical Claims Management Industry Revenue Million Forecast, by Delivery Mode 2020 & 2033
- Table 28: Global Medical Claims Management Industry Revenue Million Forecast, by End User 2020 & 2033
- Table 29: Global Medical Claims Management Industry Revenue Million Forecast, by Country 2020 & 2033
- Table 30: China Medical Claims Management Industry Revenue (Million) Forecast, by Application 2020 & 2033
- Table 31: Japan Medical Claims Management Industry Revenue (Million) Forecast, by Application 2020 & 2033
- Table 32: India Medical Claims Management Industry Revenue (Million) Forecast, by Application 2020 & 2033
- Table 33: Australia Medical Claims Management Industry Revenue (Million) Forecast, by Application 2020 & 2033
- Table 34: South Korea Medical Claims Management Industry Revenue (Million) Forecast, by Application 2020 & 2033
- Table 35: Rest of Asia Pacific Medical Claims Management Industry Revenue (Million) Forecast, by Application 2020 & 2033
- Table 36: Global Medical Claims Management Industry Revenue Million Forecast, by Solution Type 2020 & 2033
- Table 37: Global Medical Claims Management Industry Revenue Million Forecast, by Component 2020 & 2033
- Table 38: Global Medical Claims Management Industry Revenue Million Forecast, by Delivery Mode 2020 & 2033
- Table 39: Global Medical Claims Management Industry Revenue Million Forecast, by End User 2020 & 2033
- Table 40: Global Medical Claims Management Industry Revenue Million Forecast, by Country 2020 & 2033
- Table 41: GCC Medical Claims Management Industry Revenue (Million) Forecast, by Application 2020 & 2033
- Table 42: South Africa Medical Claims Management Industry Revenue (Million) Forecast, by Application 2020 & 2033
- Table 43: Rest of Middle East and Africa Medical Claims Management Industry Revenue (Million) Forecast, by Application 2020 & 2033
- Table 44: Global Medical Claims Management Industry Revenue Million Forecast, by Solution Type 2020 & 2033
- Table 45: Global Medical Claims Management Industry Revenue Million Forecast, by Component 2020 & 2033
- Table 46: Global Medical Claims Management Industry Revenue Million Forecast, by Delivery Mode 2020 & 2033
- Table 47: Global Medical Claims Management Industry Revenue Million Forecast, by End User 2020 & 2033
- Table 48: Global Medical Claims Management Industry Revenue Million Forecast, by Country 2020 & 2033
- Table 49: Brazil Medical Claims Management Industry Revenue (Million) Forecast, by Application 2020 & 2033
- Table 50: Argentina Medical Claims Management Industry Revenue (Million) Forecast, by Application 2020 & 2033
- Table 51: Rest of South America Medical Claims Management Industry Revenue (Million) Forecast, by Application 2020 & 2033
Frequently Asked Questions
1. What is the projected Compound Annual Growth Rate (CAGR) of the Medical Claims Management Industry?
The projected CAGR is approximately 16.29%.
2. Which companies are prominent players in the Medical Claims Management Industry?
Key companies in the market include Mckesson Corporation, Oracle Corporation (Cerner Corporation), IBM Corporation, Accenture plc, RP Sanjiv Goenka Group (FirstSource)*List Not Exhaustive, Optum Inc, Conduent Inc (Health Solutions Plus), Allscripts Healthcare Solutions Inc, OSP Labs, Genpact Limited, Athenahealth Inc.
3. What are the main segments of the Medical Claims Management Industry?
The market segments include Solution Type, Component, Delivery Mode, End User.
4. Can you provide details about the market size?
The market size is estimated to be USD 23.84 Million as of 2022.
5. What are some drivers contributing to market growth?
Government Initiatives Supporting Health Insurance Market; Rising Importance of Denials Management; Growing Aging population with chronic diseases.
6. What are the notable trends driving market growth?
Cloud-based is Expected to Hold Significant Market Share in Healthcare Claim Management Marke.
7. Are there any restraints impacting market growth?
Patient Data Privacy and Security Concerns; High Deployment Costs.
8. Can you provide examples of recent developments in the market?
N/A
9. What pricing options are available for accessing the report?
Pricing options include single-user, multi-user, and enterprise licenses priced at USD 4750, USD 5250, and USD 8750 respectively.
10. Is the market size provided in terms of value or volume?
The market size is provided in terms of value, measured in Million.
11. Are there any specific market keywords associated with the report?
Yes, the market keyword associated with the report is "Medical Claims Management Industry," which aids in identifying and referencing the specific market segment covered.
12. How do I determine which pricing option suits my needs best?
The pricing options vary based on user requirements and access needs. Individual users may opt for single-user licenses, while businesses requiring broader access may choose multi-user or enterprise licenses for cost-effective access to the report.
13. Are there any additional resources or data provided in the Medical Claims Management Industry report?
While the report offers comprehensive insights, it's advisable to review the specific contents or supplementary materials provided to ascertain if additional resources or data are available.
14. How can I stay updated on further developments or reports in the Medical Claims Management Industry?
To stay informed about further developments, trends, and reports in the Medical Claims Management Industry, consider subscribing to industry newsletters, following relevant companies and organizations, or regularly checking reputable industry news sources and publications.
Methodology
Step 1 - Identification of Relevant Samples Size from Population Database


Step 2 - Approaches for Defining Global Market Size (Value, Volume* & Price*)

Note*: In applicable scenarios
Step 3 - Data Sources
Primary Research
- Web Analytics
- Survey Reports
- Research Institute
- Latest Research Reports
- Opinion Leaders
Secondary Research
- Annual Reports
- White Paper
- Latest Press Release
- Industry Association
- Paid Database
- Investor Presentations

Step 4 - Data Triangulation
Involves using different sources of information in order to increase the validity of a study
These sources are likely to be stakeholders in a program - participants, other researchers, program staff, other community members, and so on.
Then we put all data in single framework & apply various statistical tools to find out the dynamic on the market.
During the analysis stage, feedback from the stakeholder groups would be compared to determine areas of agreement as well as areas of divergence