

Key Insights
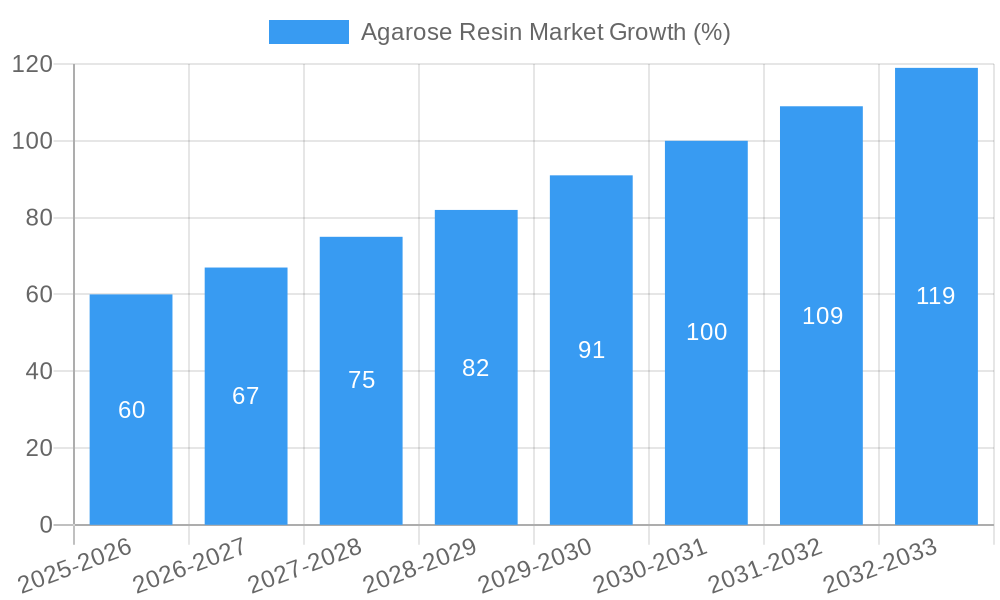
The Agarose Resin market, valued at $0.68 billion in 2025, is projected to experience robust growth, exhibiting a compound annual growth rate (CAGR) of 8.91% from 2025 to 2033. This expansion is fueled by several key factors. The increasing demand for biopharmaceuticals and the growing adoption of advanced purification techniques in biotechnology and life sciences are primary drivers. Furthermore, the rising prevalence of chronic diseases globally necessitates increased development and production of novel therapeutics, which in turn boosts the demand for high-quality agarose resins crucial in downstream processing. The market's growth is further supported by ongoing research and development efforts focused on improving the efficiency and selectivity of agarose resins, leading to the introduction of innovative products with enhanced performance characteristics. While challenges such as fluctuations in raw material prices and stringent regulatory approvals might pose some constraints, the overall market outlook remains positive due to the consistent demand from various application areas. Major players like Ecolab Inc (Purolite), Takara Bio Inc, Bio-Rad Laboratories Inc, and Thermo Fisher Scientific Inc are actively contributing to the market's expansion through strategic investments in research, acquisitions, and the development of innovative products, creating a competitive landscape yet driving continuous improvements in agarose resin technology.
The competitive landscape is characterized by the presence of both established global players and emerging specialized companies. The market is witnessing consolidation through mergers and acquisitions, with companies focusing on expanding their product portfolios and geographical reach. The increasing focus on personalized medicine and advanced therapeutic modalities is expected to further drive market growth, requiring efficient and selective purification processes using sophisticated agarose resins. Geographical expansion, especially in emerging economies with growing healthcare sectors and research infrastructure, presents significant opportunities for market players. Continuous technological advancements, including the development of novel agarose resin chemistries with improved binding capacity and selectivity, are anticipated to further enhance the market’s overall performance and drive future growth.

Agarose Resin Market: A Comprehensive Market Report (2019-2033)
This comprehensive report provides a detailed analysis of the Agarose Resin market, encompassing market dynamics, growth trends, regional analysis, product landscape, key players, and future outlook. The report covers the historical period (2019-2024), base year (2025), and forecast period (2025-2033), offering valuable insights for industry professionals, investors, and stakeholders. The parent market is the Biotechnology and Life Sciences Industry, while the child market is Bioseparation and Purification. The market is projected to reach xx Million by 2033.
Agarose Resin Market Market Dynamics & Structure
The Agarose Resin market is characterized by moderate concentration, with key players holding significant market share. Technological innovation, particularly in resin design and functionalization, is a primary growth driver. Stringent regulatory frameworks, particularly in pharmaceutical applications, influence market dynamics. Competitive substitutes, such as other chromatographic resins, pose a challenge. End-user demographics are primarily focused on biopharmaceutical, academic research, and industrial biotechnology sectors. M&A activity has been moderate, with several strategic alliances and partnerships formed to expand market reach and technological capabilities.
- Market Concentration: Moderately concentrated, with top 5 players holding approximately xx% market share in 2024.
- Technological Innovation: Focus on high-throughput purification, improved binding capacity, and cost-effective manufacturing.
- Regulatory Frameworks: Compliance with GMP (Good Manufacturing Practices) and other relevant regulations is crucial.
- Competitive Substitutes: Other chromatographic resins (e.g., ion exchange, hydrophobic interaction) compete for market share.
- End-User Demographics: Biopharmaceutical companies, research institutions, and industrial biotechnology firms are major consumers.
- M&A Trends: Moderate activity, driven by strategic partnerships and expansion into new geographic regions. Approximately xx M&A deals were recorded between 2019 and 2024.
Agarose Resin Market Growth Trends & Insights
The Agarose Resin market experienced robust growth between 2019 and 2024, driven by increasing demand from the biopharmaceutical industry. The market size is estimated at xx Million in 2025, exhibiting a CAGR of xx% during the historical period. Technological advancements, including the development of novel resin chemistries and improved purification processes, have fueled adoption rates. The rising prevalence of chronic diseases and growing investments in biopharmaceutical research are contributing to market expansion. Consumer behavior shifts toward preference for high-purity products and efficient purification technologies further fuel growth. Increased automation and process optimization are expected to accelerate growth in the forecast period. Market penetration is currently at xx%, with substantial potential for growth in emerging markets.
Dominant Regions, Countries, or Segments in Agarose Resin Market
North America currently dominates the Agarose Resin market, driven by robust biopharmaceutical R&D activities and favorable regulatory environments. Europe holds the second largest market share. Asia-Pacific is witnessing significant growth, fueled by rising investments in biotechnology and pharmaceutical industries, particularly in China and India. The biopharmaceutical segment is the largest and fastest growing segment, owing to its wide application in monoclonal antibody purification.
- North America: Strong regulatory framework, high R&D spending, and presence of major market players.
- Europe: Well-established pharmaceutical industry and strong focus on innovation.
- Asia-Pacific: Rapid growth driven by increasing investments in biotechnology and pharmaceutical industries.
- Biopharmaceutical Segment: Largest and fastest-growing segment, driven by the high demand for purified biologics.
Agarose Resin Market Product Landscape
Agarose resins are available in various forms, including beads, columns, and pre-packed cartridges, tailored to specific applications and purification needs. Recent innovations focus on enhancing binding capacity, selectivity, and overall performance. The introduction of new functionalities, such as improved ligand immobilization techniques, contributes to higher purification efficiency. Key selling propositions include high purity, scalability, and cost-effectiveness.
Key Drivers, Barriers & Challenges in Agarose Resin Market
Key Drivers:
- Growing demand for biopharmaceuticals and biologics
- Advancements in resin technologies, improving efficiency and selectivity.
- Increased investments in biotechnology research and development.
Challenges:
- Competition from other chromatographic resins.
- Stringent regulatory requirements, increasing development and approval costs.
- Supply chain disruptions impacting resin availability and cost. (Estimated impact on market growth: xx% in 2024).
Emerging Opportunities in Agarose Resin Market
- Expanding applications in personalized medicine and gene therapy.
- Development of novel resin chemistries for targeted purification of complex biomolecules.
- Penetration into emerging markets with growing biotechnological capabilities.
Growth Accelerators in the Agarose Resin Market Industry
Technological breakthroughs, such as the development of next-generation agarose resins with enhanced binding capacity and selectivity, are crucial growth accelerators. Strategic partnerships and collaborations between resin manufacturers and biopharmaceutical companies are fueling innovation and market expansion. Increased investments in manufacturing capacity to meet growing demand also contribute to long-term growth.
Key Players Shaping the Agarose Resin Market Market
- Ecolab Inc (Purolite)
- Takara Bio Inc
- Bio-Rad Laboratories Inc
- Cube Biotech Inc
- Cytiva
- Agarose Beads Technologies
- Merck KGaA
- Thermo Fisher Scientific Inc
- Bio-Works
- Tosoh Bioscience LLC
- Repligen Corporation
- Kaneka Corporation
- *List Not Exhaustive
Notable Milestones in Agarose Resin Market Sector
- April 2024: Agarose Beads Technologies received halal certification for some of its agarose beads.
- February 2024: Purolite and Repligen Corporation launched Praesto CH1, a new 70-micrometer agarose-based affinity resin.
In-Depth Agarose Resin Market Market Outlook
The Agarose Resin market is poised for continued growth, driven by the factors mentioned above. Strategic opportunities lie in developing innovative resin technologies, expanding into new applications, and forging partnerships to expand market reach. The market's future potential is substantial, particularly in emerging markets and rapidly growing segments like biosimilars and cell therapy.
Agarose Resin Market Segmentation
-
1. Concentration
- 1.1. 2% to 4%
- 1.2. 4% to 6%
- 1.3. 6% to 8%
- 1.4. More than 8%
-
2. Application
- 2.1. Protein Purification
- 2.2. Antibody Purification
- 2.3. Immunoprecipitation
- 2.4. Others
-
3. End User
- 3.1. Pharmaceutical and Biopharmaceutical Companies
- 3.2. Research Laboratories
- 3.3. Other End Users
Agarose Resin Market Segmentation By Geography
-
1. North America
- 1.1. United States
- 1.2. Canada
- 1.3. Mexico
-
2. Europe
- 2.1. Germany
- 2.2. United Kingdom
- 2.3. France
- 2.4. Italy
- 2.5. Spain
- 2.6. Rest of Europe
-
3. Asia Pacific
- 3.1. China
- 3.2. Japan
- 3.3. India
- 3.4. Australia
- 3.5. South Korea
- 3.6. Rest of Asia Pacific
-
4. Middle East and Africa
- 4.1. GCC
- 4.2. South Africa
- 4.3. Rest of Middle East and Africa
-
5. South America
- 5.1. Brazil
- 5.2. Argentina
- 5.3. Rest of South America

Agarose Resin Market REPORT HIGHLIGHTS
| Aspects | Details |
|---|---|
| Study Period | 2019-2033 |
| Base Year | 2024 |
| Estimated Year | 2025 |
| Forecast Period | 2025-2033 |
| Historical Period | 2019-2024 |
| Growth Rate | CAGR of 8.91% from 2019-2033 |
| Segmentation |
|
Table of Contents
- 1. Introduction
- 1.1. Research Scope
- 1.2. Market Segmentation
- 1.3. Research Methodology
- 1.4. Definitions and Assumptions
- 2. Executive Summary
- 2.1. Introduction
- 3. Market Dynamics
- 3.1. Introduction
- 3.2. Market Drivers
- 3.2.1. Rising Applications of Agarose Resin in Biopharmaceutical Industry; Surging Research and Development Activities
- 3.3. Market Restrains
- 3.3.1. Rising Applications of Agarose Resin in Biopharmaceutical Industry; Surging Research and Development Activities
- 3.4. Market Trends
- 3.4.1. Protein Purification Segment is Expected to Hold a Highest Share of the Market
- 4. Market Factor Analysis
- 4.1. Porters Five Forces
- 4.2. Supply/Value Chain
- 4.3. PESTEL analysis
- 4.4. Market Entropy
- 4.5. Patent/Trademark Analysis
- 5. Global Agarose Resin Market Analysis, Insights and Forecast, 2019-2031
- 5.1. Market Analysis, Insights and Forecast - by Concentration
- 5.1.1. 2% to 4%
- 5.1.2. 4% to 6%
- 5.1.3. 6% to 8%
- 5.1.4. More than 8%
- 5.2. Market Analysis, Insights and Forecast - by Application
- 5.2.1. Protein Purification
- 5.2.2. Antibody Purification
- 5.2.3. Immunoprecipitation
- 5.2.4. Others
- 5.3. Market Analysis, Insights and Forecast - by End User
- 5.3.1. Pharmaceutical and Biopharmaceutical Companies
- 5.3.2. Research Laboratories
- 5.3.3. Other End Users
- 5.4. Market Analysis, Insights and Forecast - by Region
- 5.4.1. North America
- 5.4.2. Europe
- 5.4.3. Asia Pacific
- 5.4.4. Middle East and Africa
- 5.4.5. South America
- 5.1. Market Analysis, Insights and Forecast - by Concentration
- 6. North America Agarose Resin Market Analysis, Insights and Forecast, 2019-2031
- 6.1. Market Analysis, Insights and Forecast - by Concentration
- 6.1.1. 2% to 4%
- 6.1.2. 4% to 6%
- 6.1.3. 6% to 8%
- 6.1.4. More than 8%
- 6.2. Market Analysis, Insights and Forecast - by Application
- 6.2.1. Protein Purification
- 6.2.2. Antibody Purification
- 6.2.3. Immunoprecipitation
- 6.2.4. Others
- 6.3. Market Analysis, Insights and Forecast - by End User
- 6.3.1. Pharmaceutical and Biopharmaceutical Companies
- 6.3.2. Research Laboratories
- 6.3.3. Other End Users
- 6.1. Market Analysis, Insights and Forecast - by Concentration
- 7. Europe Agarose Resin Market Analysis, Insights and Forecast, 2019-2031
- 7.1. Market Analysis, Insights and Forecast - by Concentration
- 7.1.1. 2% to 4%
- 7.1.2. 4% to 6%
- 7.1.3. 6% to 8%
- 7.1.4. More than 8%
- 7.2. Market Analysis, Insights and Forecast - by Application
- 7.2.1. Protein Purification
- 7.2.2. Antibody Purification
- 7.2.3. Immunoprecipitation
- 7.2.4. Others
- 7.3. Market Analysis, Insights and Forecast - by End User
- 7.3.1. Pharmaceutical and Biopharmaceutical Companies
- 7.3.2. Research Laboratories
- 7.3.3. Other End Users
- 7.1. Market Analysis, Insights and Forecast - by Concentration
- 8. Asia Pacific Agarose Resin Market Analysis, Insights and Forecast, 2019-2031
- 8.1. Market Analysis, Insights and Forecast - by Concentration
- 8.1.1. 2% to 4%
- 8.1.2. 4% to 6%
- 8.1.3. 6% to 8%
- 8.1.4. More than 8%
- 8.2. Market Analysis, Insights and Forecast - by Application
- 8.2.1. Protein Purification
- 8.2.2. Antibody Purification
- 8.2.3. Immunoprecipitation
- 8.2.4. Others
- 8.3. Market Analysis, Insights and Forecast - by End User
- 8.3.1. Pharmaceutical and Biopharmaceutical Companies
- 8.3.2. Research Laboratories
- 8.3.3. Other End Users
- 8.1. Market Analysis, Insights and Forecast - by Concentration
- 9. Middle East and Africa Agarose Resin Market Analysis, Insights and Forecast, 2019-2031
- 9.1. Market Analysis, Insights and Forecast - by Concentration
- 9.1.1. 2% to 4%
- 9.1.2. 4% to 6%
- 9.1.3. 6% to 8%
- 9.1.4. More than 8%
- 9.2. Market Analysis, Insights and Forecast - by Application
- 9.2.1. Protein Purification
- 9.2.2. Antibody Purification
- 9.2.3. Immunoprecipitation
- 9.2.4. Others
- 9.3. Market Analysis, Insights and Forecast - by End User
- 9.3.1. Pharmaceutical and Biopharmaceutical Companies
- 9.3.2. Research Laboratories
- 9.3.3. Other End Users
- 9.1. Market Analysis, Insights and Forecast - by Concentration
- 10. South America Agarose Resin Market Analysis, Insights and Forecast, 2019-2031
- 10.1. Market Analysis, Insights and Forecast - by Concentration
- 10.1.1. 2% to 4%
- 10.1.2. 4% to 6%
- 10.1.3. 6% to 8%
- 10.1.4. More than 8%
- 10.2. Market Analysis, Insights and Forecast - by Application
- 10.2.1. Protein Purification
- 10.2.2. Antibody Purification
- 10.2.3. Immunoprecipitation
- 10.2.4. Others
- 10.3. Market Analysis, Insights and Forecast - by End User
- 10.3.1. Pharmaceutical and Biopharmaceutical Companies
- 10.3.2. Research Laboratories
- 10.3.3. Other End Users
- 10.1. Market Analysis, Insights and Forecast - by Concentration
- 11. Competitive Analysis
- 11.1. Global Market Share Analysis 2024
- 11.2. Company Profiles
- 11.2.1 Ecolab Inc (Purolite)
- 11.2.1.1. Overview
- 11.2.1.2. Products
- 11.2.1.3. SWOT Analysis
- 11.2.1.4. Recent Developments
- 11.2.1.5. Financials (Based on Availability)
- 11.2.2 Takara Bio Inc
- 11.2.2.1. Overview
- 11.2.2.2. Products
- 11.2.2.3. SWOT Analysis
- 11.2.2.4. Recent Developments
- 11.2.2.5. Financials (Based on Availability)
- 11.2.3 Bio-Rad Laboratories Inc
- 11.2.3.1. Overview
- 11.2.3.2. Products
- 11.2.3.3. SWOT Analysis
- 11.2.3.4. Recent Developments
- 11.2.3.5. Financials (Based on Availability)
- 11.2.4 Cube Biotech Inc
- 11.2.4.1. Overview
- 11.2.4.2. Products
- 11.2.4.3. SWOT Analysis
- 11.2.4.4. Recent Developments
- 11.2.4.5. Financials (Based on Availability)
- 11.2.5 Cytiva
- 11.2.5.1. Overview
- 11.2.5.2. Products
- 11.2.5.3. SWOT Analysis
- 11.2.5.4. Recent Developments
- 11.2.5.5. Financials (Based on Availability)
- 11.2.6 Agarose Beads Technologies
- 11.2.6.1. Overview
- 11.2.6.2. Products
- 11.2.6.3. SWOT Analysis
- 11.2.6.4. Recent Developments
- 11.2.6.5. Financials (Based on Availability)
- 11.2.7 Merck KGaA
- 11.2.7.1. Overview
- 11.2.7.2. Products
- 11.2.7.3. SWOT Analysis
- 11.2.7.4. Recent Developments
- 11.2.7.5. Financials (Based on Availability)
- 11.2.8 Thermo Fisher Scientific Inc
- 11.2.8.1. Overview
- 11.2.8.2. Products
- 11.2.8.3. SWOT Analysis
- 11.2.8.4. Recent Developments
- 11.2.8.5. Financials (Based on Availability)
- 11.2.9 Bio-Works
- 11.2.9.1. Overview
- 11.2.9.2. Products
- 11.2.9.3. SWOT Analysis
- 11.2.9.4. Recent Developments
- 11.2.9.5. Financials (Based on Availability)
- 11.2.10 Tosoh Bioscience LLC
- 11.2.10.1. Overview
- 11.2.10.2. Products
- 11.2.10.3. SWOT Analysis
- 11.2.10.4. Recent Developments
- 11.2.10.5. Financials (Based on Availability)
- 11.2.11 Repligen Corporation
- 11.2.11.1. Overview
- 11.2.11.2. Products
- 11.2.11.3. SWOT Analysis
- 11.2.11.4. Recent Developments
- 11.2.11.5. Financials (Based on Availability)
- 11.2.12 Kaneka Corporation*List Not Exhaustive
- 11.2.12.1. Overview
- 11.2.12.2. Products
- 11.2.12.3. SWOT Analysis
- 11.2.12.4. Recent Developments
- 11.2.12.5. Financials (Based on Availability)
- 11.2.1 Ecolab Inc (Purolite)
List of Figures
- Figure 1: Global Agarose Resin Market Revenue Breakdown (Million, %) by Region 2024 & 2032
- Figure 2: Global Agarose Resin Market Volume Breakdown (Billion, %) by Region 2024 & 2032
- Figure 3: North America Agarose Resin Market Revenue (Million), by Concentration 2024 & 2032
- Figure 4: North America Agarose Resin Market Volume (Billion), by Concentration 2024 & 2032
- Figure 5: North America Agarose Resin Market Revenue Share (%), by Concentration 2024 & 2032
- Figure 6: North America Agarose Resin Market Volume Share (%), by Concentration 2024 & 2032
- Figure 7: North America Agarose Resin Market Revenue (Million), by Application 2024 & 2032
- Figure 8: North America Agarose Resin Market Volume (Billion), by Application 2024 & 2032
- Figure 9: North America Agarose Resin Market Revenue Share (%), by Application 2024 & 2032
- Figure 10: North America Agarose Resin Market Volume Share (%), by Application 2024 & 2032
- Figure 11: North America Agarose Resin Market Revenue (Million), by End User 2024 & 2032
- Figure 12: North America Agarose Resin Market Volume (Billion), by End User 2024 & 2032
- Figure 13: North America Agarose Resin Market Revenue Share (%), by End User 2024 & 2032
- Figure 14: North America Agarose Resin Market Volume Share (%), by End User 2024 & 2032
- Figure 15: North America Agarose Resin Market Revenue (Million), by Country 2024 & 2032
- Figure 16: North America Agarose Resin Market Volume (Billion), by Country 2024 & 2032
- Figure 17: North America Agarose Resin Market Revenue Share (%), by Country 2024 & 2032
- Figure 18: North America Agarose Resin Market Volume Share (%), by Country 2024 & 2032
- Figure 19: Europe Agarose Resin Market Revenue (Million), by Concentration 2024 & 2032
- Figure 20: Europe Agarose Resin Market Volume (Billion), by Concentration 2024 & 2032
- Figure 21: Europe Agarose Resin Market Revenue Share (%), by Concentration 2024 & 2032
- Figure 22: Europe Agarose Resin Market Volume Share (%), by Concentration 2024 & 2032
- Figure 23: Europe Agarose Resin Market Revenue (Million), by Application 2024 & 2032
- Figure 24: Europe Agarose Resin Market Volume (Billion), by Application 2024 & 2032
- Figure 25: Europe Agarose Resin Market Revenue Share (%), by Application 2024 & 2032
- Figure 26: Europe Agarose Resin Market Volume Share (%), by Application 2024 & 2032
- Figure 27: Europe Agarose Resin Market Revenue (Million), by End User 2024 & 2032
- Figure 28: Europe Agarose Resin Market Volume (Billion), by End User 2024 & 2032
- Figure 29: Europe Agarose Resin Market Revenue Share (%), by End User 2024 & 2032
- Figure 30: Europe Agarose Resin Market Volume Share (%), by End User 2024 & 2032
- Figure 31: Europe Agarose Resin Market Revenue (Million), by Country 2024 & 2032
- Figure 32: Europe Agarose Resin Market Volume (Billion), by Country 2024 & 2032
- Figure 33: Europe Agarose Resin Market Revenue Share (%), by Country 2024 & 2032
- Figure 34: Europe Agarose Resin Market Volume Share (%), by Country 2024 & 2032
- Figure 35: Asia Pacific Agarose Resin Market Revenue (Million), by Concentration 2024 & 2032
- Figure 36: Asia Pacific Agarose Resin Market Volume (Billion), by Concentration 2024 & 2032
- Figure 37: Asia Pacific Agarose Resin Market Revenue Share (%), by Concentration 2024 & 2032
- Figure 38: Asia Pacific Agarose Resin Market Volume Share (%), by Concentration 2024 & 2032
- Figure 39: Asia Pacific Agarose Resin Market Revenue (Million), by Application 2024 & 2032
- Figure 40: Asia Pacific Agarose Resin Market Volume (Billion), by Application 2024 & 2032
- Figure 41: Asia Pacific Agarose Resin Market Revenue Share (%), by Application 2024 & 2032
- Figure 42: Asia Pacific Agarose Resin Market Volume Share (%), by Application 2024 & 2032
- Figure 43: Asia Pacific Agarose Resin Market Revenue (Million), by End User 2024 & 2032
- Figure 44: Asia Pacific Agarose Resin Market Volume (Billion), by End User 2024 & 2032
- Figure 45: Asia Pacific Agarose Resin Market Revenue Share (%), by End User 2024 & 2032
- Figure 46: Asia Pacific Agarose Resin Market Volume Share (%), by End User 2024 & 2032
- Figure 47: Asia Pacific Agarose Resin Market Revenue (Million), by Country 2024 & 2032
- Figure 48: Asia Pacific Agarose Resin Market Volume (Billion), by Country 2024 & 2032
- Figure 49: Asia Pacific Agarose Resin Market Revenue Share (%), by Country 2024 & 2032
- Figure 50: Asia Pacific Agarose Resin Market Volume Share (%), by Country 2024 & 2032
- Figure 51: Middle East and Africa Agarose Resin Market Revenue (Million), by Concentration 2024 & 2032
- Figure 52: Middle East and Africa Agarose Resin Market Volume (Billion), by Concentration 2024 & 2032
- Figure 53: Middle East and Africa Agarose Resin Market Revenue Share (%), by Concentration 2024 & 2032
- Figure 54: Middle East and Africa Agarose Resin Market Volume Share (%), by Concentration 2024 & 2032
- Figure 55: Middle East and Africa Agarose Resin Market Revenue (Million), by Application 2024 & 2032
- Figure 56: Middle East and Africa Agarose Resin Market Volume (Billion), by Application 2024 & 2032
- Figure 57: Middle East and Africa Agarose Resin Market Revenue Share (%), by Application 2024 & 2032
- Figure 58: Middle East and Africa Agarose Resin Market Volume Share (%), by Application 2024 & 2032
- Figure 59: Middle East and Africa Agarose Resin Market Revenue (Million), by End User 2024 & 2032
- Figure 60: Middle East and Africa Agarose Resin Market Volume (Billion), by End User 2024 & 2032
- Figure 61: Middle East and Africa Agarose Resin Market Revenue Share (%), by End User 2024 & 2032
- Figure 62: Middle East and Africa Agarose Resin Market Volume Share (%), by End User 2024 & 2032
- Figure 63: Middle East and Africa Agarose Resin Market Revenue (Million), by Country 2024 & 2032
- Figure 64: Middle East and Africa Agarose Resin Market Volume (Billion), by Country 2024 & 2032
- Figure 65: Middle East and Africa Agarose Resin Market Revenue Share (%), by Country 2024 & 2032
- Figure 66: Middle East and Africa Agarose Resin Market Volume Share (%), by Country 2024 & 2032
- Figure 67: South America Agarose Resin Market Revenue (Million), by Concentration 2024 & 2032
- Figure 68: South America Agarose Resin Market Volume (Billion), by Concentration 2024 & 2032
- Figure 69: South America Agarose Resin Market Revenue Share (%), by Concentration 2024 & 2032
- Figure 70: South America Agarose Resin Market Volume Share (%), by Concentration 2024 & 2032
- Figure 71: South America Agarose Resin Market Revenue (Million), by Application 2024 & 2032
- Figure 72: South America Agarose Resin Market Volume (Billion), by Application 2024 & 2032
- Figure 73: South America Agarose Resin Market Revenue Share (%), by Application 2024 & 2032
- Figure 74: South America Agarose Resin Market Volume Share (%), by Application 2024 & 2032
- Figure 75: South America Agarose Resin Market Revenue (Million), by End User 2024 & 2032
- Figure 76: South America Agarose Resin Market Volume (Billion), by End User 2024 & 2032
- Figure 77: South America Agarose Resin Market Revenue Share (%), by End User 2024 & 2032
- Figure 78: South America Agarose Resin Market Volume Share (%), by End User 2024 & 2032
- Figure 79: South America Agarose Resin Market Revenue (Million), by Country 2024 & 2032
- Figure 80: South America Agarose Resin Market Volume (Billion), by Country 2024 & 2032
- Figure 81: South America Agarose Resin Market Revenue Share (%), by Country 2024 & 2032
- Figure 82: South America Agarose Resin Market Volume Share (%), by Country 2024 & 2032
List of Tables
- Table 1: Global Agarose Resin Market Revenue Million Forecast, by Region 2019 & 2032
- Table 2: Global Agarose Resin Market Volume Billion Forecast, by Region 2019 & 2032
- Table 3: Global Agarose Resin Market Revenue Million Forecast, by Concentration 2019 & 2032
- Table 4: Global Agarose Resin Market Volume Billion Forecast, by Concentration 2019 & 2032
- Table 5: Global Agarose Resin Market Revenue Million Forecast, by Application 2019 & 2032
- Table 6: Global Agarose Resin Market Volume Billion Forecast, by Application 2019 & 2032
- Table 7: Global Agarose Resin Market Revenue Million Forecast, by End User 2019 & 2032
- Table 8: Global Agarose Resin Market Volume Billion Forecast, by End User 2019 & 2032
- Table 9: Global Agarose Resin Market Revenue Million Forecast, by Region 2019 & 2032
- Table 10: Global Agarose Resin Market Volume Billion Forecast, by Region 2019 & 2032
- Table 11: Global Agarose Resin Market Revenue Million Forecast, by Concentration 2019 & 2032
- Table 12: Global Agarose Resin Market Volume Billion Forecast, by Concentration 2019 & 2032
- Table 13: Global Agarose Resin Market Revenue Million Forecast, by Application 2019 & 2032
- Table 14: Global Agarose Resin Market Volume Billion Forecast, by Application 2019 & 2032
- Table 15: Global Agarose Resin Market Revenue Million Forecast, by End User 2019 & 2032
- Table 16: Global Agarose Resin Market Volume Billion Forecast, by End User 2019 & 2032
- Table 17: Global Agarose Resin Market Revenue Million Forecast, by Country 2019 & 2032
- Table 18: Global Agarose Resin Market Volume Billion Forecast, by Country 2019 & 2032
- Table 19: United States Agarose Resin Market Revenue (Million) Forecast, by Application 2019 & 2032
- Table 20: United States Agarose Resin Market Volume (Billion) Forecast, by Application 2019 & 2032
- Table 21: Canada Agarose Resin Market Revenue (Million) Forecast, by Application 2019 & 2032
- Table 22: Canada Agarose Resin Market Volume (Billion) Forecast, by Application 2019 & 2032
- Table 23: Mexico Agarose Resin Market Revenue (Million) Forecast, by Application 2019 & 2032
- Table 24: Mexico Agarose Resin Market Volume (Billion) Forecast, by Application 2019 & 2032
- Table 25: Global Agarose Resin Market Revenue Million Forecast, by Concentration 2019 & 2032
- Table 26: Global Agarose Resin Market Volume Billion Forecast, by Concentration 2019 & 2032
- Table 27: Global Agarose Resin Market Revenue Million Forecast, by Application 2019 & 2032
- Table 28: Global Agarose Resin Market Volume Billion Forecast, by Application 2019 & 2032
- Table 29: Global Agarose Resin Market Revenue Million Forecast, by End User 2019 & 2032
- Table 30: Global Agarose Resin Market Volume Billion Forecast, by End User 2019 & 2032
- Table 31: Global Agarose Resin Market Revenue Million Forecast, by Country 2019 & 2032
- Table 32: Global Agarose Resin Market Volume Billion Forecast, by Country 2019 & 2032
- Table 33: Germany Agarose Resin Market Revenue (Million) Forecast, by Application 2019 & 2032
- Table 34: Germany Agarose Resin Market Volume (Billion) Forecast, by Application 2019 & 2032
- Table 35: United Kingdom Agarose Resin Market Revenue (Million) Forecast, by Application 2019 & 2032
- Table 36: United Kingdom Agarose Resin Market Volume (Billion) Forecast, by Application 2019 & 2032
- Table 37: France Agarose Resin Market Revenue (Million) Forecast, by Application 2019 & 2032
- Table 38: France Agarose Resin Market Volume (Billion) Forecast, by Application 2019 & 2032
- Table 39: Italy Agarose Resin Market Revenue (Million) Forecast, by Application 2019 & 2032
- Table 40: Italy Agarose Resin Market Volume (Billion) Forecast, by Application 2019 & 2032
- Table 41: Spain Agarose Resin Market Revenue (Million) Forecast, by Application 2019 & 2032
- Table 42: Spain Agarose Resin Market Volume (Billion) Forecast, by Application 2019 & 2032
- Table 43: Rest of Europe Agarose Resin Market Revenue (Million) Forecast, by Application 2019 & 2032
- Table 44: Rest of Europe Agarose Resin Market Volume (Billion) Forecast, by Application 2019 & 2032
- Table 45: Global Agarose Resin Market Revenue Million Forecast, by Concentration 2019 & 2032
- Table 46: Global Agarose Resin Market Volume Billion Forecast, by Concentration 2019 & 2032
- Table 47: Global Agarose Resin Market Revenue Million Forecast, by Application 2019 & 2032
- Table 48: Global Agarose Resin Market Volume Billion Forecast, by Application 2019 & 2032
- Table 49: Global Agarose Resin Market Revenue Million Forecast, by End User 2019 & 2032
- Table 50: Global Agarose Resin Market Volume Billion Forecast, by End User 2019 & 2032
- Table 51: Global Agarose Resin Market Revenue Million Forecast, by Country 2019 & 2032
- Table 52: Global Agarose Resin Market Volume Billion Forecast, by Country 2019 & 2032
- Table 53: China Agarose Resin Market Revenue (Million) Forecast, by Application 2019 & 2032
- Table 54: China Agarose Resin Market Volume (Billion) Forecast, by Application 2019 & 2032
- Table 55: Japan Agarose Resin Market Revenue (Million) Forecast, by Application 2019 & 2032
- Table 56: Japan Agarose Resin Market Volume (Billion) Forecast, by Application 2019 & 2032
- Table 57: India Agarose Resin Market Revenue (Million) Forecast, by Application 2019 & 2032
- Table 58: India Agarose Resin Market Volume (Billion) Forecast, by Application 2019 & 2032
- Table 59: Australia Agarose Resin Market Revenue (Million) Forecast, by Application 2019 & 2032
- Table 60: Australia Agarose Resin Market Volume (Billion) Forecast, by Application 2019 & 2032
- Table 61: South Korea Agarose Resin Market Revenue (Million) Forecast, by Application 2019 & 2032
- Table 62: South Korea Agarose Resin Market Volume (Billion) Forecast, by Application 2019 & 2032
- Table 63: Rest of Asia Pacific Agarose Resin Market Revenue (Million) Forecast, by Application 2019 & 2032
- Table 64: Rest of Asia Pacific Agarose Resin Market Volume (Billion) Forecast, by Application 2019 & 2032
- Table 65: Global Agarose Resin Market Revenue Million Forecast, by Concentration 2019 & 2032
- Table 66: Global Agarose Resin Market Volume Billion Forecast, by Concentration 2019 & 2032
- Table 67: Global Agarose Resin Market Revenue Million Forecast, by Application 2019 & 2032
- Table 68: Global Agarose Resin Market Volume Billion Forecast, by Application 2019 & 2032
- Table 69: Global Agarose Resin Market Revenue Million Forecast, by End User 2019 & 2032
- Table 70: Global Agarose Resin Market Volume Billion Forecast, by End User 2019 & 2032
- Table 71: Global Agarose Resin Market Revenue Million Forecast, by Country 2019 & 2032
- Table 72: Global Agarose Resin Market Volume Billion Forecast, by Country 2019 & 2032
- Table 73: GCC Agarose Resin Market Revenue (Million) Forecast, by Application 2019 & 2032
- Table 74: GCC Agarose Resin Market Volume (Billion) Forecast, by Application 2019 & 2032
- Table 75: South Africa Agarose Resin Market Revenue (Million) Forecast, by Application 2019 & 2032
- Table 76: South Africa Agarose Resin Market Volume (Billion) Forecast, by Application 2019 & 2032
- Table 77: Rest of Middle East and Africa Agarose Resin Market Revenue (Million) Forecast, by Application 2019 & 2032
- Table 78: Rest of Middle East and Africa Agarose Resin Market Volume (Billion) Forecast, by Application 2019 & 2032
- Table 79: Global Agarose Resin Market Revenue Million Forecast, by Concentration 2019 & 2032
- Table 80: Global Agarose Resin Market Volume Billion Forecast, by Concentration 2019 & 2032
- Table 81: Global Agarose Resin Market Revenue Million Forecast, by Application 2019 & 2032
- Table 82: Global Agarose Resin Market Volume Billion Forecast, by Application 2019 & 2032
- Table 83: Global Agarose Resin Market Revenue Million Forecast, by End User 2019 & 2032
- Table 84: Global Agarose Resin Market Volume Billion Forecast, by End User 2019 & 2032
- Table 85: Global Agarose Resin Market Revenue Million Forecast, by Country 2019 & 2032
- Table 86: Global Agarose Resin Market Volume Billion Forecast, by Country 2019 & 2032
- Table 87: Brazil Agarose Resin Market Revenue (Million) Forecast, by Application 2019 & 2032
- Table 88: Brazil Agarose Resin Market Volume (Billion) Forecast, by Application 2019 & 2032
- Table 89: Argentina Agarose Resin Market Revenue (Million) Forecast, by Application 2019 & 2032
- Table 90: Argentina Agarose Resin Market Volume (Billion) Forecast, by Application 2019 & 2032
- Table 91: Rest of South America Agarose Resin Market Revenue (Million) Forecast, by Application 2019 & 2032
- Table 92: Rest of South America Agarose Resin Market Volume (Billion) Forecast, by Application 2019 & 2032
Frequently Asked Questions
1. What is the projected Compound Annual Growth Rate (CAGR) of the Agarose Resin Market?
The projected CAGR is approximately 8.91%.
2. Which companies are prominent players in the Agarose Resin Market?
Key companies in the market include Ecolab Inc (Purolite), Takara Bio Inc, Bio-Rad Laboratories Inc, Cube Biotech Inc, Cytiva, Agarose Beads Technologies, Merck KGaA, Thermo Fisher Scientific Inc, Bio-Works, Tosoh Bioscience LLC, Repligen Corporation, Kaneka Corporation*List Not Exhaustive.
3. What are the main segments of the Agarose Resin Market?
The market segments include Concentration, Application, End User.
4. Can you provide details about the market size?
The market size is estimated to be USD 0.68 Million as of 2022.
5. What are some drivers contributing to market growth?
Rising Applications of Agarose Resin in Biopharmaceutical Industry; Surging Research and Development Activities.
6. What are the notable trends driving market growth?
Protein Purification Segment is Expected to Hold a Highest Share of the Market.
7. Are there any restraints impacting market growth?
Rising Applications of Agarose Resin in Biopharmaceutical Industry; Surging Research and Development Activities.
8. Can you provide examples of recent developments in the market?
In April 2024, Agarose Beads Technologies received halal certification for some of its agarose beads used in the biopharmaceutical and bioprocessing industries, ensuring a strong commitment to high quality and customer satisfaction.
9. What pricing options are available for accessing the report?
Pricing options include single-user, multi-user, and enterprise licenses priced at USD 4750, USD 5250, and USD 8750 respectively.
10. Is the market size provided in terms of value or volume?
The market size is provided in terms of value, measured in Million and volume, measured in Billion.
11. Are there any specific market keywords associated with the report?
Yes, the market keyword associated with the report is "Agarose Resin Market," which aids in identifying and referencing the specific market segment covered.
12. How do I determine which pricing option suits my needs best?
The pricing options vary based on user requirements and access needs. Individual users may opt for single-user licenses, while businesses requiring broader access may choose multi-user or enterprise licenses for cost-effective access to the report.
13. Are there any additional resources or data provided in the Agarose Resin Market report?
While the report offers comprehensive insights, it's advisable to review the specific contents or supplementary materials provided to ascertain if additional resources or data are available.
14. How can I stay updated on further developments or reports in the Agarose Resin Market?
To stay informed about further developments, trends, and reports in the Agarose Resin Market, consider subscribing to industry newsletters, following relevant companies and organizations, or regularly checking reputable industry news sources and publications.
Methodology
Step 1 - Identification of Relevant Samples Size from Population Database


Step 2 - Approaches for Defining Global Market Size (Value, Volume* & Price*)

Note*: In applicable scenarios
Step 3 - Data Sources
Primary Research
- Web Analytics
- Survey Reports
- Research Institute
- Latest Research Reports
- Opinion Leaders
Secondary Research
- Annual Reports
- White Paper
- Latest Press Release
- Industry Association
- Paid Database
- Investor Presentations

Step 4 - Data Triangulation
Involves using different sources of information in order to increase the validity of a study
These sources are likely to be stakeholders in a program - participants, other researchers, program staff, other community members, and so on.
Then we put all data in single framework & apply various statistical tools to find out the dynamic on the market.
During the analysis stage, feedback from the stakeholder groups would be compared to determine areas of agreement as well as areas of divergence
