

Key Insights
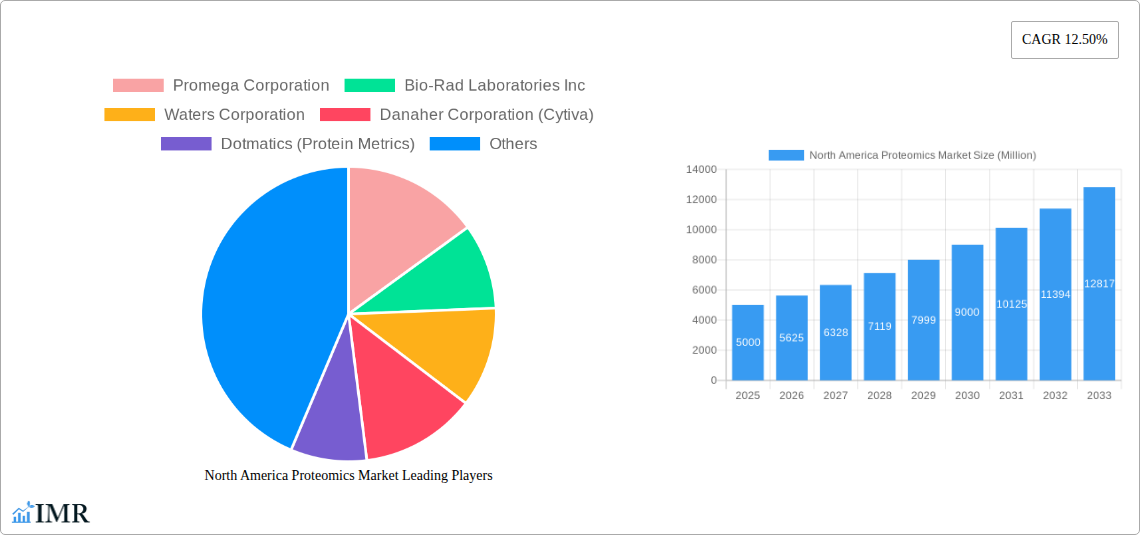
The North America proteomics market is projected for significant expansion, propelled by technological innovations in instrumentation and bioinformatics, alongside escalating demand in clinical diagnostics and drug discovery. The market is set to achieve a Compound Annual Growth Rate (CAGR) of 12.7%. This robust growth is underpinned by the rising incidence of chronic diseases, the increasing adoption of personalized medicine, and substantial R&D investments by pharmaceutical and biotechnology firms. Opportunities span instrumentation (mass spectrometry, chromatography), bioinformatics software and services, and essential reagents. Key industry players are driving progress through advanced technologies, strategic collaborations, and acquisitions, solidifying North America's leading position in the global proteomics landscape.
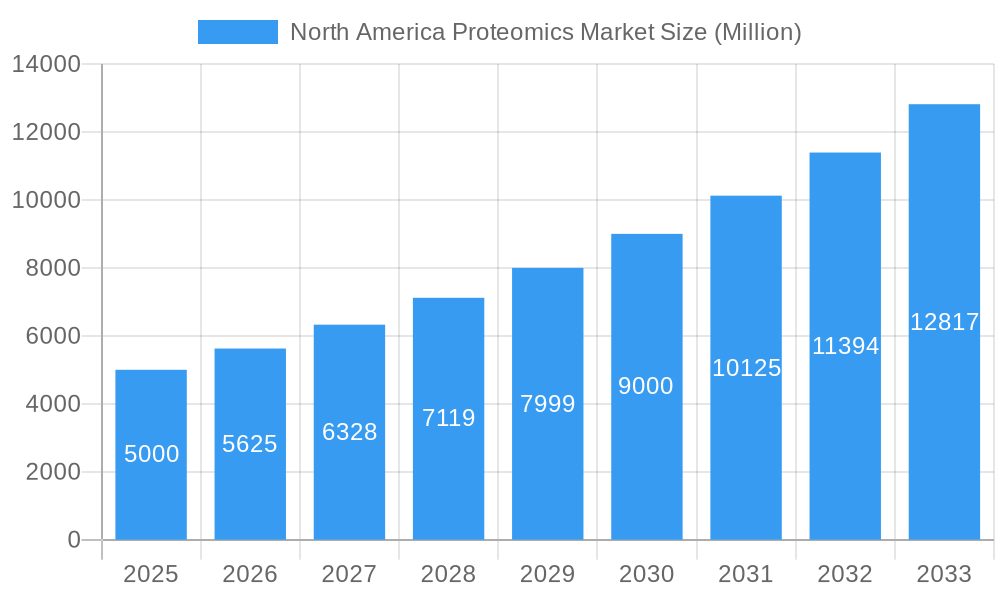
North America Proteomics Market Market Size (In Billion)
Favorable market conditions in North America include substantial governmental research funding, a supportive regulatory environment for clinical trials, and a highly skilled life sciences workforce. Despite challenges such as the high cost of sophisticated instrumentation and specialized data analysis expertise, the market's growth trajectory remains strong. Emerging applications in environmental monitoring and agricultural research offer additional avenues for expansion. Continuous improvements in mass spectrometry sensitivity and bioinformatics algorithms are expected to enhance accessibility and reduce costs, further fueling market growth. The market size is estimated at 14.11 billion in the base year of 2025, with strong growth anticipated through 2033.
North America Proteomics Market Company Market Share
North America Proteomics Market: A Comprehensive Market Report (2019-2033)
This comprehensive report provides an in-depth analysis of the North America proteomics market, encompassing market size, growth trends, competitive landscape, and future outlook. The study period covers 2019-2033, with 2025 as the base and estimated year. The report segments the market by Type (Instrumentation Technology, Other Instrumentation Technologies, Services and Software, Bioinformatics Software and Services, Reagents) and Application (Clinical Diagnostics, Drug Discovery, Other Applications), offering a granular understanding of this dynamic sector. Key players such as Promega Corporation, Bio-Rad Laboratories Inc., Waters Corporation, and Thermo Fisher Scientific Inc. are profiled, providing insights into their strategies and market positions. The report is invaluable for investors, industry professionals, and researchers seeking to navigate this rapidly evolving market. The market size is projected to reach xx Million by 2033.
North America Proteomics Market Dynamics & Structure
The North America proteomics market is characterized by a moderately concentrated landscape with several major players holding significant market share. Technological innovation, particularly in mass spectrometry and bioinformatics, is a key driver of growth. Stringent regulatory frameworks, especially concerning clinical diagnostics applications, influence market dynamics. Competitive pressures exist from alternative technologies and analytical approaches. The end-user base is diverse, spanning pharmaceutical companies, academic research institutions, and clinical diagnostic laboratories. Mergers and acquisitions (M&A) activity is relatively frequent, reflecting consolidation trends within the industry.
- Market Concentration: The top 5 players hold approximately xx% of the market share in 2025.
- Technological Innovation: Advancements in mass spectrometry, liquid chromatography, and bioinformatics tools are driving market expansion.
- Regulatory Landscape: FDA approvals and clinical trial requirements significantly impact the clinical diagnostics segment.
- Competitive Substitutes: Genomics and other omics technologies present competitive alternatives.
- M&A Activity: The number of M&A deals in the sector averaged xx per year during the historical period (2019-2024).
- Innovation Barriers: High R&D costs and the complexity of proteomic data analysis pose significant challenges to innovation.
North America Proteomics Market Growth Trends & Insights
The North America proteomics market experienced robust growth during the historical period (2019-2024), with a CAGR of xx%. This growth is attributed to the increasing adoption of proteomics technologies across various applications, particularly in drug discovery and clinical diagnostics. Technological advancements, including higher-throughput platforms and improved data analysis tools, have facilitated wider adoption. The market is witnessing a shift towards personalized medicine and targeted therapies, fueling demand for proteomics-based solutions. The increasing prevalence of chronic diseases further contributes to the growth of the clinical diagnostics segment. Market penetration of proteomics technologies in the drug discovery pipeline is steadily increasing.
Dominant Regions, Countries, or Segments in North America Proteomics Market
The United States dominates the North America proteomics market, accounting for the largest share due to factors such as robust research infrastructure, a high concentration of pharmaceutical and biotechnology companies, and significant government funding for research and development. Within the segments, the Instrumentation Technology segment holds the largest market share, followed by Services and Software. The Clinical Diagnostics and Drug Discovery applications are the primary revenue generators.
- United States Dominance: High concentration of research institutions, pharmaceutical companies, and funding for biomedical research.
- Instrumentation Technology Segment: High demand for advanced mass spectrometers, liquid chromatographs, and other proteomics instruments.
- Clinical Diagnostics Application: Growing adoption of proteomics in disease diagnosis and biomarker discovery.
- Drug Discovery Application: Rising demand for proteomics-based drug target identification and validation.
North America Proteomics Market Product Landscape
The North America proteomics market offers a diverse range of products including mass spectrometers, liquid chromatography systems, sample preparation kits, software for data analysis, and related services. Recent innovations focus on improved sensitivity, higher throughput, and user-friendly interfaces. Manufacturers are constantly striving to enhance the accuracy and speed of proteomic analysis, enabling researchers to obtain deeper insights into biological processes. The unique selling propositions often involve specialized functionalities, superior performance, or comprehensive software solutions.
Key Drivers, Barriers & Challenges in North America Proteomics Market
Key Drivers: Increasing demand for personalized medicine, advancements in mass spectrometry technology, rising prevalence of chronic diseases, growing investments in biomedical research.
Challenges: High cost of instrumentation and analysis, complexity of data analysis, need for skilled professionals, regulatory hurdles for clinical diagnostics applications, potential supply chain disruptions impacting reagent availability. The impact of these challenges can be quantified through reduced market penetration rates and slowed adoption in specific application areas. For example, supply chain issues may have reduced the market growth by xx% in 2024.
Emerging Opportunities in North America Proteomics Market
Emerging opportunities include the expansion of spatial proteomics, the integration of proteomics with other omics technologies (e.g., genomics, metabolomics), and the development of point-of-care diagnostic tools. Untapped markets in areas such as agricultural proteomics and environmental proteomics also present potential growth avenues. Growing interest in biomarker discovery for early disease detection is driving innovation in clinical diagnostics applications.
Growth Accelerators in the North America Proteomics Market Industry
Technological advancements, such as miniaturization of instruments and development of novel analytical techniques, are accelerating market growth. Strategic partnerships between instrument manufacturers, software developers, and research institutions facilitate innovation and market expansion. Government initiatives promoting biomedical research and the adoption of advanced diagnostic tools further propel market growth.
Key Players Shaping the North America Proteomics Market Market
Notable Milestones in North America Proteomics Market Sector
- May 2022: Ionpath received a strategic investment from Thermo Fisher Scientific to support spatial proteomics innovation.
- January 2023: Bruker made a majority-ownership investment in Biognosys, leading to plans for a new advanced US proteomics CRO facility.
In-Depth North America Proteomics Market Market Outlook
The North America proteomics market is poised for continued growth, driven by technological advancements, increasing research funding, and the rising adoption of proteomics in various applications. Strategic partnerships and collaborations are expected to play a crucial role in accelerating market expansion. The development of novel technologies and the integration of proteomics with other omics approaches will create new opportunities for growth in the years to come. The market is expected to witness significant expansion in areas such as personalized medicine, early disease diagnosis, and drug development.
North America Proteomics Market Segmentation
-
1. Type
-
1.1. Instrumentation Technology
- 1.1.1. Spectroscopy
- 1.1.2. Chromatography
- 1.1.3. Electrophoresis
- 1.1.4. Protein Microarrays
- 1.1.5. X-Ray Crystallography
- 1.1.6. Other Instrumentation Technologies
-
1.2. Services and Software
- 1.2.1. Core Proteomics Services
- 1.2.2. Bioinformatics Software and Services
- 1.3. Reagents
-
1.1. Instrumentation Technology
-
2. Application
- 2.1. Clinical Diagnostics
- 2.2. Drug Discovery
- 2.3. Other Applications
-
3. Geography
- 3.1. United States
- 3.2. Canada
- 3.3. Mexico
North America Proteomics Market Segmentation By Geography
- 1. United States
- 2. Canada
- 3. Mexico
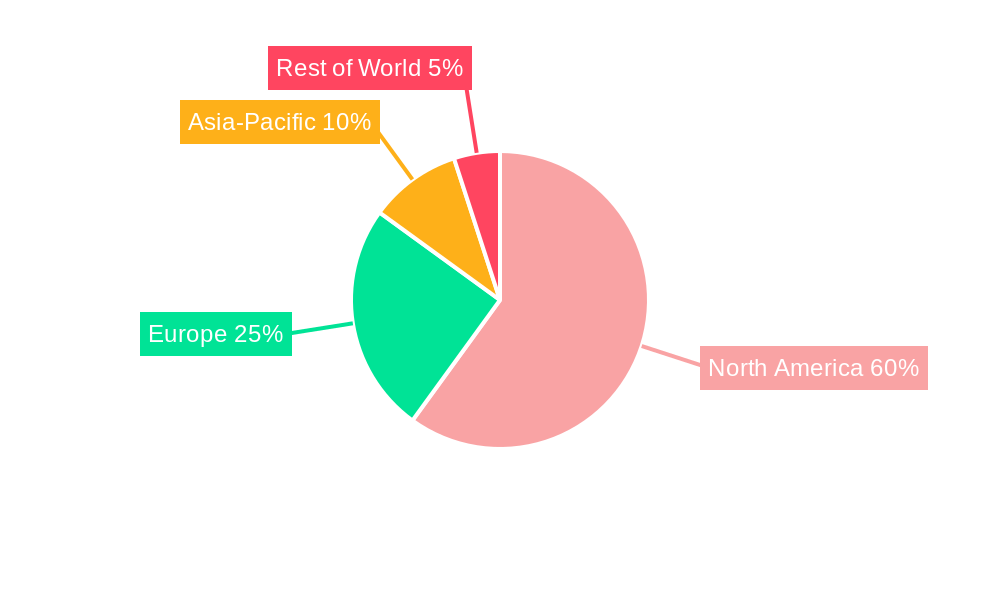
North America Proteomics Market Regional Market Share
Geographic Coverage of North America Proteomics Market
North America Proteomics Market REPORT HIGHLIGHTS
| Aspects | Details |
|---|---|
| Study Period | 2020-2034 |
| Base Year | 2025 |
| Estimated Year | 2026 |
| Forecast Period | 2026-2034 |
| Historical Period | 2020-2025 |
| Growth Rate | CAGR of 12.7% from 2020-2034 |
| Segmentation |
|
Table of Contents
- 1. Introduction
- 1.1. Research Scope
- 1.2. Market Segmentation
- 1.3. Research Objective
- 1.4. Definitions and Assumptions
- 2. Executive Summary
- 2.1. Market Snapshot
- 3. Market Dynamics
- 3.1. Market Drivers
- 3.2. Market Restrains
- 3.3. Market Trends
- 3.4. Market Opportunities
- 4. Market Factor Analysis
- 4.1. Porters Five Forces
- 4.1.1. Bargaining Power of Suppliers
- 4.1.2. Bargaining Power of Buyers
- 4.1.3. Threat of New Entrants
- 4.1.4. Threat of Substitutes
- 4.1.5. Competitive Rivalry
- 4.2. PESTEL analysis
- 4.3. BCG Analysis
- 4.3.1. Stars (High Growth, High Market Share)
- 4.3.2. Cash Cows (Low Growth, High Market Share)
- 4.3.3. Question Mark (High Growth, Low Market Share)
- 4.3.4. Dogs (Low Growth, Low Market Share)
- 4.4. Ansoff Matrix Analysis
- 4.5. Supply Chain Analysis
- 4.6. Regulatory Landscape
- 4.7. Current Market Potential and Opportunity Assessment (TAM–SAM–SOM Framework)
- 4.8. IMR Analyst Note
- 4.1. Porters Five Forces
- 5. Market Analysis, Insights and Forecast 2021-2033
- 5.1. Market Analysis, Insights and Forecast - by Type
- 5.1.1. Instrumentation Technology
- 5.1.1.1. Spectroscopy
- 5.1.1.2. Chromatography
- 5.1.1.3. Electrophoresis
- 5.1.1.4. Protein Microarrays
- 5.1.1.5. X-Ray Crystallography
- 5.1.1.6. Other Instrumentation Technologies
- 5.1.2. Services and Software
- 5.1.2.1. Core Proteomics Services
- 5.1.2.2. Bioinformatics Software and Services
- 5.1.3. Reagents
- 5.1.1. Instrumentation Technology
- 5.2. Market Analysis, Insights and Forecast - by Application
- 5.2.1. Clinical Diagnostics
- 5.2.2. Drug Discovery
- 5.2.3. Other Applications
- 5.3. Market Analysis, Insights and Forecast - by Geography
- 5.3.1. United States
- 5.3.2. Canada
- 5.3.3. Mexico
- 5.4. Market Analysis, Insights and Forecast - by Region
- 5.4.1. United States
- 5.4.2. Canada
- 5.4.3. Mexico
- 5.1. Market Analysis, Insights and Forecast - by Type
- 6. North America Proteomics Market Analysis, Insights and Forecast, 2021-2033
- 6.1. Market Analysis, Insights and Forecast - by Type
- 6.1.1. Instrumentation Technology
- 6.1.1.1. Spectroscopy
- 6.1.1.2. Chromatography
- 6.1.1.3. Electrophoresis
- 6.1.1.4. Protein Microarrays
- 6.1.1.5. X-Ray Crystallography
- 6.1.1.6. Other Instrumentation Technologies
- 6.1.2. Services and Software
- 6.1.2.1. Core Proteomics Services
- 6.1.2.2. Bioinformatics Software and Services
- 6.1.3. Reagents
- 6.1.1. Instrumentation Technology
- 6.2. Market Analysis, Insights and Forecast - by Application
- 6.2.1. Clinical Diagnostics
- 6.2.2. Drug Discovery
- 6.2.3. Other Applications
- 6.3. Market Analysis, Insights and Forecast - by Geography
- 6.3.1. United States
- 6.3.2. Canada
- 6.3.3. Mexico
- 6.1. Market Analysis, Insights and Forecast - by Type
- 7. United States North America Proteomics Market Analysis, Insights and Forecast, 2020-2032
- 7.1. Market Analysis, Insights and Forecast - by Type
- 7.1.1. Instrumentation Technology
- 7.1.1.1. Spectroscopy
- 7.1.1.2. Chromatography
- 7.1.1.3. Electrophoresis
- 7.1.1.4. Protein Microarrays
- 7.1.1.5. X-Ray Crystallography
- 7.1.1.6. Other Instrumentation Technologies
- 7.1.2. Services and Software
- 7.1.2.1. Core Proteomics Services
- 7.1.2.2. Bioinformatics Software and Services
- 7.1.3. Reagents
- 7.1.1. Instrumentation Technology
- 7.2. Market Analysis, Insights and Forecast - by Application
- 7.2.1. Clinical Diagnostics
- 7.2.2. Drug Discovery
- 7.2.3. Other Applications
- 7.3. Market Analysis, Insights and Forecast - by Geography
- 7.3.1. United States
- 7.3.2. Canada
- 7.3.3. Mexico
- 7.1. Market Analysis, Insights and Forecast - by Type
- 8. Canada North America Proteomics Market Analysis, Insights and Forecast, 2020-2032
- 8.1. Market Analysis, Insights and Forecast - by Type
- 8.1.1. Instrumentation Technology
- 8.1.1.1. Spectroscopy
- 8.1.1.2. Chromatography
- 8.1.1.3. Electrophoresis
- 8.1.1.4. Protein Microarrays
- 8.1.1.5. X-Ray Crystallography
- 8.1.1.6. Other Instrumentation Technologies
- 8.1.2. Services and Software
- 8.1.2.1. Core Proteomics Services
- 8.1.2.2. Bioinformatics Software and Services
- 8.1.3. Reagents
- 8.1.1. Instrumentation Technology
- 8.2. Market Analysis, Insights and Forecast - by Application
- 8.2.1. Clinical Diagnostics
- 8.2.2. Drug Discovery
- 8.2.3. Other Applications
- 8.3. Market Analysis, Insights and Forecast - by Geography
- 8.3.1. United States
- 8.3.2. Canada
- 8.3.3. Mexico
- 8.1. Market Analysis, Insights and Forecast - by Type
- 9. Mexico North America Proteomics Market Analysis, Insights and Forecast, 2020-2032
- 9.1. Market Analysis, Insights and Forecast - by Type
- 9.1.1. Instrumentation Technology
- 9.1.1.1. Spectroscopy
- 9.1.1.2. Chromatography
- 9.1.1.3. Electrophoresis
- 9.1.1.4. Protein Microarrays
- 9.1.1.5. X-Ray Crystallography
- 9.1.1.6. Other Instrumentation Technologies
- 9.1.2. Services and Software
- 9.1.2.1. Core Proteomics Services
- 9.1.2.2. Bioinformatics Software and Services
- 9.1.3. Reagents
- 9.1.1. Instrumentation Technology
- 9.2. Market Analysis, Insights and Forecast - by Application
- 9.2.1. Clinical Diagnostics
- 9.2.2. Drug Discovery
- 9.2.3. Other Applications
- 9.3. Market Analysis, Insights and Forecast - by Geography
- 9.3.1. United States
- 9.3.2. Canada
- 9.3.3. Mexico
- 9.1. Market Analysis, Insights and Forecast - by Type
- 10. Competitive Analysis
- 10.1. Company Profiles
- 10.1.1 Promega Corporation
- 10.1.1.1. Company Overview
- 10.1.1.2. Products
- 10.1.1.3. Company Financials
- 10.1.1.4. SWOT Analysis
- 10.1.2 Bio-Rad Laboratories Inc
- 10.1.2.1. Company Overview
- 10.1.2.2. Products
- 10.1.2.3. Company Financials
- 10.1.2.4. SWOT Analysis
- 10.1.3 Waters Corporation
- 10.1.3.1. Company Overview
- 10.1.3.2. Products
- 10.1.3.3. Company Financials
- 10.1.3.4. SWOT Analysis
- 10.1.4 Danaher Corporation (Cytiva)
- 10.1.4.1. Company Overview
- 10.1.4.2. Products
- 10.1.4.3. Company Financials
- 10.1.4.4. SWOT Analysis
- 10.1.5 Dotmatics (Protein Metrics)
- 10.1.5.1. Company Overview
- 10.1.5.2. Products
- 10.1.5.3. Company Financials
- 10.1.5.4. SWOT Analysis
- 10.1.6 Thermo Fisher Scientific Inc
- 10.1.6.1. Company Overview
- 10.1.6.2. Products
- 10.1.6.3. Company Financials
- 10.1.6.4. SWOT Analysis
- 10.1.7 Seer Inc
- 10.1.7.1. Company Overview
- 10.1.7.2. Products
- 10.1.7.3. Company Financials
- 10.1.7.4. SWOT Analysis
- 10.1.8 Merck KGaA (Sigma-Aldrich)
- 10.1.8.1. Company Overview
- 10.1.8.2. Products
- 10.1.8.3. Company Financials
- 10.1.8.4. SWOT Analysis
- 10.1.9 Agilent Technologies Inc
- 10.1.9.1. Company Overview
- 10.1.9.2. Products
- 10.1.9.3. Company Financials
- 10.1.9.4. SWOT Analysis
- 10.1.10 Creative Proteomics
- 10.1.10.1. Company Overview
- 10.1.10.2. Products
- 10.1.10.3. Company Financials
- 10.1.10.4. SWOT Analysis
- 10.1.11 Bruker Corporation
- 10.1.11.1. Company Overview
- 10.1.11.2. Products
- 10.1.11.3. Company Financials
- 10.1.11.4. SWOT Analysis
- 10.1.1 Promega Corporation
- 10.2. Market Entropy
- 10.2.1 Company's Key Areas Served
- 10.2.2 Recent Developments
- 10.3. Company Market Share Analysis 2025
- 10.3.1 Top 5 Companies Market Share Analysis
- 10.3.2 Top 3 Companies Market Share Analysis
- 10.4. List of Potential Customers
- 11. Research Methodology
List of Figures
- Figure 1: North America Proteomics Market Revenue Breakdown (billion, %) by Product 2025 & 2033
- Figure 2: North America Proteomics Market Share (%) by Company 2025
List of Tables
- Table 1: North America Proteomics Market Revenue billion Forecast, by Type 2020 & 2033
- Table 2: North America Proteomics Market Volume K Unit Forecast, by Type 2020 & 2033
- Table 3: North America Proteomics Market Revenue billion Forecast, by Application 2020 & 2033
- Table 4: North America Proteomics Market Volume K Unit Forecast, by Application 2020 & 2033
- Table 5: North America Proteomics Market Revenue billion Forecast, by Geography 2020 & 2033
- Table 6: North America Proteomics Market Volume K Unit Forecast, by Geography 2020 & 2033
- Table 7: North America Proteomics Market Revenue billion Forecast, by Region 2020 & 2033
- Table 8: North America Proteomics Market Volume K Unit Forecast, by Region 2020 & 2033
- Table 9: North America Proteomics Market Revenue billion Forecast, by Type 2020 & 2033
- Table 10: North America Proteomics Market Volume K Unit Forecast, by Type 2020 & 2033
- Table 11: North America Proteomics Market Revenue billion Forecast, by Application 2020 & 2033
- Table 12: North America Proteomics Market Volume K Unit Forecast, by Application 2020 & 2033
- Table 13: North America Proteomics Market Revenue billion Forecast, by Geography 2020 & 2033
- Table 14: North America Proteomics Market Volume K Unit Forecast, by Geography 2020 & 2033
- Table 15: North America Proteomics Market Revenue billion Forecast, by Country 2020 & 2033
- Table 16: North America Proteomics Market Volume K Unit Forecast, by Country 2020 & 2033
- Table 17: North America Proteomics Market Revenue billion Forecast, by Type 2020 & 2033
- Table 18: North America Proteomics Market Volume K Unit Forecast, by Type 2020 & 2033
- Table 19: North America Proteomics Market Revenue billion Forecast, by Application 2020 & 2033
- Table 20: North America Proteomics Market Volume K Unit Forecast, by Application 2020 & 2033
- Table 21: North America Proteomics Market Revenue billion Forecast, by Geography 2020 & 2033
- Table 22: North America Proteomics Market Volume K Unit Forecast, by Geography 2020 & 2033
- Table 23: North America Proteomics Market Revenue billion Forecast, by Country 2020 & 2033
- Table 24: North America Proteomics Market Volume K Unit Forecast, by Country 2020 & 2033
- Table 25: North America Proteomics Market Revenue billion Forecast, by Type 2020 & 2033
- Table 26: North America Proteomics Market Volume K Unit Forecast, by Type 2020 & 2033
- Table 27: North America Proteomics Market Revenue billion Forecast, by Application 2020 & 2033
- Table 28: North America Proteomics Market Volume K Unit Forecast, by Application 2020 & 2033
- Table 29: North America Proteomics Market Revenue billion Forecast, by Geography 2020 & 2033
- Table 30: North America Proteomics Market Volume K Unit Forecast, by Geography 2020 & 2033
- Table 31: North America Proteomics Market Revenue billion Forecast, by Country 2020 & 2033
- Table 32: North America Proteomics Market Volume K Unit Forecast, by Country 2020 & 2033
Frequently Asked Questions
1. What is the projected Compound Annual Growth Rate (CAGR) of the North America Proteomics Market?
The projected CAGR is approximately 12.7%.
2. Which companies are prominent players in the North America Proteomics Market?
Key companies in the market include Promega Corporation, Bio-Rad Laboratories Inc, Waters Corporation, Danaher Corporation (Cytiva), Dotmatics (Protein Metrics), Thermo Fisher Scientific Inc, Seer Inc , Merck KGaA (Sigma-Aldrich), Agilent Technologies Inc, Creative Proteomics, Bruker Corporation.
3. What are the main segments of the North America Proteomics Market?
The market segments include Type, Application, Geography.
4. Can you provide details about the market size?
The market size is estimated to be USD 14.11 billion as of 2022.
5. What are some drivers contributing to market growth?
Rising Demand for Personalized Medicine; Increasing R&D Expenditure and Government Funding for Proteomics; Technological Advancements.
6. What are the notable trends driving market growth?
Drug Discovery is Expected to Witness Highest CAGR in the Market Over the Forecast Period.
7. Are there any restraints impacting market growth?
High Cost of Instruments.
8. Can you provide examples of recent developments in the market?
January 2023: Bruker made a majority-ownership investment in Biognosys. With Bruker's investments, Biognosys plans to open advanced United States proteomics CRO facility for proteomics biomarker and drug discovery and development and pharmacoproteomics clinical trial support.
9. What pricing options are available for accessing the report?
Pricing options include single-user, multi-user, and enterprise licenses priced at USD 4750, USD 5250, and USD 8750 respectively.
10. Is the market size provided in terms of value or volume?
The market size is provided in terms of value, measured in billion and volume, measured in K Unit.
11. Are there any specific market keywords associated with the report?
Yes, the market keyword associated with the report is "North America Proteomics Market," which aids in identifying and referencing the specific market segment covered.
12. How do I determine which pricing option suits my needs best?
The pricing options vary based on user requirements and access needs. Individual users may opt for single-user licenses, while businesses requiring broader access may choose multi-user or enterprise licenses for cost-effective access to the report.
13. Are there any additional resources or data provided in the North America Proteomics Market report?
While the report offers comprehensive insights, it's advisable to review the specific contents or supplementary materials provided to ascertain if additional resources or data are available.
14. How can I stay updated on further developments or reports in the North America Proteomics Market?
To stay informed about further developments, trends, and reports in the North America Proteomics Market, consider subscribing to industry newsletters, following relevant companies and organizations, or regularly checking reputable industry news sources and publications.
Methodology
Step 1 - Identification of Relevant Samples Size from Population Database


Step 2 - Approaches for Defining Global Market Size (Value, Volume* & Price*)

Note*: In applicable scenarios
Step 3 - Data Sources
Primary Research
- Web Analytics
- Survey Reports
- Research Institute
- Latest Research Reports
- Opinion Leaders
Secondary Research
- Annual Reports
- White Paper
- Latest Press Release
- Industry Association
- Paid Database
- Investor Presentations

Step 4 - Data Triangulation
Involves using different sources of information in order to increase the validity of a study
These sources are likely to be stakeholders in a program - participants, other researchers, program staff, other community members, and so on.
Then we put all data in single framework & apply various statistical tools to find out the dynamic on the market.
During the analysis stage, feedback from the stakeholder groups would be compared to determine areas of agreement as well as areas of divergence