

Key Insights
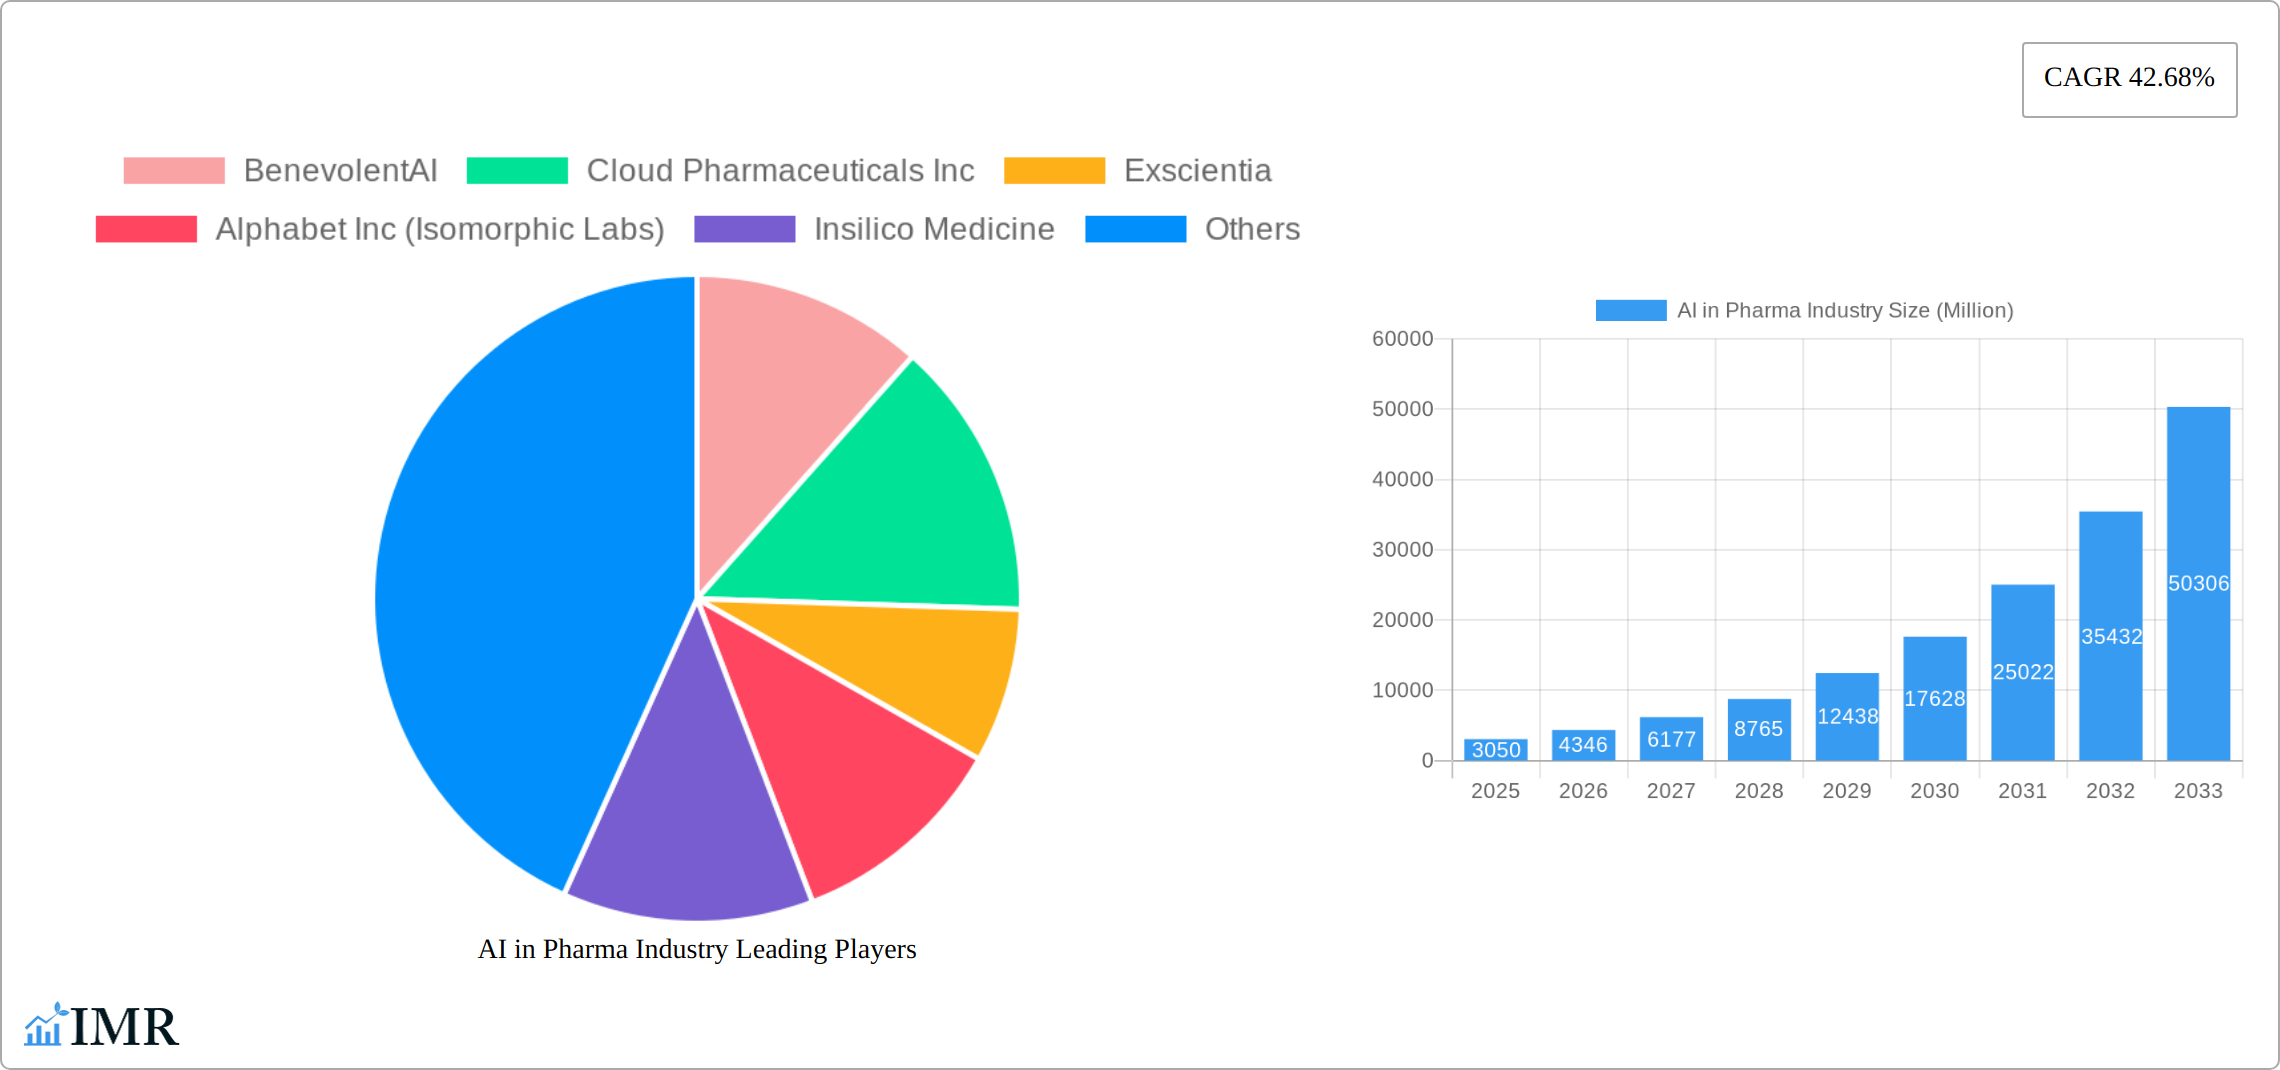
The AI in Pharma market is experiencing explosive growth, projected to reach \$3.05 billion in 2025 and exhibiting a remarkable Compound Annual Growth Rate (CAGR) of 42.68% from 2025 to 2033. This surge is driven by several key factors. Firstly, the increasing availability of large, high-quality datasets from clinical trials and genomic research provides the fuel for sophisticated AI algorithms. Secondly, advancements in machine learning, particularly deep learning and natural language processing, enable more accurate drug discovery, faster clinical trial design, and improved laboratory automation. Furthermore, the pharmaceutical industry faces immense pressure to reduce drug development costs and timelines, making AI-powered solutions increasingly attractive. The integration of AI is streamlining various stages of the drug development lifecycle, from target identification and lead optimization to clinical trial design and patient stratification. This translates to faster time-to-market for new therapies, ultimately benefiting patients.
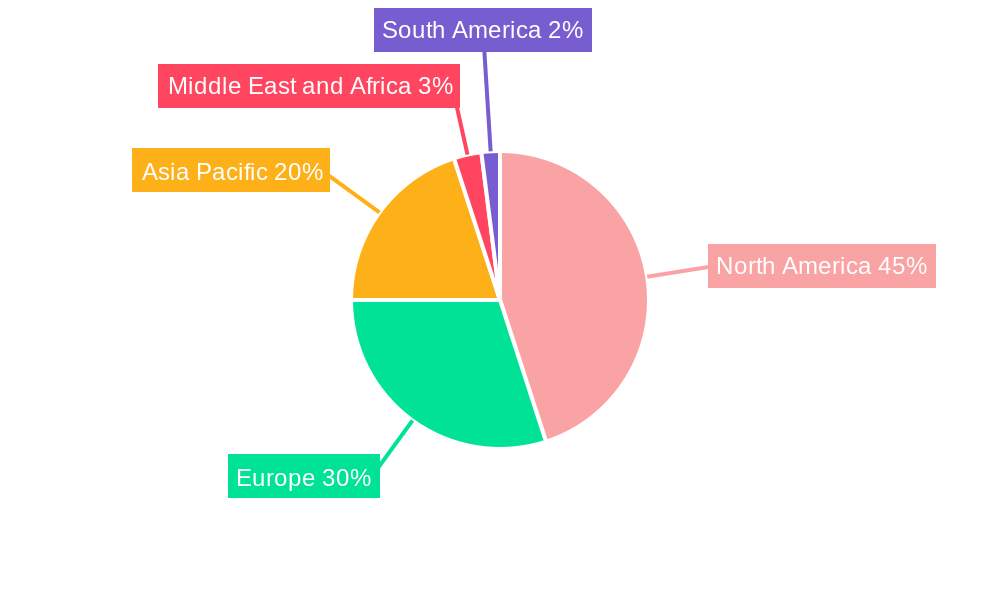
The market segmentation reveals several lucrative avenues for growth. Software solutions are currently dominant, but the services segment is also expanding rapidly as pharmaceutical companies seek expert assistance in implementing and optimizing AI technologies. Drug discovery currently represents the largest application area, but clinical trial optimization and laboratory automation are rapidly catching up. Leading players like BenevolentAI, Exscientia, and Insilico Medicine are at the forefront of innovation, driving competition and further propelling market expansion. Geographically, North America currently holds the largest market share due to established pharmaceutical infrastructure and robust investment in AI research. However, Asia-Pacific is projected to experience the fastest growth, fuelled by increasing R&D spending and government support in countries like China and India. The ongoing evolution of AI technologies and their expanding application within the pharmaceutical industry promise sustained and impressive growth throughout the forecast period.
This comprehensive report provides an in-depth analysis of the AI in Pharma Industry market, encompassing market dynamics, growth trends, regional dominance, product landscape, key players, and future outlook. The study period covers 2019-2033, with 2025 as the base and estimated year. The report analyzes the parent market (Pharmaceutical Industry) and its child market segments to offer a granular understanding of this rapidly evolving sector. Market size is presented in Million units.
AI in Pharma Industry Market Dynamics & Structure
The AI in Pharma Industry market, a sector valued at xx Million USD in 2024, demonstrates a moderately concentrated structure with several key players actively competing for market share. This dynamic landscape is primarily fueled by rapid technological innovation, driven by advancements in machine learning, deep learning, natural language processing (NLP), and other cutting-edge AI technologies. However, stringent regulatory frameworks, including data privacy regulations like GDPR and HIPAA, significantly influence adoption rates and timelines. Simultaneously, the market faces competitive pressures from both established traditional drug discovery methods and the emergence of novel technologies, necessitating continuous innovation and adaptation. The market is characterized by significant mergers and acquisitions (M&A) activity, with a focus on acquiring companies possessing advanced AI-driven drug discovery platforms and specialized expertise. The end-user base encompasses a broad spectrum of stakeholders, including major pharmaceutical companies, leading research institutions, and innovative biotechnology firms. The increasing adoption of AI across the drug development value chain is creating opportunities for growth.
- Market Concentration: Moderately concentrated, with the top 5 players holding approximately xx% of the global market share in 2024.
- Technological Innovation: Rapid advancements in machine learning, deep learning, and natural language processing are continuously accelerating innovation and pushing the boundaries of what's possible.
- Regulatory Landscape: Stringent regulatory approvals, data privacy concerns, and evolving compliance requirements pose substantial challenges to market expansion.
- Competitive Landscape: Intense competition exists not only among established pharmaceutical giants but also from agile and innovative AI startups entering the market.
- M&A Activity: xx M&A deals were concluded during the historical period (2019-2024), with an estimated xx deals projected for the forecast period (2025-2033), indicating a robust pace of consolidation.
- Innovation Barriers: High computational costs, the scarcity of high-quality, labeled datasets, and a shortage of skilled professionals with expertise in AI and drug discovery remain key obstacles to faster innovation.
AI in Pharma Industry Growth Trends & Insights
The AI in Pharma Industry market exhibits robust and sustained growth, driven by the accelerating adoption of AI-powered solutions across the entire drug development lifecycle. The market is projected to experience a significant Compound Annual Growth Rate (CAGR) of xx% during the forecast period (2025-2033), reaching an estimated xx Million USD by 2033. This impressive growth is fueled by several key factors: continuous technological advancements, substantial increases in R&D investments by both pharma companies and venture capitalists, and the ever-growing need for faster, more efficient, and cost-effective drug discovery and development processes. Adoption rates are particularly high in drug discovery and clinical trial optimization, significantly impacting both the speed and precision of medical breakthroughs. The market also shows a strong shift toward consumer-centric, AI-driven precision medicine approaches, creating opportunities for personalized treatments.
Dominant Regions, Countries, or Segments in AI in Pharma Industry
North America currently dominates the AI in Pharma Industry market, driven by strong R&D investments, the presence of key players, and supportive regulatory frameworks. Europe and Asia-Pacific are expected to witness significant growth in the coming years.
Dominant Segments:
- Technology: Machine learning holds the largest market share, followed by other technologies like natural language processing and computer vision.
- Type: Software solutions dominate the market, with a growing demand for AI-driven services.
- Application: Drug discovery accounts for the largest share of applications, followed by clinical trials and laboratory automation.
Key Drivers:
- North America: High R&D spending, presence of leading AI companies, and supportive government initiatives.
- Europe: Growing investments in AI research and development, collaborative efforts between academia and industry.
- Asia-Pacific: Rapid technological advancements, increasing healthcare expenditure, and growing adoption of AI technologies in emerging economies.
AI in Pharma Industry Product Landscape
The application of AI in the pharmaceutical industry encompasses a diverse range of products and services. These offerings span sophisticated software platforms designed for drug discovery and clinical trial management to advanced AI-driven analytics and insights platforms. These products leverage a variety of AI technologies, including machine learning, deep learning, NLP, and computer vision, to significantly accelerate drug development, enhance clinical trial outcomes, and optimize various laboratory processes. Key value propositions include demonstrably improved efficiency, substantial cost reductions, and accelerated time-to-market for new drugs and therapies. Ongoing technological advancements are focused on developing more accurate and robust AI models, seamlessly integrating diverse data sources, and improving the explainability and interpretability of AI-generated insights, fostering greater trust and transparency.
Key Drivers, Barriers & Challenges in AI in Pharma Industry
Key Drivers:
- Increased demand for faster and more efficient drug discovery.
- Rising R&D investments in AI-driven solutions.
- Growing adoption of AI in clinical trials and laboratory automation.
- Advancements in machine learning and deep learning algorithms.
- Government initiatives promoting AI adoption in healthcare.
Key Challenges and Restraints:
- High initial investment costs for AI infrastructure and software.
- Data privacy and security concerns.
- Lack of skilled professionals and expertise in AI and drug development.
- Regulatory hurdles and uncertainties surrounding AI-driven drug approvals.
- Competition from traditional drug discovery methods.
Emerging Opportunities in AI in Pharma Industry
Untapped markets include personalized medicine, diagnostics, and real-world evidence generation using AI. Emerging opportunities also lie in integrating AI with other technologies such as blockchain and IoT, developing more sophisticated AI models for drug repurposing, and utilizing AI for more efficient supply chain management.
Growth Accelerators in the AI in Pharma Industry Industry
Strategic partnerships between pharmaceutical companies and AI technology providers, along with increased R&D investments and technological breakthroughs in AI algorithms, are key growth accelerators. Expansion into new therapeutic areas and global markets also contribute to long-term market growth.
Key Players Shaping the AI in Pharma Industry Market
- BenevolentAI
- Cloud Pharmaceuticals Inc
- Exscientia
- Alphabet Inc (Isomorphic Labs)
- Insilico Medicine
- Atomwise Inc
- Deargen Inc
- XtalPi Inc
- Cyclica Inc
- Euretos
- Deep Genomics
- InveniAI LLC
Notable Milestones in AI in Pharma Industry Sector
- December 2022: Cyclica Inc and SK Chemicals Co., Ltd. partnered to develop AI-driven therapies.
- October 2022: Deerfield Management and BioSymetrics launched a joint venture to accelerate therapeutic advancements.
In-Depth AI in Pharma Industry Market Outlook
The future of the AI in Pharma Industry market is bright, driven by continued technological advancements, increased adoption across various applications, and the potential to revolutionize drug discovery and development. Strategic partnerships, acquisitions, and investments in research and development will be crucial to drive further growth and innovation. The market's expansion into untapped therapeutic areas and global markets presents lucrative opportunities for players in the field.
AI in Pharma Industry Segmentation
-
1. Technology
- 1.1. Machine Learning
- 1.2. Other Technologies
-
2. Type
- 2.1. Software
- 2.2. Services
-
3. Application
- 3.1. Drug Discovery
- 3.2. Clinical Trial
- 3.3. Laboratory Automation
- 3.4. Other Applications
AI in Pharma Industry Segmentation By Geography
-
1. North America
- 1.1. United States
- 1.2. Canada
- 1.3. Mexico
-
2. Europe
- 2.1. Germany
- 2.2. United Kingdom
- 2.3. France
- 2.4. Italy
- 2.5. Spain
- 2.6. Rest of Europe
-
3. Asia Pacific
- 3.1. China
- 3.2. Japan
- 3.3. India
- 3.4. Australia
- 3.5. South Korea
- 3.6. Rest of Asia Pacific
-
4. Middle East and Africa
- 4.1. GCC
- 4.2. South Africa
- 4.3. Rest of Middle East and Africa
-
5. South America
- 5.1. Brazil
- 5.2. Argentina
- 5.3. Rest of South America
AI in Pharma Industry REPORT HIGHLIGHTS
| Aspects | Details |
|---|---|
| Study Period | 2019-2033 |
| Base Year | 2024 |
| Estimated Year | 2025 |
| Forecast Period | 2025-2033 |
| Historical Period | 2019-2024 |
| Growth Rate | CAGR of 42.68% from 2019-2033 |
| Segmentation |
|
Table of Contents
- 1. Introduction
- 1.1. Research Scope
- 1.2. Market Segmentation
- 1.3. Research Methodology
- 1.4. Definitions and Assumptions
- 2. Executive Summary
- 2.1. Introduction
- 3. Market Dynamics
- 3.1. Introduction
- 3.2. Market Drivers
- 3.2.1. Growing Number of Cross-industry Collaborations and Partnerships; Surge In Adoption of Artificial Intelligence (AI) for Clinical Trials; Increasing Need to Reduce Drug Discovery & Development Costs and Timelines
- 3.3. Market Restrains
- 3.3.1. Inadequate Availability of Skilled Professionals; Incompatible Healthcare IT Infrastructure
- 3.4. Market Trends
- 3.4.1. Drug Discovery Segment is Expected to Witness Significant Growth in the Market Over the Forecast Period
- 4. Market Factor Analysis
- 4.1. Porters Five Forces
- 4.2. Supply/Value Chain
- 4.3. PESTEL analysis
- 4.4. Market Entropy
- 4.5. Patent/Trademark Analysis
- 5. Global AI in Pharma Industry Analysis, Insights and Forecast, 2019-2031
- 5.1. Market Analysis, Insights and Forecast - by Technology
- 5.1.1. Machine Learning
- 5.1.2. Other Technologies
- 5.2. Market Analysis, Insights and Forecast - by Type
- 5.2.1. Software
- 5.2.2. Services
- 5.3. Market Analysis, Insights and Forecast - by Application
- 5.3.1. Drug Discovery
- 5.3.2. Clinical Trial
- 5.3.3. Laboratory Automation
- 5.3.4. Other Applications
- 5.4. Market Analysis, Insights and Forecast - by Region
- 5.4.1. North America
- 5.4.2. Europe
- 5.4.3. Asia Pacific
- 5.4.4. Middle East and Africa
- 5.4.5. South America
- 5.1. Market Analysis, Insights and Forecast - by Technology
- 6. North America AI in Pharma Industry Analysis, Insights and Forecast, 2019-2031
- 6.1. Market Analysis, Insights and Forecast - by Technology
- 6.1.1. Machine Learning
- 6.1.2. Other Technologies
- 6.2. Market Analysis, Insights and Forecast - by Type
- 6.2.1. Software
- 6.2.2. Services
- 6.3. Market Analysis, Insights and Forecast - by Application
- 6.3.1. Drug Discovery
- 6.3.2. Clinical Trial
- 6.3.3. Laboratory Automation
- 6.3.4. Other Applications
- 6.1. Market Analysis, Insights and Forecast - by Technology
- 7. Europe AI in Pharma Industry Analysis, Insights and Forecast, 2019-2031
- 7.1. Market Analysis, Insights and Forecast - by Technology
- 7.1.1. Machine Learning
- 7.1.2. Other Technologies
- 7.2. Market Analysis, Insights and Forecast - by Type
- 7.2.1. Software
- 7.2.2. Services
- 7.3. Market Analysis, Insights and Forecast - by Application
- 7.3.1. Drug Discovery
- 7.3.2. Clinical Trial
- 7.3.3. Laboratory Automation
- 7.3.4. Other Applications
- 7.1. Market Analysis, Insights and Forecast - by Technology
- 8. Asia Pacific AI in Pharma Industry Analysis, Insights and Forecast, 2019-2031
- 8.1. Market Analysis, Insights and Forecast - by Technology
- 8.1.1. Machine Learning
- 8.1.2. Other Technologies
- 8.2. Market Analysis, Insights and Forecast - by Type
- 8.2.1. Software
- 8.2.2. Services
- 8.3. Market Analysis, Insights and Forecast - by Application
- 8.3.1. Drug Discovery
- 8.3.2. Clinical Trial
- 8.3.3. Laboratory Automation
- 8.3.4. Other Applications
- 8.1. Market Analysis, Insights and Forecast - by Technology
- 9. Middle East and Africa AI in Pharma Industry Analysis, Insights and Forecast, 2019-2031
- 9.1. Market Analysis, Insights and Forecast - by Technology
- 9.1.1. Machine Learning
- 9.1.2. Other Technologies
- 9.2. Market Analysis, Insights and Forecast - by Type
- 9.2.1. Software
- 9.2.2. Services
- 9.3. Market Analysis, Insights and Forecast - by Application
- 9.3.1. Drug Discovery
- 9.3.2. Clinical Trial
- 9.3.3. Laboratory Automation
- 9.3.4. Other Applications
- 9.1. Market Analysis, Insights and Forecast - by Technology
- 10. South America AI in Pharma Industry Analysis, Insights and Forecast, 2019-2031
- 10.1. Market Analysis, Insights and Forecast - by Technology
- 10.1.1. Machine Learning
- 10.1.2. Other Technologies
- 10.2. Market Analysis, Insights and Forecast - by Type
- 10.2.1. Software
- 10.2.2. Services
- 10.3. Market Analysis, Insights and Forecast - by Application
- 10.3.1. Drug Discovery
- 10.3.2. Clinical Trial
- 10.3.3. Laboratory Automation
- 10.3.4. Other Applications
- 10.1. Market Analysis, Insights and Forecast - by Technology
- 11. North America AI in Pharma Industry Analysis, Insights and Forecast, 2019-2031
- 11.1. Market Analysis, Insights and Forecast - By Country/Sub-region
- 11.1.1 United States
- 11.1.2 Canada
- 11.1.3 Mexico
- 12. Europe AI in Pharma Industry Analysis, Insights and Forecast, 2019-2031
- 12.1. Market Analysis, Insights and Forecast - By Country/Sub-region
- 12.1.1 Germany
- 12.1.2 United Kingdom
- 12.1.3 France
- 12.1.4 Italy
- 12.1.5 Spain
- 12.1.6 Rest of Europe
- 13. Asia Pacific AI in Pharma Industry Analysis, Insights and Forecast, 2019-2031
- 13.1. Market Analysis, Insights and Forecast - By Country/Sub-region
- 13.1.1 China
- 13.1.2 Japan
- 13.1.3 India
- 13.1.4 Australia
- 13.1.5 South Korea
- 13.1.6 Rest of Asia Pacific
- 14. Middle East and Africa AI in Pharma Industry Analysis, Insights and Forecast, 2019-2031
- 14.1. Market Analysis, Insights and Forecast - By Country/Sub-region
- 14.1.1 GCC
- 14.1.2 South Africa
- 14.1.3 Rest of Middle East and Africa
- 15. South America AI in Pharma Industry Analysis, Insights and Forecast, 2019-2031
- 15.1. Market Analysis, Insights and Forecast - By Country/Sub-region
- 15.1.1 Brazil
- 15.1.2 Argentina
- 15.1.3 Rest of South America
- 16. Competitive Analysis
- 16.1. Global Market Share Analysis 2024
- 16.2. Company Profiles
- 16.2.1 BenevolentAI
- 16.2.1.1. Overview
- 16.2.1.2. Products
- 16.2.1.3. SWOT Analysis
- 16.2.1.4. Recent Developments
- 16.2.1.5. Financials (Based on Availability)
- 16.2.2 Cloud Pharmaceuticals Inc
- 16.2.2.1. Overview
- 16.2.2.2. Products
- 16.2.2.3. SWOT Analysis
- 16.2.2.4. Recent Developments
- 16.2.2.5. Financials (Based on Availability)
- 16.2.3 Exscientia
- 16.2.3.1. Overview
- 16.2.3.2. Products
- 16.2.3.3. SWOT Analysis
- 16.2.3.4. Recent Developments
- 16.2.3.5. Financials (Based on Availability)
- 16.2.4 Alphabet Inc (Isomorphic Labs)
- 16.2.4.1. Overview
- 16.2.4.2. Products
- 16.2.4.3. SWOT Analysis
- 16.2.4.4. Recent Developments
- 16.2.4.5. Financials (Based on Availability)
- 16.2.5 Insilico Medicine
- 16.2.5.1. Overview
- 16.2.5.2. Products
- 16.2.5.3. SWOT Analysis
- 16.2.5.4. Recent Developments
- 16.2.5.5. Financials (Based on Availability)
- 16.2.6 Atomwise Inc
- 16.2.6.1. Overview
- 16.2.6.2. Products
- 16.2.6.3. SWOT Analysis
- 16.2.6.4. Recent Developments
- 16.2.6.5. Financials (Based on Availability)
- 16.2.7 Deargen Inc
- 16.2.7.1. Overview
- 16.2.7.2. Products
- 16.2.7.3. SWOT Analysis
- 16.2.7.4. Recent Developments
- 16.2.7.5. Financials (Based on Availability)
- 16.2.8 XtalPi Inc
- 16.2.8.1. Overview
- 16.2.8.2. Products
- 16.2.8.3. SWOT Analysis
- 16.2.8.4. Recent Developments
- 16.2.8.5. Financials (Based on Availability)
- 16.2.9 Cyclica Inc
- 16.2.9.1. Overview
- 16.2.9.2. Products
- 16.2.9.3. SWOT Analysis
- 16.2.9.4. Recent Developments
- 16.2.9.5. Financials (Based on Availability)
- 16.2.10 Euretos
- 16.2.10.1. Overview
- 16.2.10.2. Products
- 16.2.10.3. SWOT Analysis
- 16.2.10.4. Recent Developments
- 16.2.10.5. Financials (Based on Availability)
- 16.2.11 Deep Genomics
- 16.2.11.1. Overview
- 16.2.11.2. Products
- 16.2.11.3. SWOT Analysis
- 16.2.11.4. Recent Developments
- 16.2.11.5. Financials (Based on Availability)
- 16.2.12 InveniAI LLC
- 16.2.12.1. Overview
- 16.2.12.2. Products
- 16.2.12.3. SWOT Analysis
- 16.2.12.4. Recent Developments
- 16.2.12.5. Financials (Based on Availability)
- 16.2.1 BenevolentAI
List of Figures
- Figure 1: Global AI in Pharma Industry Revenue Breakdown (Million, %) by Region 2024 & 2032
- Figure 2: Global AI in Pharma Industry Volume Breakdown (K Unit, %) by Region 2024 & 2032
- Figure 3: North America AI in Pharma Industry Revenue (Million), by Country 2024 & 2032
- Figure 4: North America AI in Pharma Industry Volume (K Unit), by Country 2024 & 2032
- Figure 5: North America AI in Pharma Industry Revenue Share (%), by Country 2024 & 2032
- Figure 6: North America AI in Pharma Industry Volume Share (%), by Country 2024 & 2032
- Figure 7: Europe AI in Pharma Industry Revenue (Million), by Country 2024 & 2032
- Figure 8: Europe AI in Pharma Industry Volume (K Unit), by Country 2024 & 2032
- Figure 9: Europe AI in Pharma Industry Revenue Share (%), by Country 2024 & 2032
- Figure 10: Europe AI in Pharma Industry Volume Share (%), by Country 2024 & 2032
- Figure 11: Asia Pacific AI in Pharma Industry Revenue (Million), by Country 2024 & 2032
- Figure 12: Asia Pacific AI in Pharma Industry Volume (K Unit), by Country 2024 & 2032
- Figure 13: Asia Pacific AI in Pharma Industry Revenue Share (%), by Country 2024 & 2032
- Figure 14: Asia Pacific AI in Pharma Industry Volume Share (%), by Country 2024 & 2032
- Figure 15: Middle East and Africa AI in Pharma Industry Revenue (Million), by Country 2024 & 2032
- Figure 16: Middle East and Africa AI in Pharma Industry Volume (K Unit), by Country 2024 & 2032
- Figure 17: Middle East and Africa AI in Pharma Industry Revenue Share (%), by Country 2024 & 2032
- Figure 18: Middle East and Africa AI in Pharma Industry Volume Share (%), by Country 2024 & 2032
- Figure 19: South America AI in Pharma Industry Revenue (Million), by Country 2024 & 2032
- Figure 20: South America AI in Pharma Industry Volume (K Unit), by Country 2024 & 2032
- Figure 21: South America AI in Pharma Industry Revenue Share (%), by Country 2024 & 2032
- Figure 22: South America AI in Pharma Industry Volume Share (%), by Country 2024 & 2032
- Figure 23: North America AI in Pharma Industry Revenue (Million), by Technology 2024 & 2032
- Figure 24: North America AI in Pharma Industry Volume (K Unit), by Technology 2024 & 2032
- Figure 25: North America AI in Pharma Industry Revenue Share (%), by Technology 2024 & 2032
- Figure 26: North America AI in Pharma Industry Volume Share (%), by Technology 2024 & 2032
- Figure 27: North America AI in Pharma Industry Revenue (Million), by Type 2024 & 2032
- Figure 28: North America AI in Pharma Industry Volume (K Unit), by Type 2024 & 2032
- Figure 29: North America AI in Pharma Industry Revenue Share (%), by Type 2024 & 2032
- Figure 30: North America AI in Pharma Industry Volume Share (%), by Type 2024 & 2032
- Figure 31: North America AI in Pharma Industry Revenue (Million), by Application 2024 & 2032
- Figure 32: North America AI in Pharma Industry Volume (K Unit), by Application 2024 & 2032
- Figure 33: North America AI in Pharma Industry Revenue Share (%), by Application 2024 & 2032
- Figure 34: North America AI in Pharma Industry Volume Share (%), by Application 2024 & 2032
- Figure 35: North America AI in Pharma Industry Revenue (Million), by Country 2024 & 2032
- Figure 36: North America AI in Pharma Industry Volume (K Unit), by Country 2024 & 2032
- Figure 37: North America AI in Pharma Industry Revenue Share (%), by Country 2024 & 2032
- Figure 38: North America AI in Pharma Industry Volume Share (%), by Country 2024 & 2032
- Figure 39: Europe AI in Pharma Industry Revenue (Million), by Technology 2024 & 2032
- Figure 40: Europe AI in Pharma Industry Volume (K Unit), by Technology 2024 & 2032
- Figure 41: Europe AI in Pharma Industry Revenue Share (%), by Technology 2024 & 2032
- Figure 42: Europe AI in Pharma Industry Volume Share (%), by Technology 2024 & 2032
- Figure 43: Europe AI in Pharma Industry Revenue (Million), by Type 2024 & 2032
- Figure 44: Europe AI in Pharma Industry Volume (K Unit), by Type 2024 & 2032
- Figure 45: Europe AI in Pharma Industry Revenue Share (%), by Type 2024 & 2032
- Figure 46: Europe AI in Pharma Industry Volume Share (%), by Type 2024 & 2032
- Figure 47: Europe AI in Pharma Industry Revenue (Million), by Application 2024 & 2032
- Figure 48: Europe AI in Pharma Industry Volume (K Unit), by Application 2024 & 2032
- Figure 49: Europe AI in Pharma Industry Revenue Share (%), by Application 2024 & 2032
- Figure 50: Europe AI in Pharma Industry Volume Share (%), by Application 2024 & 2032
- Figure 51: Europe AI in Pharma Industry Revenue (Million), by Country 2024 & 2032
- Figure 52: Europe AI in Pharma Industry Volume (K Unit), by Country 2024 & 2032
- Figure 53: Europe AI in Pharma Industry Revenue Share (%), by Country 2024 & 2032
- Figure 54: Europe AI in Pharma Industry Volume Share (%), by Country 2024 & 2032
- Figure 55: Asia Pacific AI in Pharma Industry Revenue (Million), by Technology 2024 & 2032
- Figure 56: Asia Pacific AI in Pharma Industry Volume (K Unit), by Technology 2024 & 2032
- Figure 57: Asia Pacific AI in Pharma Industry Revenue Share (%), by Technology 2024 & 2032
- Figure 58: Asia Pacific AI in Pharma Industry Volume Share (%), by Technology 2024 & 2032
- Figure 59: Asia Pacific AI in Pharma Industry Revenue (Million), by Type 2024 & 2032
- Figure 60: Asia Pacific AI in Pharma Industry Volume (K Unit), by Type 2024 & 2032
- Figure 61: Asia Pacific AI in Pharma Industry Revenue Share (%), by Type 2024 & 2032
- Figure 62: Asia Pacific AI in Pharma Industry Volume Share (%), by Type 2024 & 2032
- Figure 63: Asia Pacific AI in Pharma Industry Revenue (Million), by Application 2024 & 2032
- Figure 64: Asia Pacific AI in Pharma Industry Volume (K Unit), by Application 2024 & 2032
- Figure 65: Asia Pacific AI in Pharma Industry Revenue Share (%), by Application 2024 & 2032
- Figure 66: Asia Pacific AI in Pharma Industry Volume Share (%), by Application 2024 & 2032
- Figure 67: Asia Pacific AI in Pharma Industry Revenue (Million), by Country 2024 & 2032
- Figure 68: Asia Pacific AI in Pharma Industry Volume (K Unit), by Country 2024 & 2032
- Figure 69: Asia Pacific AI in Pharma Industry Revenue Share (%), by Country 2024 & 2032
- Figure 70: Asia Pacific AI in Pharma Industry Volume Share (%), by Country 2024 & 2032
- Figure 71: Middle East and Africa AI in Pharma Industry Revenue (Million), by Technology 2024 & 2032
- Figure 72: Middle East and Africa AI in Pharma Industry Volume (K Unit), by Technology 2024 & 2032
- Figure 73: Middle East and Africa AI in Pharma Industry Revenue Share (%), by Technology 2024 & 2032
- Figure 74: Middle East and Africa AI in Pharma Industry Volume Share (%), by Technology 2024 & 2032
- Figure 75: Middle East and Africa AI in Pharma Industry Revenue (Million), by Type 2024 & 2032
- Figure 76: Middle East and Africa AI in Pharma Industry Volume (K Unit), by Type 2024 & 2032
- Figure 77: Middle East and Africa AI in Pharma Industry Revenue Share (%), by Type 2024 & 2032
- Figure 78: Middle East and Africa AI in Pharma Industry Volume Share (%), by Type 2024 & 2032
- Figure 79: Middle East and Africa AI in Pharma Industry Revenue (Million), by Application 2024 & 2032
- Figure 80: Middle East and Africa AI in Pharma Industry Volume (K Unit), by Application 2024 & 2032
- Figure 81: Middle East and Africa AI in Pharma Industry Revenue Share (%), by Application 2024 & 2032
- Figure 82: Middle East and Africa AI in Pharma Industry Volume Share (%), by Application 2024 & 2032
- Figure 83: Middle East and Africa AI in Pharma Industry Revenue (Million), by Country 2024 & 2032
- Figure 84: Middle East and Africa AI in Pharma Industry Volume (K Unit), by Country 2024 & 2032
- Figure 85: Middle East and Africa AI in Pharma Industry Revenue Share (%), by Country 2024 & 2032
- Figure 86: Middle East and Africa AI in Pharma Industry Volume Share (%), by Country 2024 & 2032
- Figure 87: South America AI in Pharma Industry Revenue (Million), by Technology 2024 & 2032
- Figure 88: South America AI in Pharma Industry Volume (K Unit), by Technology 2024 & 2032
- Figure 89: South America AI in Pharma Industry Revenue Share (%), by Technology 2024 & 2032
- Figure 90: South America AI in Pharma Industry Volume Share (%), by Technology 2024 & 2032
- Figure 91: South America AI in Pharma Industry Revenue (Million), by Type 2024 & 2032
- Figure 92: South America AI in Pharma Industry Volume (K Unit), by Type 2024 & 2032
- Figure 93: South America AI in Pharma Industry Revenue Share (%), by Type 2024 & 2032
- Figure 94: South America AI in Pharma Industry Volume Share (%), by Type 2024 & 2032
- Figure 95: South America AI in Pharma Industry Revenue (Million), by Application 2024 & 2032
- Figure 96: South America AI in Pharma Industry Volume (K Unit), by Application 2024 & 2032
- Figure 97: South America AI in Pharma Industry Revenue Share (%), by Application 2024 & 2032
- Figure 98: South America AI in Pharma Industry Volume Share (%), by Application 2024 & 2032
- Figure 99: South America AI in Pharma Industry Revenue (Million), by Country 2024 & 2032
- Figure 100: South America AI in Pharma Industry Volume (K Unit), by Country 2024 & 2032
- Figure 101: South America AI in Pharma Industry Revenue Share (%), by Country 2024 & 2032
- Figure 102: South America AI in Pharma Industry Volume Share (%), by Country 2024 & 2032
List of Tables
- Table 1: Global AI in Pharma Industry Revenue Million Forecast, by Region 2019 & 2032
- Table 2: Global AI in Pharma Industry Volume K Unit Forecast, by Region 2019 & 2032
- Table 3: Global AI in Pharma Industry Revenue Million Forecast, by Technology 2019 & 2032
- Table 4: Global AI in Pharma Industry Volume K Unit Forecast, by Technology 2019 & 2032
- Table 5: Global AI in Pharma Industry Revenue Million Forecast, by Type 2019 & 2032
- Table 6: Global AI in Pharma Industry Volume K Unit Forecast, by Type 2019 & 2032
- Table 7: Global AI in Pharma Industry Revenue Million Forecast, by Application 2019 & 2032
- Table 8: Global AI in Pharma Industry Volume K Unit Forecast, by Application 2019 & 2032
- Table 9: Global AI in Pharma Industry Revenue Million Forecast, by Region 2019 & 2032
- Table 10: Global AI in Pharma Industry Volume K Unit Forecast, by Region 2019 & 2032
- Table 11: Global AI in Pharma Industry Revenue Million Forecast, by Country 2019 & 2032
- Table 12: Global AI in Pharma Industry Volume K Unit Forecast, by Country 2019 & 2032
- Table 13: United States AI in Pharma Industry Revenue (Million) Forecast, by Application 2019 & 2032
- Table 14: United States AI in Pharma Industry Volume (K Unit) Forecast, by Application 2019 & 2032
- Table 15: Canada AI in Pharma Industry Revenue (Million) Forecast, by Application 2019 & 2032
- Table 16: Canada AI in Pharma Industry Volume (K Unit) Forecast, by Application 2019 & 2032
- Table 17: Mexico AI in Pharma Industry Revenue (Million) Forecast, by Application 2019 & 2032
- Table 18: Mexico AI in Pharma Industry Volume (K Unit) Forecast, by Application 2019 & 2032
- Table 19: Global AI in Pharma Industry Revenue Million Forecast, by Country 2019 & 2032
- Table 20: Global AI in Pharma Industry Volume K Unit Forecast, by Country 2019 & 2032
- Table 21: Germany AI in Pharma Industry Revenue (Million) Forecast, by Application 2019 & 2032
- Table 22: Germany AI in Pharma Industry Volume (K Unit) Forecast, by Application 2019 & 2032
- Table 23: United Kingdom AI in Pharma Industry Revenue (Million) Forecast, by Application 2019 & 2032
- Table 24: United Kingdom AI in Pharma Industry Volume (K Unit) Forecast, by Application 2019 & 2032
- Table 25: France AI in Pharma Industry Revenue (Million) Forecast, by Application 2019 & 2032
- Table 26: France AI in Pharma Industry Volume (K Unit) Forecast, by Application 2019 & 2032
- Table 27: Italy AI in Pharma Industry Revenue (Million) Forecast, by Application 2019 & 2032
- Table 28: Italy AI in Pharma Industry Volume (K Unit) Forecast, by Application 2019 & 2032
- Table 29: Spain AI in Pharma Industry Revenue (Million) Forecast, by Application 2019 & 2032
- Table 30: Spain AI in Pharma Industry Volume (K Unit) Forecast, by Application 2019 & 2032
- Table 31: Rest of Europe AI in Pharma Industry Revenue (Million) Forecast, by Application 2019 & 2032
- Table 32: Rest of Europe AI in Pharma Industry Volume (K Unit) Forecast, by Application 2019 & 2032
- Table 33: Global AI in Pharma Industry Revenue Million Forecast, by Country 2019 & 2032
- Table 34: Global AI in Pharma Industry Volume K Unit Forecast, by Country 2019 & 2032
- Table 35: China AI in Pharma Industry Revenue (Million) Forecast, by Application 2019 & 2032
- Table 36: China AI in Pharma Industry Volume (K Unit) Forecast, by Application 2019 & 2032
- Table 37: Japan AI in Pharma Industry Revenue (Million) Forecast, by Application 2019 & 2032
- Table 38: Japan AI in Pharma Industry Volume (K Unit) Forecast, by Application 2019 & 2032
- Table 39: India AI in Pharma Industry Revenue (Million) Forecast, by Application 2019 & 2032
- Table 40: India AI in Pharma Industry Volume (K Unit) Forecast, by Application 2019 & 2032
- Table 41: Australia AI in Pharma Industry Revenue (Million) Forecast, by Application 2019 & 2032
- Table 42: Australia AI in Pharma Industry Volume (K Unit) Forecast, by Application 2019 & 2032
- Table 43: South Korea AI in Pharma Industry Revenue (Million) Forecast, by Application 2019 & 2032
- Table 44: South Korea AI in Pharma Industry Volume (K Unit) Forecast, by Application 2019 & 2032
- Table 45: Rest of Asia Pacific AI in Pharma Industry Revenue (Million) Forecast, by Application 2019 & 2032
- Table 46: Rest of Asia Pacific AI in Pharma Industry Volume (K Unit) Forecast, by Application 2019 & 2032
- Table 47: Global AI in Pharma Industry Revenue Million Forecast, by Country 2019 & 2032
- Table 48: Global AI in Pharma Industry Volume K Unit Forecast, by Country 2019 & 2032
- Table 49: GCC AI in Pharma Industry Revenue (Million) Forecast, by Application 2019 & 2032
- Table 50: GCC AI in Pharma Industry Volume (K Unit) Forecast, by Application 2019 & 2032
- Table 51: South Africa AI in Pharma Industry Revenue (Million) Forecast, by Application 2019 & 2032
- Table 52: South Africa AI in Pharma Industry Volume (K Unit) Forecast, by Application 2019 & 2032
- Table 53: Rest of Middle East and Africa AI in Pharma Industry Revenue (Million) Forecast, by Application 2019 & 2032
- Table 54: Rest of Middle East and Africa AI in Pharma Industry Volume (K Unit) Forecast, by Application 2019 & 2032
- Table 55: Global AI in Pharma Industry Revenue Million Forecast, by Country 2019 & 2032
- Table 56: Global AI in Pharma Industry Volume K Unit Forecast, by Country 2019 & 2032
- Table 57: Brazil AI in Pharma Industry Revenue (Million) Forecast, by Application 2019 & 2032
- Table 58: Brazil AI in Pharma Industry Volume (K Unit) Forecast, by Application 2019 & 2032
- Table 59: Argentina AI in Pharma Industry Revenue (Million) Forecast, by Application 2019 & 2032
- Table 60: Argentina AI in Pharma Industry Volume (K Unit) Forecast, by Application 2019 & 2032
- Table 61: Rest of South America AI in Pharma Industry Revenue (Million) Forecast, by Application 2019 & 2032
- Table 62: Rest of South America AI in Pharma Industry Volume (K Unit) Forecast, by Application 2019 & 2032
- Table 63: Global AI in Pharma Industry Revenue Million Forecast, by Technology 2019 & 2032
- Table 64: Global AI in Pharma Industry Volume K Unit Forecast, by Technology 2019 & 2032
- Table 65: Global AI in Pharma Industry Revenue Million Forecast, by Type 2019 & 2032
- Table 66: Global AI in Pharma Industry Volume K Unit Forecast, by Type 2019 & 2032
- Table 67: Global AI in Pharma Industry Revenue Million Forecast, by Application 2019 & 2032
- Table 68: Global AI in Pharma Industry Volume K Unit Forecast, by Application 2019 & 2032
- Table 69: Global AI in Pharma Industry Revenue Million Forecast, by Country 2019 & 2032
- Table 70: Global AI in Pharma Industry Volume K Unit Forecast, by Country 2019 & 2032
- Table 71: United States AI in Pharma Industry Revenue (Million) Forecast, by Application 2019 & 2032
- Table 72: United States AI in Pharma Industry Volume (K Unit) Forecast, by Application 2019 & 2032
- Table 73: Canada AI in Pharma Industry Revenue (Million) Forecast, by Application 2019 & 2032
- Table 74: Canada AI in Pharma Industry Volume (K Unit) Forecast, by Application 2019 & 2032
- Table 75: Mexico AI in Pharma Industry Revenue (Million) Forecast, by Application 2019 & 2032
- Table 76: Mexico AI in Pharma Industry Volume (K Unit) Forecast, by Application 2019 & 2032
- Table 77: Global AI in Pharma Industry Revenue Million Forecast, by Technology 2019 & 2032
- Table 78: Global AI in Pharma Industry Volume K Unit Forecast, by Technology 2019 & 2032
- Table 79: Global AI in Pharma Industry Revenue Million Forecast, by Type 2019 & 2032
- Table 80: Global AI in Pharma Industry Volume K Unit Forecast, by Type 2019 & 2032
- Table 81: Global AI in Pharma Industry Revenue Million Forecast, by Application 2019 & 2032
- Table 82: Global AI in Pharma Industry Volume K Unit Forecast, by Application 2019 & 2032
- Table 83: Global AI in Pharma Industry Revenue Million Forecast, by Country 2019 & 2032
- Table 84: Global AI in Pharma Industry Volume K Unit Forecast, by Country 2019 & 2032
- Table 85: Germany AI in Pharma Industry Revenue (Million) Forecast, by Application 2019 & 2032
- Table 86: Germany AI in Pharma Industry Volume (K Unit) Forecast, by Application 2019 & 2032
- Table 87: United Kingdom AI in Pharma Industry Revenue (Million) Forecast, by Application 2019 & 2032
- Table 88: United Kingdom AI in Pharma Industry Volume (K Unit) Forecast, by Application 2019 & 2032
- Table 89: France AI in Pharma Industry Revenue (Million) Forecast, by Application 2019 & 2032
- Table 90: France AI in Pharma Industry Volume (K Unit) Forecast, by Application 2019 & 2032
- Table 91: Italy AI in Pharma Industry Revenue (Million) Forecast, by Application 2019 & 2032
- Table 92: Italy AI in Pharma Industry Volume (K Unit) Forecast, by Application 2019 & 2032
- Table 93: Spain AI in Pharma Industry Revenue (Million) Forecast, by Application 2019 & 2032
- Table 94: Spain AI in Pharma Industry Volume (K Unit) Forecast, by Application 2019 & 2032
- Table 95: Rest of Europe AI in Pharma Industry Revenue (Million) Forecast, by Application 2019 & 2032
- Table 96: Rest of Europe AI in Pharma Industry Volume (K Unit) Forecast, by Application 2019 & 2032
- Table 97: Global AI in Pharma Industry Revenue Million Forecast, by Technology 2019 & 2032
- Table 98: Global AI in Pharma Industry Volume K Unit Forecast, by Technology 2019 & 2032
- Table 99: Global AI in Pharma Industry Revenue Million Forecast, by Type 2019 & 2032
- Table 100: Global AI in Pharma Industry Volume K Unit Forecast, by Type 2019 & 2032
- Table 101: Global AI in Pharma Industry Revenue Million Forecast, by Application 2019 & 2032
- Table 102: Global AI in Pharma Industry Volume K Unit Forecast, by Application 2019 & 2032
- Table 103: Global AI in Pharma Industry Revenue Million Forecast, by Country 2019 & 2032
- Table 104: Global AI in Pharma Industry Volume K Unit Forecast, by Country 2019 & 2032
- Table 105: China AI in Pharma Industry Revenue (Million) Forecast, by Application 2019 & 2032
- Table 106: China AI in Pharma Industry Volume (K Unit) Forecast, by Application 2019 & 2032
- Table 107: Japan AI in Pharma Industry Revenue (Million) Forecast, by Application 2019 & 2032
- Table 108: Japan AI in Pharma Industry Volume (K Unit) Forecast, by Application 2019 & 2032
- Table 109: India AI in Pharma Industry Revenue (Million) Forecast, by Application 2019 & 2032
- Table 110: India AI in Pharma Industry Volume (K Unit) Forecast, by Application 2019 & 2032
- Table 111: Australia AI in Pharma Industry Revenue (Million) Forecast, by Application 2019 & 2032
- Table 112: Australia AI in Pharma Industry Volume (K Unit) Forecast, by Application 2019 & 2032
- Table 113: South Korea AI in Pharma Industry Revenue (Million) Forecast, by Application 2019 & 2032
- Table 114: South Korea AI in Pharma Industry Volume (K Unit) Forecast, by Application 2019 & 2032
- Table 115: Rest of Asia Pacific AI in Pharma Industry Revenue (Million) Forecast, by Application 2019 & 2032
- Table 116: Rest of Asia Pacific AI in Pharma Industry Volume (K Unit) Forecast, by Application 2019 & 2032
- Table 117: Global AI in Pharma Industry Revenue Million Forecast, by Technology 2019 & 2032
- Table 118: Global AI in Pharma Industry Volume K Unit Forecast, by Technology 2019 & 2032
- Table 119: Global AI in Pharma Industry Revenue Million Forecast, by Type 2019 & 2032
- Table 120: Global AI in Pharma Industry Volume K Unit Forecast, by Type 2019 & 2032
- Table 121: Global AI in Pharma Industry Revenue Million Forecast, by Application 2019 & 2032
- Table 122: Global AI in Pharma Industry Volume K Unit Forecast, by Application 2019 & 2032
- Table 123: Global AI in Pharma Industry Revenue Million Forecast, by Country 2019 & 2032
- Table 124: Global AI in Pharma Industry Volume K Unit Forecast, by Country 2019 & 2032
- Table 125: GCC AI in Pharma Industry Revenue (Million) Forecast, by Application 2019 & 2032
- Table 126: GCC AI in Pharma Industry Volume (K Unit) Forecast, by Application 2019 & 2032
- Table 127: South Africa AI in Pharma Industry Revenue (Million) Forecast, by Application 2019 & 2032
- Table 128: South Africa AI in Pharma Industry Volume (K Unit) Forecast, by Application 2019 & 2032
- Table 129: Rest of Middle East and Africa AI in Pharma Industry Revenue (Million) Forecast, by Application 2019 & 2032
- Table 130: Rest of Middle East and Africa AI in Pharma Industry Volume (K Unit) Forecast, by Application 2019 & 2032
- Table 131: Global AI in Pharma Industry Revenue Million Forecast, by Technology 2019 & 2032
- Table 132: Global AI in Pharma Industry Volume K Unit Forecast, by Technology 2019 & 2032
- Table 133: Global AI in Pharma Industry Revenue Million Forecast, by Type 2019 & 2032
- Table 134: Global AI in Pharma Industry Volume K Unit Forecast, by Type 2019 & 2032
- Table 135: Global AI in Pharma Industry Revenue Million Forecast, by Application 2019 & 2032
- Table 136: Global AI in Pharma Industry Volume K Unit Forecast, by Application 2019 & 2032
- Table 137: Global AI in Pharma Industry Revenue Million Forecast, by Country 2019 & 2032
- Table 138: Global AI in Pharma Industry Volume K Unit Forecast, by Country 2019 & 2032
- Table 139: Brazil AI in Pharma Industry Revenue (Million) Forecast, by Application 2019 & 2032
- Table 140: Brazil AI in Pharma Industry Volume (K Unit) Forecast, by Application 2019 & 2032
- Table 141: Argentina AI in Pharma Industry Revenue (Million) Forecast, by Application 2019 & 2032
- Table 142: Argentina AI in Pharma Industry Volume (K Unit) Forecast, by Application 2019 & 2032
- Table 143: Rest of South America AI in Pharma Industry Revenue (Million) Forecast, by Application 2019 & 2032
- Table 144: Rest of South America AI in Pharma Industry Volume (K Unit) Forecast, by Application 2019 & 2032
Frequently Asked Questions
1. What is the projected Compound Annual Growth Rate (CAGR) of the AI in Pharma Industry?
The projected CAGR is approximately 42.68%.
2. Which companies are prominent players in the AI in Pharma Industry?
Key companies in the market include BenevolentAI, Cloud Pharmaceuticals Inc, Exscientia, Alphabet Inc (Isomorphic Labs), Insilico Medicine, Atomwise Inc, Deargen Inc, XtalPi Inc, Cyclica Inc, Euretos, Deep Genomics, InveniAI LLC.
3. What are the main segments of the AI in Pharma Industry?
The market segments include Technology, Type, Application.
4. Can you provide details about the market size?
The market size is estimated to be USD 3.05 Million as of 2022.
5. What are some drivers contributing to market growth?
Growing Number of Cross-industry Collaborations and Partnerships; Surge In Adoption of Artificial Intelligence (AI) for Clinical Trials; Increasing Need to Reduce Drug Discovery & Development Costs and Timelines.
6. What are the notable trends driving market growth?
Drug Discovery Segment is Expected to Witness Significant Growth in the Market Over the Forecast Period.
7. Are there any restraints impacting market growth?
Inadequate Availability of Skilled Professionals; Incompatible Healthcare IT Infrastructure.
8. Can you provide examples of recent developments in the market?
December 2022: Cyclica Inc and SK Chemicals Co., Ltd. entered an artificial intelligence (AI)-driven drug discovery and development partnership to develop therapies across a range of disease areas. Under the collaboration with SK Chemicals, Cyclica will deploy its robust, proprietary drug discovery platforms to identify novel drug candidates for challenging biological targets across therapeutic areas of mutual interest to Cyclica and SK Chemicals.
9. What pricing options are available for accessing the report?
Pricing options include single-user, multi-user, and enterprise licenses priced at USD 4750, USD 5250, and USD 8750 respectively.
10. Is the market size provided in terms of value or volume?
The market size is provided in terms of value, measured in Million and volume, measured in K Unit.
11. Are there any specific market keywords associated with the report?
Yes, the market keyword associated with the report is "AI in Pharma Industry," which aids in identifying and referencing the specific market segment covered.
12. How do I determine which pricing option suits my needs best?
The pricing options vary based on user requirements and access needs. Individual users may opt for single-user licenses, while businesses requiring broader access may choose multi-user or enterprise licenses for cost-effective access to the report.
13. Are there any additional resources or data provided in the AI in Pharma Industry report?
While the report offers comprehensive insights, it's advisable to review the specific contents or supplementary materials provided to ascertain if additional resources or data are available.
14. How can I stay updated on further developments or reports in the AI in Pharma Industry?
To stay informed about further developments, trends, and reports in the AI in Pharma Industry, consider subscribing to industry newsletters, following relevant companies and organizations, or regularly checking reputable industry news sources and publications.
Methodology
Step 1 - Identification of Relevant Samples Size from Population Database


Step 2 - Approaches for Defining Global Market Size (Value, Volume* & Price*)

Note*: In applicable scenarios
Step 3 - Data Sources
Primary Research
- Web Analytics
- Survey Reports
- Research Institute
- Latest Research Reports
- Opinion Leaders
Secondary Research
- Annual Reports
- White Paper
- Latest Press Release
- Industry Association
- Paid Database
- Investor Presentations

Step 4 - Data Triangulation
Involves using different sources of information in order to increase the validity of a study
These sources are likely to be stakeholders in a program - participants, other researchers, program staff, other community members, and so on.
Then we put all data in single framework & apply various statistical tools to find out the dynamic on the market.
During the analysis stage, feedback from the stakeholder groups would be compared to determine areas of agreement as well as areas of divergence
