

Key Insights
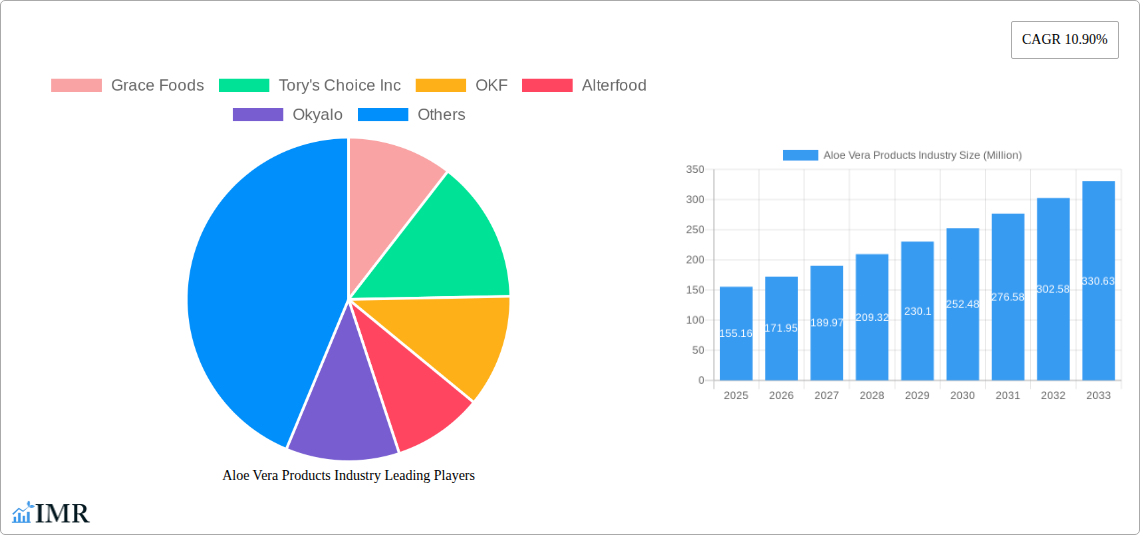
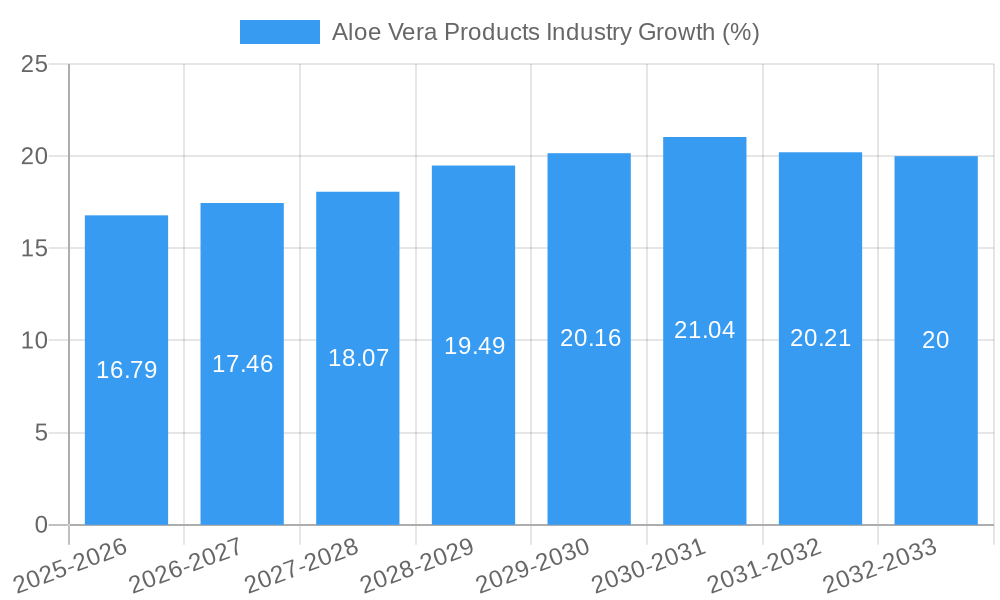
The global aloe vera products market, valued at $155.16 million in 2025, is projected to experience robust growth, driven by a compound annual growth rate (CAGR) of 10.90% from 2025 to 2033. This expansion is fueled by several key factors. The rising consumer awareness of aloe vera's health benefits, particularly its soothing properties for skin and its digestive health advantages, is a primary driver. Growing demand for natural and organic products further contributes to market growth, as aloe vera aligns perfectly with this trend. The increasing prevalence of skin conditions and digestive issues globally also creates significant market opportunities. Product diversification, with offerings ranging from hot and bottled drinks to juice concentrates and aloe vera water, caters to diverse consumer preferences and expands market reach. The distribution channels are also evolving, with online retail supplementing traditional supermarkets, convenience stores, and specialty stores, ensuring wider accessibility. While competitive pressures exist among established and emerging players, the overall market landscape is characterized by innovation and expansion, particularly in product formulations and marketing strategies targeting specific health concerns.
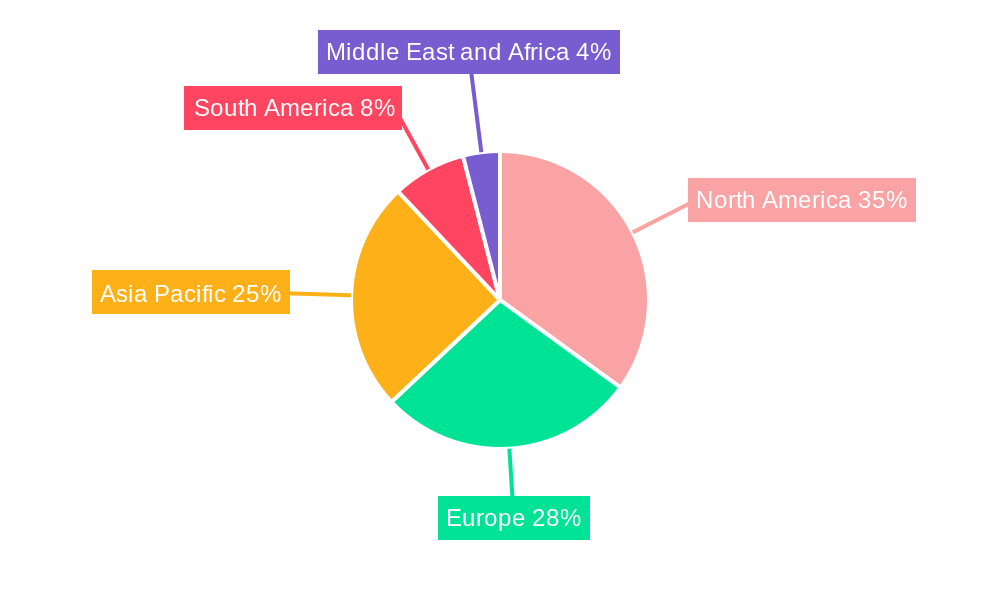
The market segmentation reveals key insights into consumer preferences and distribution strategies. The bottled drinks segment likely holds a significant market share due to its convenience and widespread appeal. However, the juice concentrate and aloe vera water segments are poised for strong growth driven by the increasing demand for healthier beverage alternatives. Regarding distribution, supermarkets and hypermarkets likely represent the largest segment, but online retail is expected to show significant growth, mirroring broader e-commerce trends. Geographically, North America and Europe are expected to remain leading markets, with the Asia-Pacific region showing significant potential for future expansion given its increasing health-conscious population and rising disposable incomes. This presents significant opportunities for companies to adapt their product offerings and marketing campaigns to meet the specific needs and preferences of regional consumers.
Aloe Vera Products Industry: A Comprehensive Market Report (2019-2033)
This comprehensive report provides a detailed analysis of the Aloe Vera Products industry, encompassing market dynamics, growth trends, regional performance, product landscape, key players, and future outlook. The study period spans 2019-2033, with 2025 serving as the base and estimated year. The report is essential for industry professionals, investors, and anyone seeking a deep understanding of this dynamic market. The parent market is the beverage industry and the child market is the functional beverage industry specifically focusing on aloe vera products.
Aloe Vera Products Industry Market Dynamics & Structure
The global Aloe Vera Products market, valued at xx Million units in 2024, is characterized by moderate concentration, with several key players and numerous smaller regional brands competing. Technological innovation, particularly in processing and packaging to enhance shelf life and product quality, is a significant driver. Regulatory frameworks concerning food safety and labeling vary across regions, impacting market access and product formulations. The market faces competition from other functional beverages and health drinks. End-user demographics are predominantly health-conscious consumers, with a growing interest in natural and organic products. M&A activity has been relatively moderate in recent years, with xx deals recorded between 2019 and 2024.
- Market Concentration: Moderately concentrated, with a few major players holding significant market share.
- Technological Innovation: Focus on improving processing, extending shelf life, and enhancing taste and texture.
- Regulatory Landscape: Varying regulations across regions influence product formulations and market access.
- Competitive Substitutes: Other functional beverages, health drinks, and juices pose competitive challenges.
- End-User Demographics: Primarily health-conscious consumers seeking natural and organic products.
- M&A Activity: Moderate activity, with xx deals recorded between 2019 and 2024, indicating potential for future consolidation.
Aloe Vera Products Industry Growth Trends & Insights
The Aloe Vera Products market has exhibited steady growth during the historical period (2019-2024), driven by increasing consumer awareness of aloe vera's health benefits and the rising demand for functional beverages. The market experienced a CAGR of xx% during this period. Technological advancements, such as improved extraction techniques and innovative packaging solutions, have further propelled market expansion. Consumer behavior shifts towards healthier lifestyles and a preference for natural ingredients contribute to the market's growth trajectory. The estimated market size in 2025 is xx Million units, with a projected CAGR of xx% from 2025 to 2033. Market penetration is expected to increase significantly, especially in developing economies. Disruptions, such as changing consumer preferences and evolving regulatory norms, will influence future growth.
Dominant Regions, Countries, or Segments in Aloe Vera Products Industry
North America and Asia-Pacific currently dominate the Aloe Vera Products market, driven by high consumer demand for health and wellness products. Within product types, bottled drinks and aloe vera water hold the largest market share, while supermarkets/hypermarkets are the leading distribution channel.
- Leading Regions: North America and Asia-Pacific
- Dominant Product Type: Bottled drinks and Aloe Vera water
- Primary Distribution Channel: Supermarkets/Hypermarkets
- Key Growth Drivers: Rising health consciousness, increasing disposable incomes, and expanding retail infrastructure.
- North America: High consumer awareness of health benefits and strong demand for functional beverages.
- Asia-Pacific: Rapid economic growth, increasing health awareness, and a large consumer base.
- Europe: Growing popularity of natural and organic products.
Aloe Vera Products Industry Product Landscape
The Aloe Vera Products market offers a diverse range of products, including hot drinks, bottled drinks, juice concentrates, and aloe vera water. Product innovation focuses on enhancing taste, improving texture, and developing functional formulations with added benefits. Many brands highlight the natural, organic, and health-promoting aspects of their products as unique selling propositions. Technological advancements in processing and packaging extend shelf life and maintain product quality.
Key Drivers, Barriers & Challenges in Aloe Vera Products Industry
Key Drivers:
- Rising consumer awareness of aloe vera's health benefits.
- Growing demand for functional beverages and natural products.
- Increasing disposable incomes in developing economies.
- Technological advancements in processing and packaging.
Key Challenges:
- Maintaining consistent quality and purity of aloe vera extract.
- Fluctuations in raw material prices.
- Stringent regulatory requirements regarding food safety and labeling.
- Competition from other functional beverages and health drinks. This competition negatively impacts market share by approximately xx% annually.
Emerging Opportunities in Aloe Vera Products Industry
- Expanding into untapped markets in developing countries.
- Developing innovative product formulations with added functional benefits.
- Leveraging online retail channels to reach wider consumer base.
- Creating personalized and customized aloe vera products based on consumer preferences.
Growth Accelerators in the Aloe Vera Products Industry Industry
Long-term growth will be fueled by strategic partnerships between aloe vera producers and beverage companies, technological advancements in product formulation and processing, and expansions into new geographic markets, particularly in developing countries with rising disposable incomes and increasing health consciousness. Innovative marketing strategies targeting health-conscious consumers will also be crucial.
Key Players Shaping the Aloe Vera Products Industry Market
- Grace Foods
- Tory's Choice Inc
- OKF
- Alterfood
- Okyalo
- Houssy Global
- Veganic
- Forever Living Products
- Simplee Aloe
Notable Milestones in Aloe Vera Products Industry Sector
- April 2021: Veganic launched 100% organic aloe vera juices in the US.
- October 2021: Sappe launched two new aloe vera drinks in Thailand.
- September 2022: 1NE Beverages launched aloe vera juices in India.
In-Depth Aloe Vera Products Industry Market Outlook
The Aloe Vera Products market is poised for robust growth over the forecast period (2025-2033), driven by sustained demand for health-promoting beverages and continued innovation in product development and marketing. Strategic partnerships, expansion into new markets, and increased focus on sustainability will be key factors shaping the industry's future. The market presents significant opportunities for both established players and new entrants willing to adapt to evolving consumer preferences and market dynamics.
Aloe Vera Products Industry Segmentation
-
1. Product Type
- 1.1. Hot drinks
- 1.2. Bottled drinks
- 1.3. Juice Concentrates
- 1.4. Aloe Vera water
-
2. Distribution Channel
- 2.1. Supermarkets/Hypermarkets
- 2.2. Convenience/Grocery Stores
- 2.3. Specialty Stores
- 2.4. Online Retail Stores
- 2.5. Other Distribution Channels
Aloe Vera Products Industry Segmentation By Geography
-
1. North America
- 1.1. United States
- 1.2. Canada
- 1.3. Mexico
- 1.4. Rest of North America
-
2. Europe
- 2.1. Spain
- 2.2. United Kingdom
- 2.3. Germany
- 2.4. France
- 2.5. Italy
- 2.6. Russia
- 2.7. Rest of Europe
-
3. Asia Pacific
- 3.1. China
- 3.2. Japan
- 3.3. India
- 3.4. Australia
- 3.5. Rest of Asia Pacific
-
4. South America
- 4.1. Brazil
- 4.2. Argentina
- 4.3. Rest of South America
-
5. Middle East and Africa
- 5.1. South Africa
- 5.2. Saudi Arabia
- 5.3. Rest of Middle East and Africa
Aloe Vera Products Industry REPORT HIGHLIGHTS
| Aspects | Details |
|---|---|
| Study Period | 2019-2033 |
| Base Year | 2024 |
| Estimated Year | 2025 |
| Forecast Period | 2025-2033 |
| Historical Period | 2019-2024 |
| Growth Rate | CAGR of 10.90% from 2019-2033 |
| Segmentation |
|
Table of Contents
- 1. Introduction
- 1.1. Research Scope
- 1.2. Market Segmentation
- 1.3. Research Methodology
- 1.4. Definitions and Assumptions
- 2. Executive Summary
- 2.1. Introduction
- 3. Market Dynamics
- 3.1. Introduction
- 3.2. Market Drivers
- 3.2.1. Increasing Consumer Awareness Regarding Natural Products; Growing Demand for Anthocyanin in Pharmaceutical Industry
- 3.3. Market Restrains
- 3.3.1. Easy Availability of Synthetic Food Colorant
- 3.4. Market Trends
- 3.4.1. Aloe Vera based Juices to Witness Higher Growth
- 4. Market Factor Analysis
- 4.1. Porters Five Forces
- 4.2. Supply/Value Chain
- 4.3. PESTEL analysis
- 4.4. Market Entropy
- 4.5. Patent/Trademark Analysis
- 5. Global Aloe Vera Products Industry Analysis, Insights and Forecast, 2019-2031
- 5.1. Market Analysis, Insights and Forecast - by Product Type
- 5.1.1. Hot drinks
- 5.1.2. Bottled drinks
- 5.1.3. Juice Concentrates
- 5.1.4. Aloe Vera water
- 5.2. Market Analysis, Insights and Forecast - by Distribution Channel
- 5.2.1. Supermarkets/Hypermarkets
- 5.2.2. Convenience/Grocery Stores
- 5.2.3. Specialty Stores
- 5.2.4. Online Retail Stores
- 5.2.5. Other Distribution Channels
- 5.3. Market Analysis, Insights and Forecast - by Region
- 5.3.1. North America
- 5.3.2. Europe
- 5.3.3. Asia Pacific
- 5.3.4. South America
- 5.3.5. Middle East and Africa
- 5.1. Market Analysis, Insights and Forecast - by Product Type
- 6. North America Aloe Vera Products Industry Analysis, Insights and Forecast, 2019-2031
- 6.1. Market Analysis, Insights and Forecast - by Product Type
- 6.1.1. Hot drinks
- 6.1.2. Bottled drinks
- 6.1.3. Juice Concentrates
- 6.1.4. Aloe Vera water
- 6.2. Market Analysis, Insights and Forecast - by Distribution Channel
- 6.2.1. Supermarkets/Hypermarkets
- 6.2.2. Convenience/Grocery Stores
- 6.2.3. Specialty Stores
- 6.2.4. Online Retail Stores
- 6.2.5. Other Distribution Channels
- 6.1. Market Analysis, Insights and Forecast - by Product Type
- 7. Europe Aloe Vera Products Industry Analysis, Insights and Forecast, 2019-2031
- 7.1. Market Analysis, Insights and Forecast - by Product Type
- 7.1.1. Hot drinks
- 7.1.2. Bottled drinks
- 7.1.3. Juice Concentrates
- 7.1.4. Aloe Vera water
- 7.2. Market Analysis, Insights and Forecast - by Distribution Channel
- 7.2.1. Supermarkets/Hypermarkets
- 7.2.2. Convenience/Grocery Stores
- 7.2.3. Specialty Stores
- 7.2.4. Online Retail Stores
- 7.2.5. Other Distribution Channels
- 7.1. Market Analysis, Insights and Forecast - by Product Type
- 8. Asia Pacific Aloe Vera Products Industry Analysis, Insights and Forecast, 2019-2031
- 8.1. Market Analysis, Insights and Forecast - by Product Type
- 8.1.1. Hot drinks
- 8.1.2. Bottled drinks
- 8.1.3. Juice Concentrates
- 8.1.4. Aloe Vera water
- 8.2. Market Analysis, Insights and Forecast - by Distribution Channel
- 8.2.1. Supermarkets/Hypermarkets
- 8.2.2. Convenience/Grocery Stores
- 8.2.3. Specialty Stores
- 8.2.4. Online Retail Stores
- 8.2.5. Other Distribution Channels
- 8.1. Market Analysis, Insights and Forecast - by Product Type
- 9. South America Aloe Vera Products Industry Analysis, Insights and Forecast, 2019-2031
- 9.1. Market Analysis, Insights and Forecast - by Product Type
- 9.1.1. Hot drinks
- 9.1.2. Bottled drinks
- 9.1.3. Juice Concentrates
- 9.1.4. Aloe Vera water
- 9.2. Market Analysis, Insights and Forecast - by Distribution Channel
- 9.2.1. Supermarkets/Hypermarkets
- 9.2.2. Convenience/Grocery Stores
- 9.2.3. Specialty Stores
- 9.2.4. Online Retail Stores
- 9.2.5. Other Distribution Channels
- 9.1. Market Analysis, Insights and Forecast - by Product Type
- 10. Middle East and Africa Aloe Vera Products Industry Analysis, Insights and Forecast, 2019-2031
- 10.1. Market Analysis, Insights and Forecast - by Product Type
- 10.1.1. Hot drinks
- 10.1.2. Bottled drinks
- 10.1.3. Juice Concentrates
- 10.1.4. Aloe Vera water
- 10.2. Market Analysis, Insights and Forecast - by Distribution Channel
- 10.2.1. Supermarkets/Hypermarkets
- 10.2.2. Convenience/Grocery Stores
- 10.2.3. Specialty Stores
- 10.2.4. Online Retail Stores
- 10.2.5. Other Distribution Channels
- 10.1. Market Analysis, Insights and Forecast - by Product Type
- 11. North America Aloe Vera Products Industry Analysis, Insights and Forecast, 2019-2031
- 11.1. Market Analysis, Insights and Forecast - By Country/Sub-region
- 11.1.1 United States
- 11.1.2 Canada
- 11.1.3 Mexico
- 11.1.4 Rest of North America
- 12. Europe Aloe Vera Products Industry Analysis, Insights and Forecast, 2019-2031
- 12.1. Market Analysis, Insights and Forecast - By Country/Sub-region
- 12.1.1 Spain
- 12.1.2 United Kingdom
- 12.1.3 Germany
- 12.1.4 France
- 12.1.5 Italy
- 12.1.6 Russia
- 12.1.7 Rest of Europe
- 13. Asia Pacific Aloe Vera Products Industry Analysis, Insights and Forecast, 2019-2031
- 13.1. Market Analysis, Insights and Forecast - By Country/Sub-region
- 13.1.1 China
- 13.1.2 Japan
- 13.1.3 India
- 13.1.4 Australia
- 13.1.5 Rest of Asia Pacific
- 14. South America Aloe Vera Products Industry Analysis, Insights and Forecast, 2019-2031
- 14.1. Market Analysis, Insights and Forecast - By Country/Sub-region
- 14.1.1 Brazil
- 14.1.2 Argentina
- 14.1.3 Rest of South America
- 15. Middle East and Africa Aloe Vera Products Industry Analysis, Insights and Forecast, 2019-2031
- 15.1. Market Analysis, Insights and Forecast - By Country/Sub-region
- 15.1.1 South Africa
- 15.1.2 Saudi Arabia
- 15.1.3 Rest of Middle East and Africa
- 16. Competitive Analysis
- 16.1. Global Market Share Analysis 2024
- 16.2. Company Profiles
- 16.2.1 Grace Foods
- 16.2.1.1. Overview
- 16.2.1.2. Products
- 16.2.1.3. SWOT Analysis
- 16.2.1.4. Recent Developments
- 16.2.1.5. Financials (Based on Availability)
- 16.2.2 Tory's Choice Inc
- 16.2.2.1. Overview
- 16.2.2.2. Products
- 16.2.2.3. SWOT Analysis
- 16.2.2.4. Recent Developments
- 16.2.2.5. Financials (Based on Availability)
- 16.2.3 OKF
- 16.2.3.1. Overview
- 16.2.3.2. Products
- 16.2.3.3. SWOT Analysis
- 16.2.3.4. Recent Developments
- 16.2.3.5. Financials (Based on Availability)
- 16.2.4 Alterfood
- 16.2.4.1. Overview
- 16.2.4.2. Products
- 16.2.4.3. SWOT Analysis
- 16.2.4.4. Recent Developments
- 16.2.4.5. Financials (Based on Availability)
- 16.2.5 Okyalo
- 16.2.5.1. Overview
- 16.2.5.2. Products
- 16.2.5.3. SWOT Analysis
- 16.2.5.4. Recent Developments
- 16.2.5.5. Financials (Based on Availability)
- 16.2.6 Houssy Global
- 16.2.6.1. Overview
- 16.2.6.2. Products
- 16.2.6.3. SWOT Analysis
- 16.2.6.4. Recent Developments
- 16.2.6.5. Financials (Based on Availability)
- 16.2.7 Veganic*List Not Exhaustive
- 16.2.7.1. Overview
- 16.2.7.2. Products
- 16.2.7.3. SWOT Analysis
- 16.2.7.4. Recent Developments
- 16.2.7.5. Financials (Based on Availability)
- 16.2.8 Forever Living Products
- 16.2.8.1. Overview
- 16.2.8.2. Products
- 16.2.8.3. SWOT Analysis
- 16.2.8.4. Recent Developments
- 16.2.8.5. Financials (Based on Availability)
- 16.2.9 Simplee Aloe
- 16.2.9.1. Overview
- 16.2.9.2. Products
- 16.2.9.3. SWOT Analysis
- 16.2.9.4. Recent Developments
- 16.2.9.5. Financials (Based on Availability)
- 16.2.1 Grace Foods
List of Figures
- Figure 1: Global Aloe Vera Products Industry Revenue Breakdown (Million, %) by Region 2024 & 2032
- Figure 2: North America Aloe Vera Products Industry Revenue (Million), by Country 2024 & 2032
- Figure 3: North America Aloe Vera Products Industry Revenue Share (%), by Country 2024 & 2032
- Figure 4: Europe Aloe Vera Products Industry Revenue (Million), by Country 2024 & 2032
- Figure 5: Europe Aloe Vera Products Industry Revenue Share (%), by Country 2024 & 2032
- Figure 6: Asia Pacific Aloe Vera Products Industry Revenue (Million), by Country 2024 & 2032
- Figure 7: Asia Pacific Aloe Vera Products Industry Revenue Share (%), by Country 2024 & 2032
- Figure 8: South America Aloe Vera Products Industry Revenue (Million), by Country 2024 & 2032
- Figure 9: South America Aloe Vera Products Industry Revenue Share (%), by Country 2024 & 2032
- Figure 10: Middle East and Africa Aloe Vera Products Industry Revenue (Million), by Country 2024 & 2032
- Figure 11: Middle East and Africa Aloe Vera Products Industry Revenue Share (%), by Country 2024 & 2032
- Figure 12: North America Aloe Vera Products Industry Revenue (Million), by Product Type 2024 & 2032
- Figure 13: North America Aloe Vera Products Industry Revenue Share (%), by Product Type 2024 & 2032
- Figure 14: North America Aloe Vera Products Industry Revenue (Million), by Distribution Channel 2024 & 2032
- Figure 15: North America Aloe Vera Products Industry Revenue Share (%), by Distribution Channel 2024 & 2032
- Figure 16: North America Aloe Vera Products Industry Revenue (Million), by Country 2024 & 2032
- Figure 17: North America Aloe Vera Products Industry Revenue Share (%), by Country 2024 & 2032
- Figure 18: Europe Aloe Vera Products Industry Revenue (Million), by Product Type 2024 & 2032
- Figure 19: Europe Aloe Vera Products Industry Revenue Share (%), by Product Type 2024 & 2032
- Figure 20: Europe Aloe Vera Products Industry Revenue (Million), by Distribution Channel 2024 & 2032
- Figure 21: Europe Aloe Vera Products Industry Revenue Share (%), by Distribution Channel 2024 & 2032
- Figure 22: Europe Aloe Vera Products Industry Revenue (Million), by Country 2024 & 2032
- Figure 23: Europe Aloe Vera Products Industry Revenue Share (%), by Country 2024 & 2032
- Figure 24: Asia Pacific Aloe Vera Products Industry Revenue (Million), by Product Type 2024 & 2032
- Figure 25: Asia Pacific Aloe Vera Products Industry Revenue Share (%), by Product Type 2024 & 2032
- Figure 26: Asia Pacific Aloe Vera Products Industry Revenue (Million), by Distribution Channel 2024 & 2032
- Figure 27: Asia Pacific Aloe Vera Products Industry Revenue Share (%), by Distribution Channel 2024 & 2032
- Figure 28: Asia Pacific Aloe Vera Products Industry Revenue (Million), by Country 2024 & 2032
- Figure 29: Asia Pacific Aloe Vera Products Industry Revenue Share (%), by Country 2024 & 2032
- Figure 30: South America Aloe Vera Products Industry Revenue (Million), by Product Type 2024 & 2032
- Figure 31: South America Aloe Vera Products Industry Revenue Share (%), by Product Type 2024 & 2032
- Figure 32: South America Aloe Vera Products Industry Revenue (Million), by Distribution Channel 2024 & 2032
- Figure 33: South America Aloe Vera Products Industry Revenue Share (%), by Distribution Channel 2024 & 2032
- Figure 34: South America Aloe Vera Products Industry Revenue (Million), by Country 2024 & 2032
- Figure 35: South America Aloe Vera Products Industry Revenue Share (%), by Country 2024 & 2032
- Figure 36: Middle East and Africa Aloe Vera Products Industry Revenue (Million), by Product Type 2024 & 2032
- Figure 37: Middle East and Africa Aloe Vera Products Industry Revenue Share (%), by Product Type 2024 & 2032
- Figure 38: Middle East and Africa Aloe Vera Products Industry Revenue (Million), by Distribution Channel 2024 & 2032
- Figure 39: Middle East and Africa Aloe Vera Products Industry Revenue Share (%), by Distribution Channel 2024 & 2032
- Figure 40: Middle East and Africa Aloe Vera Products Industry Revenue (Million), by Country 2024 & 2032
- Figure 41: Middle East and Africa Aloe Vera Products Industry Revenue Share (%), by Country 2024 & 2032
List of Tables
- Table 1: Global Aloe Vera Products Industry Revenue Million Forecast, by Region 2019 & 2032
- Table 2: Global Aloe Vera Products Industry Revenue Million Forecast, by Product Type 2019 & 2032
- Table 3: Global Aloe Vera Products Industry Revenue Million Forecast, by Distribution Channel 2019 & 2032
- Table 4: Global Aloe Vera Products Industry Revenue Million Forecast, by Region 2019 & 2032
- Table 5: Global Aloe Vera Products Industry Revenue Million Forecast, by Country 2019 & 2032
- Table 6: United States Aloe Vera Products Industry Revenue (Million) Forecast, by Application 2019 & 2032
- Table 7: Canada Aloe Vera Products Industry Revenue (Million) Forecast, by Application 2019 & 2032
- Table 8: Mexico Aloe Vera Products Industry Revenue (Million) Forecast, by Application 2019 & 2032
- Table 9: Rest of North America Aloe Vera Products Industry Revenue (Million) Forecast, by Application 2019 & 2032
- Table 10: Global Aloe Vera Products Industry Revenue Million Forecast, by Country 2019 & 2032
- Table 11: Spain Aloe Vera Products Industry Revenue (Million) Forecast, by Application 2019 & 2032
- Table 12: United Kingdom Aloe Vera Products Industry Revenue (Million) Forecast, by Application 2019 & 2032
- Table 13: Germany Aloe Vera Products Industry Revenue (Million) Forecast, by Application 2019 & 2032
- Table 14: France Aloe Vera Products Industry Revenue (Million) Forecast, by Application 2019 & 2032
- Table 15: Italy Aloe Vera Products Industry Revenue (Million) Forecast, by Application 2019 & 2032
- Table 16: Russia Aloe Vera Products Industry Revenue (Million) Forecast, by Application 2019 & 2032
- Table 17: Rest of Europe Aloe Vera Products Industry Revenue (Million) Forecast, by Application 2019 & 2032
- Table 18: Global Aloe Vera Products Industry Revenue Million Forecast, by Country 2019 & 2032
- Table 19: China Aloe Vera Products Industry Revenue (Million) Forecast, by Application 2019 & 2032
- Table 20: Japan Aloe Vera Products Industry Revenue (Million) Forecast, by Application 2019 & 2032
- Table 21: India Aloe Vera Products Industry Revenue (Million) Forecast, by Application 2019 & 2032
- Table 22: Australia Aloe Vera Products Industry Revenue (Million) Forecast, by Application 2019 & 2032
- Table 23: Rest of Asia Pacific Aloe Vera Products Industry Revenue (Million) Forecast, by Application 2019 & 2032
- Table 24: Global Aloe Vera Products Industry Revenue Million Forecast, by Country 2019 & 2032
- Table 25: Brazil Aloe Vera Products Industry Revenue (Million) Forecast, by Application 2019 & 2032
- Table 26: Argentina Aloe Vera Products Industry Revenue (Million) Forecast, by Application 2019 & 2032
- Table 27: Rest of South America Aloe Vera Products Industry Revenue (Million) Forecast, by Application 2019 & 2032
- Table 28: Global Aloe Vera Products Industry Revenue Million Forecast, by Country 2019 & 2032
- Table 29: South Africa Aloe Vera Products Industry Revenue (Million) Forecast, by Application 2019 & 2032
- Table 30: Saudi Arabia Aloe Vera Products Industry Revenue (Million) Forecast, by Application 2019 & 2032
- Table 31: Rest of Middle East and Africa Aloe Vera Products Industry Revenue (Million) Forecast, by Application 2019 & 2032
- Table 32: Global Aloe Vera Products Industry Revenue Million Forecast, by Product Type 2019 & 2032
- Table 33: Global Aloe Vera Products Industry Revenue Million Forecast, by Distribution Channel 2019 & 2032
- Table 34: Global Aloe Vera Products Industry Revenue Million Forecast, by Country 2019 & 2032
- Table 35: United States Aloe Vera Products Industry Revenue (Million) Forecast, by Application 2019 & 2032
- Table 36: Canada Aloe Vera Products Industry Revenue (Million) Forecast, by Application 2019 & 2032
- Table 37: Mexico Aloe Vera Products Industry Revenue (Million) Forecast, by Application 2019 & 2032
- Table 38: Rest of North America Aloe Vera Products Industry Revenue (Million) Forecast, by Application 2019 & 2032
- Table 39: Global Aloe Vera Products Industry Revenue Million Forecast, by Product Type 2019 & 2032
- Table 40: Global Aloe Vera Products Industry Revenue Million Forecast, by Distribution Channel 2019 & 2032
- Table 41: Global Aloe Vera Products Industry Revenue Million Forecast, by Country 2019 & 2032
- Table 42: Spain Aloe Vera Products Industry Revenue (Million) Forecast, by Application 2019 & 2032
- Table 43: United Kingdom Aloe Vera Products Industry Revenue (Million) Forecast, by Application 2019 & 2032
- Table 44: Germany Aloe Vera Products Industry Revenue (Million) Forecast, by Application 2019 & 2032
- Table 45: France Aloe Vera Products Industry Revenue (Million) Forecast, by Application 2019 & 2032
- Table 46: Italy Aloe Vera Products Industry Revenue (Million) Forecast, by Application 2019 & 2032
- Table 47: Russia Aloe Vera Products Industry Revenue (Million) Forecast, by Application 2019 & 2032
- Table 48: Rest of Europe Aloe Vera Products Industry Revenue (Million) Forecast, by Application 2019 & 2032
- Table 49: Global Aloe Vera Products Industry Revenue Million Forecast, by Product Type 2019 & 2032
- Table 50: Global Aloe Vera Products Industry Revenue Million Forecast, by Distribution Channel 2019 & 2032
- Table 51: Global Aloe Vera Products Industry Revenue Million Forecast, by Country 2019 & 2032
- Table 52: China Aloe Vera Products Industry Revenue (Million) Forecast, by Application 2019 & 2032
- Table 53: Japan Aloe Vera Products Industry Revenue (Million) Forecast, by Application 2019 & 2032
- Table 54: India Aloe Vera Products Industry Revenue (Million) Forecast, by Application 2019 & 2032
- Table 55: Australia Aloe Vera Products Industry Revenue (Million) Forecast, by Application 2019 & 2032
- Table 56: Rest of Asia Pacific Aloe Vera Products Industry Revenue (Million) Forecast, by Application 2019 & 2032
- Table 57: Global Aloe Vera Products Industry Revenue Million Forecast, by Product Type 2019 & 2032
- Table 58: Global Aloe Vera Products Industry Revenue Million Forecast, by Distribution Channel 2019 & 2032
- Table 59: Global Aloe Vera Products Industry Revenue Million Forecast, by Country 2019 & 2032
- Table 60: Brazil Aloe Vera Products Industry Revenue (Million) Forecast, by Application 2019 & 2032
- Table 61: Argentina Aloe Vera Products Industry Revenue (Million) Forecast, by Application 2019 & 2032
- Table 62: Rest of South America Aloe Vera Products Industry Revenue (Million) Forecast, by Application 2019 & 2032
- Table 63: Global Aloe Vera Products Industry Revenue Million Forecast, by Product Type 2019 & 2032
- Table 64: Global Aloe Vera Products Industry Revenue Million Forecast, by Distribution Channel 2019 & 2032
- Table 65: Global Aloe Vera Products Industry Revenue Million Forecast, by Country 2019 & 2032
- Table 66: South Africa Aloe Vera Products Industry Revenue (Million) Forecast, by Application 2019 & 2032
- Table 67: Saudi Arabia Aloe Vera Products Industry Revenue (Million) Forecast, by Application 2019 & 2032
- Table 68: Rest of Middle East and Africa Aloe Vera Products Industry Revenue (Million) Forecast, by Application 2019 & 2032
Frequently Asked Questions
1. What is the projected Compound Annual Growth Rate (CAGR) of the Aloe Vera Products Industry?
The projected CAGR is approximately 10.90%.
2. Which companies are prominent players in the Aloe Vera Products Industry?
Key companies in the market include Grace Foods, Tory's Choice Inc, OKF, Alterfood, Okyalo, Houssy Global, Veganic*List Not Exhaustive, Forever Living Products, Simplee Aloe.
3. What are the main segments of the Aloe Vera Products Industry?
The market segments include Product Type, Distribution Channel.
4. Can you provide details about the market size?
The market size is estimated to be USD 155.16 Million as of 2022.
5. What are some drivers contributing to market growth?
Increasing Consumer Awareness Regarding Natural Products; Growing Demand for Anthocyanin in Pharmaceutical Industry.
6. What are the notable trends driving market growth?
Aloe Vera based Juices to Witness Higher Growth.
7. Are there any restraints impacting market growth?
Easy Availability of Synthetic Food Colorant.
8. Can you provide examples of recent developments in the market?
September 2022: 1NE Beverages, a seasoning and beverage brand under the subsidiary of US-based Livinia Foods, launched aloe vera juices available in a range of flavors in India. The company claims the product has antioxidant properties and multiple health benefits ranging from skin, oral, dental, or digestive health.
9. What pricing options are available for accessing the report?
Pricing options include single-user, multi-user, and enterprise licenses priced at USD 4750, USD 5250, and USD 8750 respectively.
10. Is the market size provided in terms of value or volume?
The market size is provided in terms of value, measured in Million.
11. Are there any specific market keywords associated with the report?
Yes, the market keyword associated with the report is "Aloe Vera Products Industry," which aids in identifying and referencing the specific market segment covered.
12. How do I determine which pricing option suits my needs best?
The pricing options vary based on user requirements and access needs. Individual users may opt for single-user licenses, while businesses requiring broader access may choose multi-user or enterprise licenses for cost-effective access to the report.
13. Are there any additional resources or data provided in the Aloe Vera Products Industry report?
While the report offers comprehensive insights, it's advisable to review the specific contents or supplementary materials provided to ascertain if additional resources or data are available.
14. How can I stay updated on further developments or reports in the Aloe Vera Products Industry?
To stay informed about further developments, trends, and reports in the Aloe Vera Products Industry, consider subscribing to industry newsletters, following relevant companies and organizations, or regularly checking reputable industry news sources and publications.
Methodology
Step 1 - Identification of Relevant Samples Size from Population Database


Step 2 - Approaches for Defining Global Market Size (Value, Volume* & Price*)

Note*: In applicable scenarios
Step 3 - Data Sources
Primary Research
- Web Analytics
- Survey Reports
- Research Institute
- Latest Research Reports
- Opinion Leaders
Secondary Research
- Annual Reports
- White Paper
- Latest Press Release
- Industry Association
- Paid Database
- Investor Presentations

Step 4 - Data Triangulation
Involves using different sources of information in order to increase the validity of a study
These sources are likely to be stakeholders in a program - participants, other researchers, program staff, other community members, and so on.
Then we put all data in single framework & apply various statistical tools to find out the dynamic on the market.
During the analysis stage, feedback from the stakeholder groups would be compared to determine areas of agreement as well as areas of divergence
