

Key Insights
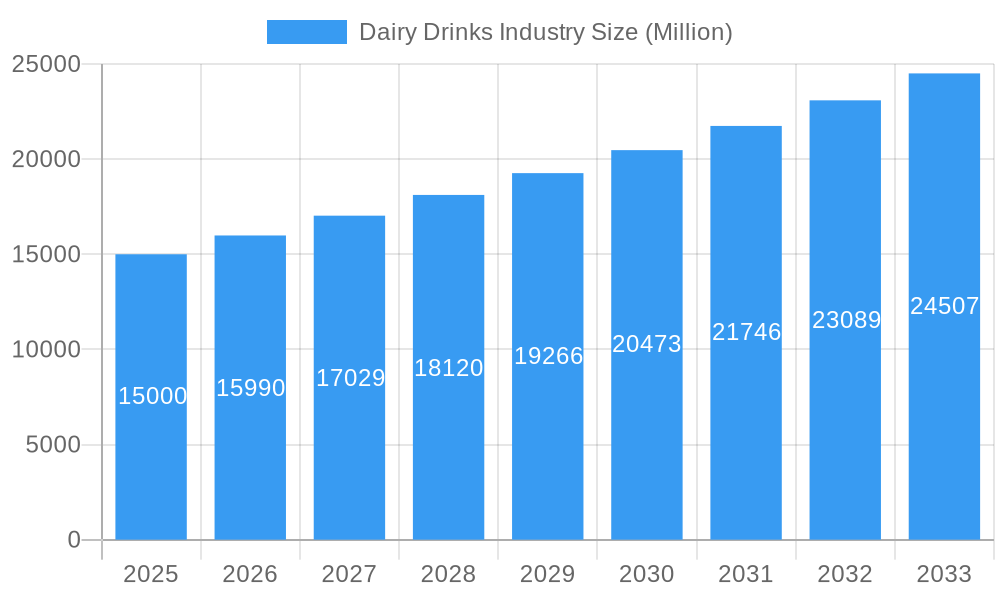
The global dairy drinks market, projected to reach $87.86 billion by 2025, is forecast for substantial growth with a CAGR of 6% from 2025 to 2033. This expansion is primarily attributed to heightened consumer focus on health and wellness, driving demand for nutrient-rich options like probiotic-fortified yogurt and kefir. Evolving consumer preferences also favor innovative flavored dairy beverages, offering convenient and appealing alternatives. Furthermore, the proliferation of online sales channels complements traditional retail, significantly boosting market reach. Key challenges include volatile milk prices and the growing appeal of plant-based substitutes. Geographically, North America and Europe lead in market share, supported by mature consumer bases, while Asia-Pacific presents significant growth opportunities due to rising incomes and urbanization.
Dairy Drinks Industry Market Size (In Billion)
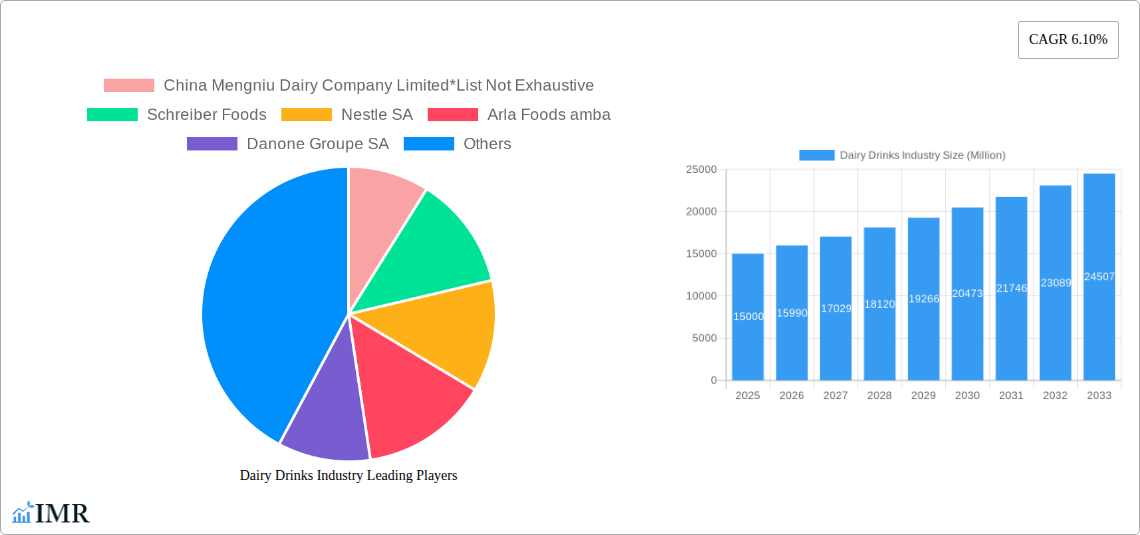
Market segmentation highlights key consumer trends. Milk products are expected to lead in volume, with yogurt and kefir following. Flavored dairy drinks are anticipated to generate higher revenue than unflavored varieties. While supermarkets remain dominant, convenience stores and online platforms are rapidly gaining traction, reflecting a shift towards accessible and time-efficient purchasing. Leading companies such as Mengniu, Nestle, Danone, and Arla Foods are actively competing through brand building, product development, and distribution enhancement. Future market success will depend on continuous innovation, strategic alliances, and targeted marketing towards health-conscious demographics, while effectively navigating raw material cost fluctuations and competition from alternative beverages.
Dairy Drinks Industry Company Market Share
Dairy Drinks Industry Market Report: 2019-2033
This comprehensive report provides a detailed analysis of the global dairy drinks market, encompassing its current state, future trajectory, and key players. The study period covers 2019-2033, with 2025 as the base and estimated year. This report is invaluable for industry professionals, investors, and strategic decision-makers seeking insights into this dynamic sector. The report segments the market by type (milk, yogurt, kefir, others), category (flavored, unflavored), and distribution channel (supermarkets/hypermarkets, convenience stores, specialty stores, online channels, others). The market is valued at XX Million units in 2025 and is projected to reach XX Million units by 2033.
Dairy Drinks Industry Market Dynamics & Structure
This section analyzes the competitive landscape, technological advancements, regulatory environment, and market trends within the dairy drinks industry. We delve into market concentration, identifying major players and their market share percentages. The analysis also explores the impact of mergers and acquisitions (M&A) activity, quantifying deal volumes during the study period and assessing their influence on market consolidation. Technological innovation drivers and barriers are examined, alongside the influence of regulatory frameworks and the presence of competitive substitutes. Finally, the report profiles end-user demographics and their evolving preferences within the dairy drinks market.
- Market Concentration: The dairy drinks market exhibits a moderately concentrated structure, with a few dominant players holding significant market share (e.g., Nestle SA holds approximately xx% market share in 2025).
- Technological Innovation: Advancements in processing, packaging, and ingredient technologies drive market growth, while high R&D costs and regulatory hurdles pose barriers to innovation.
- Regulatory Framework: Varying food safety regulations across different regions influence product formulation and market entry strategies.
- Competitive Substitutes: Plant-based alternatives and other beverages pose a competitive threat, driving innovation in dairy-based products.
- M&A Activity: The number of M&A deals in the dairy drinks industry increased by xx% between 2019 and 2024, indicating market consolidation trends.
Dairy Drinks Industry Growth Trends & Insights
Leveraging comprehensive market data and analysis, this section details the evolution of the dairy drinks market size, highlighting historical growth and projecting future expansion. We examine adoption rates of various dairy drink types, analyzing consumer preferences and shifts in consumption patterns. The impact of technological disruptions, including innovations in product formulation and distribution, is assessed. Key metrics such as Compound Annual Growth Rate (CAGR) and market penetration are presented to provide a quantitative overview of market growth and potential. The global dairy drink market experienced a CAGR of xx% between 2019 and 2024, driven by factors such as rising disposable incomes and changing consumer preferences.
Dominant Regions, Countries, or Segments in Dairy Drinks Industry
This section identifies the leading regions, countries, and market segments that are driving market growth within the dairy drinks sector. It analyzes market share and growth potential for each segment (by type, category, and distribution channel). Key drivers, including economic policies, infrastructure development, and consumer behavior, are highlighted for each dominant region and segment. The analysis also pinpoints the factors contributing to the dominance of particular regions or segments.
- By Type: The milk segment holds the largest market share, followed by yogurt, with kefir and other types showing strong growth potential.
- By Category: Flavored drinks dominate the market, while the unflavored segment demonstrates steady growth.
- By Distribution Channel: Supermarkets/hypermarkets represent the largest distribution channel, but online channels and convenience stores are showing rapid expansion.
- Geographic Dominance: Asia-Pacific region, particularly China, demonstrates the highest growth potential due to rising consumption and increasing population.
Dairy Drinks Industry Product Landscape
This section provides an overview of the dairy drinks product landscape, highlighting key product innovations, applications, and performance metrics. We examine the unique selling propositions of various dairy drink products and discuss technological advancements influencing product development and market differentiation. New product development focuses on functional dairy drinks incorporating added health benefits, such as probiotics and enhanced protein content.
Key Drivers, Barriers & Challenges in Dairy Drinks Industry
This section outlines the key drivers propelling the dairy drinks market, including technological advancements, favorable economic conditions, and supportive government policies. Specific examples are provided to illustrate these drivers. The analysis also identifies key challenges and restraints, such as supply chain disruptions, regulatory hurdles, and intense competition. The quantitative impact of these challenges is assessed.
Key Drivers: Rising consumer disposable incomes, increased health consciousness (driving demand for functional dairy drinks), and technological advancements in production and packaging.
Key Challenges: Fluctuations in raw material prices, stringent regulations related to food safety and labeling, and intense competition from alternative beverages.
Emerging Opportunities in Dairy Drinks Industry
This section highlights promising emerging trends and untapped market opportunities in the dairy drinks industry. We explore innovative applications of dairy drinks, evolving consumer preferences (e.g., increased demand for organic and sustainable products), and the potential for expansion into new markets. Opportunities exist in the development of personalized dairy products catered to specific dietary needs and preferences.
Growth Accelerators in the Dairy Drinks Industry Industry
This section discusses factors that will accelerate long-term growth in the dairy drinks industry. Focus is on technological breakthroughs (e.g., precision fermentation), strategic partnerships (e.g., collaborations between dairy companies and health food brands), and expansion into emerging markets. The expansion of online retail channels also represents a key growth accelerator.
Key Players Shaping the Dairy Drinks Industry Market
- China Mengniu Dairy Company Limited
- Schreiber Foods
- Nestle SA
- Arla Foods amba
- Danone Groupe SA
- Chr Hansen
- Pillars
- Morinaga Nutritional Foods Inc
- Chobani LLC
Notable Milestones in Dairy Drinks Industry Sector
- 2020: Launch of a new line of plant-based yogurt alternatives by Nestle SA.
- 2021: Acquisition of a smaller dairy company by Danone Groupe SA, expanding its market reach.
- 2022: Introduction of innovative packaging technologies aimed at reducing environmental impact.
- 2023: Significant increase in the number of new product launches focused on health and wellness.
In-Depth Dairy Drinks Industry Market Outlook
The dairy drinks market is poised for continued growth, driven by increasing health consciousness, rising disposable incomes, and technological advancements. Strategic opportunities exist in exploring emerging markets, developing innovative products, and leveraging technological innovations to enhance efficiency and sustainability. Further market consolidation is expected through M&A activity, creating opportunities for larger players to gain market share and expand their product portfolios.
Dairy Drinks Industry Segmentation
-
1. Type
- 1.1. Milk
- 1.2. Yogurt
- 1.3. Kefir
- 1.4. Others
-
2. Category
- 2.1. Flavoured drink
- 2.2. Unflavored drink
-
3. Distibution Channel
- 3.1. Supermarkets/hypermarkets
- 3.2. Convenience stores
- 3.3. Specialty Stores
- 3.4. Online Channels
- 3.5. Others
Dairy Drinks Industry Segmentation By Geography
-
1. North America
- 1.1. United States
- 1.2. Canada
- 1.3. Mexico
- 1.4. Rest of North America
-
2. Europe
- 2.1. United Kingdom
- 2.2. Germany
- 2.3. France
- 2.4. Russia
- 2.5. Italy
- 2.6. Spain
- 2.7. Rest of Europe
-
3. Asia Pacific
- 3.1. India
- 3.2. China
- 3.3. Japan
- 3.4. Australia
- 3.5. Rest of Asia Pacific
-
4. South America
- 4.1. Brazil
- 4.2. Argentina
- 4.3. Rest of South America
- 5. Middle East
-
6. South Africa
- 6.1. Saudi Arabia
- 6.2. Rest of Middle East
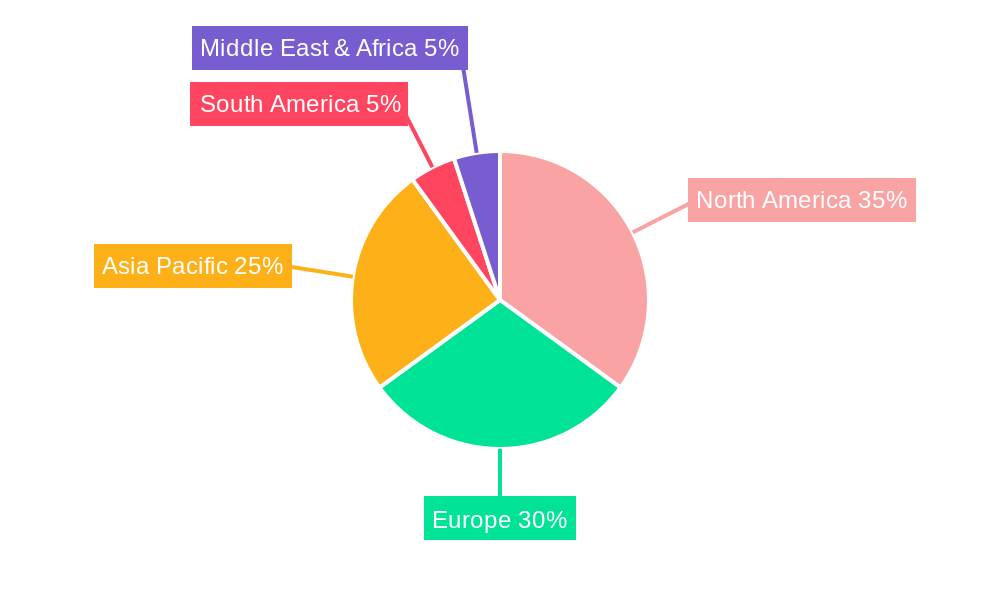
Dairy Drinks Industry Regional Market Share
Geographic Coverage of Dairy Drinks Industry
Dairy Drinks Industry REPORT HIGHLIGHTS
| Aspects | Details |
|---|---|
| Study Period | 2020-2034 |
| Base Year | 2025 |
| Estimated Year | 2026 |
| Forecast Period | 2026-2034 |
| Historical Period | 2020-2025 |
| Growth Rate | CAGR of 6% from 2020-2034 |
| Segmentation |
|
Table of Contents
- 1. Introduction
- 1.1. Research Scope
- 1.2. Market Segmentation
- 1.3. Research Objective
- 1.4. Definitions and Assumptions
- 2. Executive Summary
- 2.1. Market Snapshot
- 3. Market Dynamics
- 3.1. Market Drivers
- 3.2. Market Restrains
- 3.3. Market Trends
- 3.4. Market Opportunities
- 4. Market Factor Analysis
- 4.1. Porters Five Forces
- 4.1.1. Bargaining Power of Suppliers
- 4.1.2. Bargaining Power of Buyers
- 4.1.3. Threat of New Entrants
- 4.1.4. Threat of Substitutes
- 4.1.5. Competitive Rivalry
- 4.2. PESTEL analysis
- 4.3. BCG Analysis
- 4.3.1. Stars (High Growth, High Market Share)
- 4.3.2. Cash Cows (Low Growth, High Market Share)
- 4.3.3. Question Mark (High Growth, Low Market Share)
- 4.3.4. Dogs (Low Growth, Low Market Share)
- 4.4. Ansoff Matrix Analysis
- 4.5. Supply Chain Analysis
- 4.6. Regulatory Landscape
- 4.7. Current Market Potential and Opportunity Assessment (TAM–SAM–SOM Framework)
- 4.8. IMR Analyst Note
- 4.1. Porters Five Forces
- 5. Market Analysis, Insights and Forecast 2021-2033
- 5.1. Market Analysis, Insights and Forecast - by Type
- 5.1.1. Milk
- 5.1.2. Yogurt
- 5.1.3. Kefir
- 5.1.4. Others
- 5.2. Market Analysis, Insights and Forecast - by Category
- 5.2.1. Flavoured drink
- 5.2.2. Unflavored drink
- 5.3. Market Analysis, Insights and Forecast - by Distibution Channel
- 5.3.1. Supermarkets/hypermarkets
- 5.3.2. Convenience stores
- 5.3.3. Specialty Stores
- 5.3.4. Online Channels
- 5.3.5. Others
- 5.4. Market Analysis, Insights and Forecast - by Region
- 5.4.1. North America
- 5.4.2. Europe
- 5.4.3. Asia Pacific
- 5.4.4. South America
- 5.4.5. Middle East
- 5.4.6. South Africa
- 5.1. Market Analysis, Insights and Forecast - by Type
- 6. Global Dairy Drinks Industry Analysis, Insights and Forecast, 2021-2033
- 6.1. Market Analysis, Insights and Forecast - by Type
- 6.1.1. Milk
- 6.1.2. Yogurt
- 6.1.3. Kefir
- 6.1.4. Others
- 6.2. Market Analysis, Insights and Forecast - by Category
- 6.2.1. Flavoured drink
- 6.2.2. Unflavored drink
- 6.3. Market Analysis, Insights and Forecast - by Distibution Channel
- 6.3.1. Supermarkets/hypermarkets
- 6.3.2. Convenience stores
- 6.3.3. Specialty Stores
- 6.3.4. Online Channels
- 6.3.5. Others
- 6.1. Market Analysis, Insights and Forecast - by Type
- 7. North America Dairy Drinks Industry Analysis, Insights and Forecast, 2020-2032
- 7.1. Market Analysis, Insights and Forecast - by Type
- 7.1.1. Milk
- 7.1.2. Yogurt
- 7.1.3. Kefir
- 7.1.4. Others
- 7.2. Market Analysis, Insights and Forecast - by Category
- 7.2.1. Flavoured drink
- 7.2.2. Unflavored drink
- 7.3. Market Analysis, Insights and Forecast - by Distibution Channel
- 7.3.1. Supermarkets/hypermarkets
- 7.3.2. Convenience stores
- 7.3.3. Specialty Stores
- 7.3.4. Online Channels
- 7.3.5. Others
- 7.1. Market Analysis, Insights and Forecast - by Type
- 8. Europe Dairy Drinks Industry Analysis, Insights and Forecast, 2020-2032
- 8.1. Market Analysis, Insights and Forecast - by Type
- 8.1.1. Milk
- 8.1.2. Yogurt
- 8.1.3. Kefir
- 8.1.4. Others
- 8.2. Market Analysis, Insights and Forecast - by Category
- 8.2.1. Flavoured drink
- 8.2.2. Unflavored drink
- 8.3. Market Analysis, Insights and Forecast - by Distibution Channel
- 8.3.1. Supermarkets/hypermarkets
- 8.3.2. Convenience stores
- 8.3.3. Specialty Stores
- 8.3.4. Online Channels
- 8.3.5. Others
- 8.1. Market Analysis, Insights and Forecast - by Type
- 9. Asia Pacific Dairy Drinks Industry Analysis, Insights and Forecast, 2020-2032
- 9.1. Market Analysis, Insights and Forecast - by Type
- 9.1.1. Milk
- 9.1.2. Yogurt
- 9.1.3. Kefir
- 9.1.4. Others
- 9.2. Market Analysis, Insights and Forecast - by Category
- 9.2.1. Flavoured drink
- 9.2.2. Unflavored drink
- 9.3. Market Analysis, Insights and Forecast - by Distibution Channel
- 9.3.1. Supermarkets/hypermarkets
- 9.3.2. Convenience stores
- 9.3.3. Specialty Stores
- 9.3.4. Online Channels
- 9.3.5. Others
- 9.1. Market Analysis, Insights and Forecast - by Type
- 10. South America Dairy Drinks Industry Analysis, Insights and Forecast, 2020-2032
- 10.1. Market Analysis, Insights and Forecast - by Type
- 10.1.1. Milk
- 10.1.2. Yogurt
- 10.1.3. Kefir
- 10.1.4. Others
- 10.2. Market Analysis, Insights and Forecast - by Category
- 10.2.1. Flavoured drink
- 10.2.2. Unflavored drink
- 10.3. Market Analysis, Insights and Forecast - by Distibution Channel
- 10.3.1. Supermarkets/hypermarkets
- 10.3.2. Convenience stores
- 10.3.3. Specialty Stores
- 10.3.4. Online Channels
- 10.3.5. Others
- 10.1. Market Analysis, Insights and Forecast - by Type
- 11. Middle East Dairy Drinks Industry Analysis, Insights and Forecast, 2020-2032
- 11.1. Market Analysis, Insights and Forecast - by Type
- 11.1.1. Milk
- 11.1.2. Yogurt
- 11.1.3. Kefir
- 11.1.4. Others
- 11.2. Market Analysis, Insights and Forecast - by Category
- 11.2.1. Flavoured drink
- 11.2.2. Unflavored drink
- 11.3. Market Analysis, Insights and Forecast - by Distibution Channel
- 11.3.1. Supermarkets/hypermarkets
- 11.3.2. Convenience stores
- 11.3.3. Specialty Stores
- 11.3.4. Online Channels
- 11.3.5. Others
- 11.1. Market Analysis, Insights and Forecast - by Type
- 12. South Africa Dairy Drinks Industry Analysis, Insights and Forecast, 2020-2032
- 12.1. Market Analysis, Insights and Forecast - by Type
- 12.1.1. Milk
- 12.1.2. Yogurt
- 12.1.3. Kefir
- 12.1.4. Others
- 12.2. Market Analysis, Insights and Forecast - by Category
- 12.2.1. Flavoured drink
- 12.2.2. Unflavored drink
- 12.3. Market Analysis, Insights and Forecast - by Distibution Channel
- 12.3.1. Supermarkets/hypermarkets
- 12.3.2. Convenience stores
- 12.3.3. Specialty Stores
- 12.3.4. Online Channels
- 12.3.5. Others
- 12.1. Market Analysis, Insights and Forecast - by Type
- 13. Competitive Analysis
- 13.1. Company Profiles
- 13.1.1 China Mengniu Dairy Company Limited*List Not Exhaustive
- 13.1.1.1. Company Overview
- 13.1.1.2. Products
- 13.1.1.3. Company Financials
- 13.1.1.4. SWOT Analysis
- 13.1.2 Schreiber Foods
- 13.1.2.1. Company Overview
- 13.1.2.2. Products
- 13.1.2.3. Company Financials
- 13.1.2.4. SWOT Analysis
- 13.1.3 Nestle SA
- 13.1.3.1. Company Overview
- 13.1.3.2. Products
- 13.1.3.3. Company Financials
- 13.1.3.4. SWOT Analysis
- 13.1.4 Arla Foods amba
- 13.1.4.1. Company Overview
- 13.1.4.2. Products
- 13.1.4.3. Company Financials
- 13.1.4.4. SWOT Analysis
- 13.1.5 Danone Groupe SA
- 13.1.5.1. Company Overview
- 13.1.5.2. Products
- 13.1.5.3. Company Financials
- 13.1.5.4. SWOT Analysis
- 13.1.6 Chr Hansen
- 13.1.6.1. Company Overview
- 13.1.6.2. Products
- 13.1.6.3. Company Financials
- 13.1.6.4. SWOT Analysis
- 13.1.7 Pillars
- 13.1.7.1. Company Overview
- 13.1.7.2. Products
- 13.1.7.3. Company Financials
- 13.1.7.4. SWOT Analysis
- 13.1.8 Morinaga Nutritional Foods Inc
- 13.1.8.1. Company Overview
- 13.1.8.2. Products
- 13.1.8.3. Company Financials
- 13.1.8.4. SWOT Analysis
- 13.1.9 Chobani LLC
- 13.1.9.1. Company Overview
- 13.1.9.2. Products
- 13.1.9.3. Company Financials
- 13.1.9.4. SWOT Analysis
- 13.1.1 China Mengniu Dairy Company Limited*List Not Exhaustive
- 13.2. Market Entropy
- 13.2.1 Company's Key Areas Served
- 13.2.2 Recent Developments
- 13.3. Company Market Share Analysis 2025
- 13.3.1 Top 5 Companies Market Share Analysis
- 13.3.2 Top 3 Companies Market Share Analysis
- 13.4. List of Potential Customers
- 14. Research Methodology
List of Figures
- Figure 1: Global Dairy Drinks Industry Revenue Breakdown (billion, %) by Region 2025 & 2033
- Figure 2: North America Dairy Drinks Industry Revenue (billion), by Type 2025 & 2033
- Figure 3: North America Dairy Drinks Industry Revenue Share (%), by Type 2025 & 2033
- Figure 4: North America Dairy Drinks Industry Revenue (billion), by Category 2025 & 2033
- Figure 5: North America Dairy Drinks Industry Revenue Share (%), by Category 2025 & 2033
- Figure 6: North America Dairy Drinks Industry Revenue (billion), by Distibution Channel 2025 & 2033
- Figure 7: North America Dairy Drinks Industry Revenue Share (%), by Distibution Channel 2025 & 2033
- Figure 8: North America Dairy Drinks Industry Revenue (billion), by Country 2025 & 2033
- Figure 9: North America Dairy Drinks Industry Revenue Share (%), by Country 2025 & 2033
- Figure 10: Europe Dairy Drinks Industry Revenue (billion), by Type 2025 & 2033
- Figure 11: Europe Dairy Drinks Industry Revenue Share (%), by Type 2025 & 2033
- Figure 12: Europe Dairy Drinks Industry Revenue (billion), by Category 2025 & 2033
- Figure 13: Europe Dairy Drinks Industry Revenue Share (%), by Category 2025 & 2033
- Figure 14: Europe Dairy Drinks Industry Revenue (billion), by Distibution Channel 2025 & 2033
- Figure 15: Europe Dairy Drinks Industry Revenue Share (%), by Distibution Channel 2025 & 2033
- Figure 16: Europe Dairy Drinks Industry Revenue (billion), by Country 2025 & 2033
- Figure 17: Europe Dairy Drinks Industry Revenue Share (%), by Country 2025 & 2033
- Figure 18: Asia Pacific Dairy Drinks Industry Revenue (billion), by Type 2025 & 2033
- Figure 19: Asia Pacific Dairy Drinks Industry Revenue Share (%), by Type 2025 & 2033
- Figure 20: Asia Pacific Dairy Drinks Industry Revenue (billion), by Category 2025 & 2033
- Figure 21: Asia Pacific Dairy Drinks Industry Revenue Share (%), by Category 2025 & 2033
- Figure 22: Asia Pacific Dairy Drinks Industry Revenue (billion), by Distibution Channel 2025 & 2033
- Figure 23: Asia Pacific Dairy Drinks Industry Revenue Share (%), by Distibution Channel 2025 & 2033
- Figure 24: Asia Pacific Dairy Drinks Industry Revenue (billion), by Country 2025 & 2033
- Figure 25: Asia Pacific Dairy Drinks Industry Revenue Share (%), by Country 2025 & 2033
- Figure 26: South America Dairy Drinks Industry Revenue (billion), by Type 2025 & 2033
- Figure 27: South America Dairy Drinks Industry Revenue Share (%), by Type 2025 & 2033
- Figure 28: South America Dairy Drinks Industry Revenue (billion), by Category 2025 & 2033
- Figure 29: South America Dairy Drinks Industry Revenue Share (%), by Category 2025 & 2033
- Figure 30: South America Dairy Drinks Industry Revenue (billion), by Distibution Channel 2025 & 2033
- Figure 31: South America Dairy Drinks Industry Revenue Share (%), by Distibution Channel 2025 & 2033
- Figure 32: South America Dairy Drinks Industry Revenue (billion), by Country 2025 & 2033
- Figure 33: South America Dairy Drinks Industry Revenue Share (%), by Country 2025 & 2033
- Figure 34: Middle East Dairy Drinks Industry Revenue (billion), by Type 2025 & 2033
- Figure 35: Middle East Dairy Drinks Industry Revenue Share (%), by Type 2025 & 2033
- Figure 36: Middle East Dairy Drinks Industry Revenue (billion), by Category 2025 & 2033
- Figure 37: Middle East Dairy Drinks Industry Revenue Share (%), by Category 2025 & 2033
- Figure 38: Middle East Dairy Drinks Industry Revenue (billion), by Distibution Channel 2025 & 2033
- Figure 39: Middle East Dairy Drinks Industry Revenue Share (%), by Distibution Channel 2025 & 2033
- Figure 40: Middle East Dairy Drinks Industry Revenue (billion), by Country 2025 & 2033
- Figure 41: Middle East Dairy Drinks Industry Revenue Share (%), by Country 2025 & 2033
- Figure 42: South Africa Dairy Drinks Industry Revenue (billion), by Type 2025 & 2033
- Figure 43: South Africa Dairy Drinks Industry Revenue Share (%), by Type 2025 & 2033
- Figure 44: South Africa Dairy Drinks Industry Revenue (billion), by Category 2025 & 2033
- Figure 45: South Africa Dairy Drinks Industry Revenue Share (%), by Category 2025 & 2033
- Figure 46: South Africa Dairy Drinks Industry Revenue (billion), by Distibution Channel 2025 & 2033
- Figure 47: South Africa Dairy Drinks Industry Revenue Share (%), by Distibution Channel 2025 & 2033
- Figure 48: South Africa Dairy Drinks Industry Revenue (billion), by Country 2025 & 2033
- Figure 49: South Africa Dairy Drinks Industry Revenue Share (%), by Country 2025 & 2033
List of Tables
- Table 1: Global Dairy Drinks Industry Revenue billion Forecast, by Type 2020 & 2033
- Table 2: Global Dairy Drinks Industry Revenue billion Forecast, by Category 2020 & 2033
- Table 3: Global Dairy Drinks Industry Revenue billion Forecast, by Distibution Channel 2020 & 2033
- Table 4: Global Dairy Drinks Industry Revenue billion Forecast, by Region 2020 & 2033
- Table 5: Global Dairy Drinks Industry Revenue billion Forecast, by Type 2020 & 2033
- Table 6: Global Dairy Drinks Industry Revenue billion Forecast, by Category 2020 & 2033
- Table 7: Global Dairy Drinks Industry Revenue billion Forecast, by Distibution Channel 2020 & 2033
- Table 8: Global Dairy Drinks Industry Revenue billion Forecast, by Country 2020 & 2033
- Table 9: United States Dairy Drinks Industry Revenue (billion) Forecast, by Application 2020 & 2033
- Table 10: Canada Dairy Drinks Industry Revenue (billion) Forecast, by Application 2020 & 2033
- Table 11: Mexico Dairy Drinks Industry Revenue (billion) Forecast, by Application 2020 & 2033
- Table 12: Rest of North America Dairy Drinks Industry Revenue (billion) Forecast, by Application 2020 & 2033
- Table 13: Global Dairy Drinks Industry Revenue billion Forecast, by Type 2020 & 2033
- Table 14: Global Dairy Drinks Industry Revenue billion Forecast, by Category 2020 & 2033
- Table 15: Global Dairy Drinks Industry Revenue billion Forecast, by Distibution Channel 2020 & 2033
- Table 16: Global Dairy Drinks Industry Revenue billion Forecast, by Country 2020 & 2033
- Table 17: United Kingdom Dairy Drinks Industry Revenue (billion) Forecast, by Application 2020 & 2033
- Table 18: Germany Dairy Drinks Industry Revenue (billion) Forecast, by Application 2020 & 2033
- Table 19: France Dairy Drinks Industry Revenue (billion) Forecast, by Application 2020 & 2033
- Table 20: Russia Dairy Drinks Industry Revenue (billion) Forecast, by Application 2020 & 2033
- Table 21: Italy Dairy Drinks Industry Revenue (billion) Forecast, by Application 2020 & 2033
- Table 22: Spain Dairy Drinks Industry Revenue (billion) Forecast, by Application 2020 & 2033
- Table 23: Rest of Europe Dairy Drinks Industry Revenue (billion) Forecast, by Application 2020 & 2033
- Table 24: Global Dairy Drinks Industry Revenue billion Forecast, by Type 2020 & 2033
- Table 25: Global Dairy Drinks Industry Revenue billion Forecast, by Category 2020 & 2033
- Table 26: Global Dairy Drinks Industry Revenue billion Forecast, by Distibution Channel 2020 & 2033
- Table 27: Global Dairy Drinks Industry Revenue billion Forecast, by Country 2020 & 2033
- Table 28: India Dairy Drinks Industry Revenue (billion) Forecast, by Application 2020 & 2033
- Table 29: China Dairy Drinks Industry Revenue (billion) Forecast, by Application 2020 & 2033
- Table 30: Japan Dairy Drinks Industry Revenue (billion) Forecast, by Application 2020 & 2033
- Table 31: Australia Dairy Drinks Industry Revenue (billion) Forecast, by Application 2020 & 2033
- Table 32: Rest of Asia Pacific Dairy Drinks Industry Revenue (billion) Forecast, by Application 2020 & 2033
- Table 33: Global Dairy Drinks Industry Revenue billion Forecast, by Type 2020 & 2033
- Table 34: Global Dairy Drinks Industry Revenue billion Forecast, by Category 2020 & 2033
- Table 35: Global Dairy Drinks Industry Revenue billion Forecast, by Distibution Channel 2020 & 2033
- Table 36: Global Dairy Drinks Industry Revenue billion Forecast, by Country 2020 & 2033
- Table 37: Brazil Dairy Drinks Industry Revenue (billion) Forecast, by Application 2020 & 2033
- Table 38: Argentina Dairy Drinks Industry Revenue (billion) Forecast, by Application 2020 & 2033
- Table 39: Rest of South America Dairy Drinks Industry Revenue (billion) Forecast, by Application 2020 & 2033
- Table 40: Global Dairy Drinks Industry Revenue billion Forecast, by Type 2020 & 2033
- Table 41: Global Dairy Drinks Industry Revenue billion Forecast, by Category 2020 & 2033
- Table 42: Global Dairy Drinks Industry Revenue billion Forecast, by Distibution Channel 2020 & 2033
- Table 43: Global Dairy Drinks Industry Revenue billion Forecast, by Country 2020 & 2033
- Table 44: Global Dairy Drinks Industry Revenue billion Forecast, by Type 2020 & 2033
- Table 45: Global Dairy Drinks Industry Revenue billion Forecast, by Category 2020 & 2033
- Table 46: Global Dairy Drinks Industry Revenue billion Forecast, by Distibution Channel 2020 & 2033
- Table 47: Global Dairy Drinks Industry Revenue billion Forecast, by Country 2020 & 2033
- Table 48: Saudi Arabia Dairy Drinks Industry Revenue (billion) Forecast, by Application 2020 & 2033
- Table 49: Rest of Middle East Dairy Drinks Industry Revenue (billion) Forecast, by Application 2020 & 2033
Frequently Asked Questions
1. What is the projected Compound Annual Growth Rate (CAGR) of the Dairy Drinks Industry?
The projected CAGR is approximately 6%.
2. Which companies are prominent players in the Dairy Drinks Industry?
Key companies in the market include China Mengniu Dairy Company Limited*List Not Exhaustive, Schreiber Foods, Nestle SA, Arla Foods amba, Danone Groupe SA, Chr Hansen, Pillars, Morinaga Nutritional Foods Inc, Chobani LLC.
3. What are the main segments of the Dairy Drinks Industry?
The market segments include Type, Category, Distibution Channel.
4. Can you provide details about the market size?
The market size is estimated to be USD 87.86 billion as of 2022.
5. What are some drivers contributing to market growth?
Growth In Foodservice Expenditure and Tourism Sector; Premiumization with the Growth of Fortified and Flavored Water.
6. What are the notable trends driving market growth?
Rising Demand for Drinkable Yogurt.
7. Are there any restraints impacting market growth?
Concerns Regarding Plastic Waste and the Rising Inclination Toward Tap Water.
8. Can you provide examples of recent developments in the market?
N/A
9. What pricing options are available for accessing the report?
Pricing options include single-user, multi-user, and enterprise licenses priced at USD 4750, USD 5250, and USD 8750 respectively.
10. Is the market size provided in terms of value or volume?
The market size is provided in terms of value, measured in billion.
11. Are there any specific market keywords associated with the report?
Yes, the market keyword associated with the report is "Dairy Drinks Industry," which aids in identifying and referencing the specific market segment covered.
12. How do I determine which pricing option suits my needs best?
The pricing options vary based on user requirements and access needs. Individual users may opt for single-user licenses, while businesses requiring broader access may choose multi-user or enterprise licenses for cost-effective access to the report.
13. Are there any additional resources or data provided in the Dairy Drinks Industry report?
While the report offers comprehensive insights, it's advisable to review the specific contents or supplementary materials provided to ascertain if additional resources or data are available.
14. How can I stay updated on further developments or reports in the Dairy Drinks Industry?
To stay informed about further developments, trends, and reports in the Dairy Drinks Industry, consider subscribing to industry newsletters, following relevant companies and organizations, or regularly checking reputable industry news sources and publications.
Methodology
Step 1 - Identification of Relevant Samples Size from Population Database


Step 2 - Approaches for Defining Global Market Size (Value, Volume* & Price*)

Note*: In applicable scenarios
Step 3 - Data Sources
Primary Research
- Web Analytics
- Survey Reports
- Research Institute
- Latest Research Reports
- Opinion Leaders
Secondary Research
- Annual Reports
- White Paper
- Latest Press Release
- Industry Association
- Paid Database
- Investor Presentations

Step 4 - Data Triangulation
Involves using different sources of information in order to increase the validity of a study
These sources are likely to be stakeholders in a program - participants, other researchers, program staff, other community members, and so on.
Then we put all data in single framework & apply various statistical tools to find out the dynamic on the market.
During the analysis stage, feedback from the stakeholder groups would be compared to determine areas of agreement as well as areas of divergence