

Key Insights
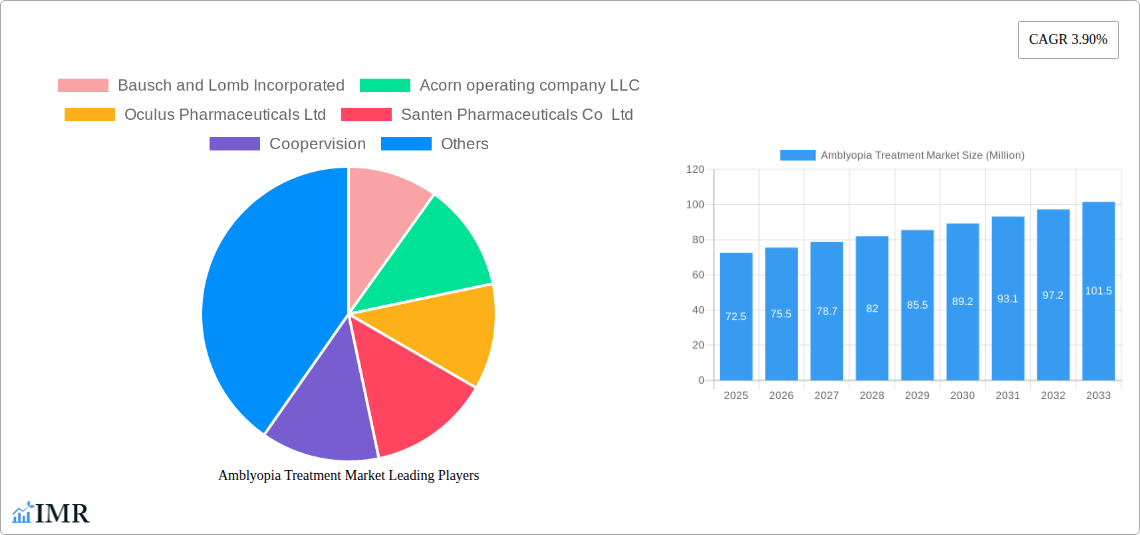
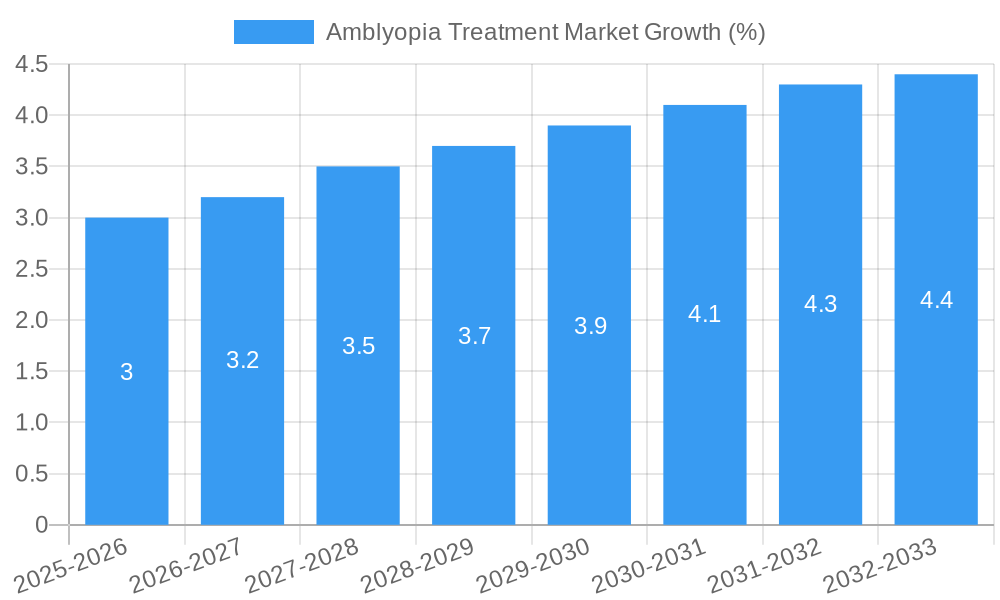
The amblyopia treatment market, valued at $72.5 million in 2025, is projected to experience steady growth, driven by increasing awareness of the condition and advancements in treatment technologies. A compound annual growth rate (CAGR) of 3.90% from 2025 to 2033 indicates a substantial market expansion over the forecast period. Key drivers include rising prevalence of amblyopia, particularly in pediatric populations, coupled with the development of more effective and less invasive treatment options. Technological advancements, such as improved patching methods, sophisticated vision therapy programs, and the exploration of pharmacological interventions, are further fueling market growth. While the market faces restraints such as high treatment costs and the potential for incomplete visual recovery in some cases, the overall outlook remains positive due to ongoing research and development efforts focused on enhancing treatment efficacy and accessibility. The market is segmented by treatment type (e.g., patching, penalization, vision therapy, surgical interventions), age group, and geography, with key players like Bausch + Lomb, CooperVision, and Santen Pharmaceuticals actively shaping market competition through product innovation and strategic partnerships.
The competitive landscape is characterized by a mix of established players and emerging companies focused on innovative solutions. The success of companies hinges on factors like product efficacy, market penetration strategies, and regulatory approvals. Future growth will likely depend on the continued development of personalized treatment plans, leveraging digital technologies for improved patient compliance and remote monitoring. Furthermore, expanded access to affordable and effective treatments in underserved regions will significantly contribute to market expansion. The historical period (2019-2024) likely showed a slightly lower growth rate than the projected CAGR, reflecting the time lag in adoption of new technologies and the impact of fluctuating healthcare spending. However, the consistent advancement in treatment methodologies and improved diagnostic capabilities suggest a sustained upward trajectory for the amblyopia treatment market in the coming years.
Amblyopia Treatment Market: A Comprehensive Report (2019-2033)
This comprehensive report provides a detailed analysis of the Amblyopia Treatment Market, encompassing market dynamics, growth trends, regional insights, product landscape, key players, and future outlook. With a study period spanning 2019-2033, a base year of 2025, and a forecast period of 2025-2033, this report serves as an invaluable resource for industry professionals, investors, and stakeholders seeking to understand and capitalize on this evolving market. The report analyzes the parent market of ophthalmic devices and the child market of amblyopia treatment, offering granular insights into market segmentation and competitive dynamics. The projected market value in 2025 is estimated at xx Million.
Amblyopia Treatment Market Dynamics & Structure
The Amblyopia Treatment Market is characterized by a moderately concentrated landscape, with key players such as Bausch and Lomb Incorporated, Acorn operating company LLC, Oculus Pharmaceuticals Ltd, and Santen Pharmaceuticals Co Ltd holding significant market share. The market is driven by technological innovations, particularly in digital therapeutics and virtual reality (VR) applications. Regulatory frameworks, varying across regions, influence treatment accessibility and market growth. Competitive product substitutes, such as patching and penalization, continue to exist, though digital therapies are gaining traction. The end-user demographics primarily comprise children and young adults, with a growing focus on early diagnosis and intervention. M&A activity within the sector remains moderate, with approximately xx deals recorded between 2019 and 2024. However, strategic partnerships and collaborations are increasingly prevalent, fostering innovation and market expansion.
- Market Concentration: Moderately concentrated, with top 5 players holding approximately xx% market share in 2025.
- Technological Innovation: Significant advancements in digital therapeutics and VR applications are driving market growth.
- Regulatory Landscape: Varying regulatory approval processes across different regions create challenges and opportunities.
- Competitive Substitutes: Traditional methods like patching and penalization continue to compete with newer digital therapies.
- End-User Demographics: Primarily children and young adults, emphasizing early detection and treatment.
- M&A Activity: Moderate M&A activity (xx deals between 2019-2024), with a rising trend in strategic partnerships.
Amblyopia Treatment Market Growth Trends & Insights
The Amblyopia Treatment Market exhibits a robust growth trajectory, driven by increasing awareness of amblyopia, advancements in treatment technologies, and rising healthcare expenditure. The market size experienced a CAGR of xx% during the historical period (2019-2024) and is projected to maintain a CAGR of xx% during the forecast period (2025-2033). This growth is further fueled by the rising adoption of digital therapeutics, which offer convenience and improved patient engagement. Consumer behavior shifts towards seeking technologically advanced and less invasive treatment options contribute to market expansion. Market penetration of digital therapies is projected to increase from xx% in 2025 to xx% by 2033. Technological disruptions, such as the integration of AI and machine learning, are expected to further enhance treatment efficacy and personalize therapeutic approaches.
Dominant Regions, Countries, or Segments in Amblyopia Treatment Market
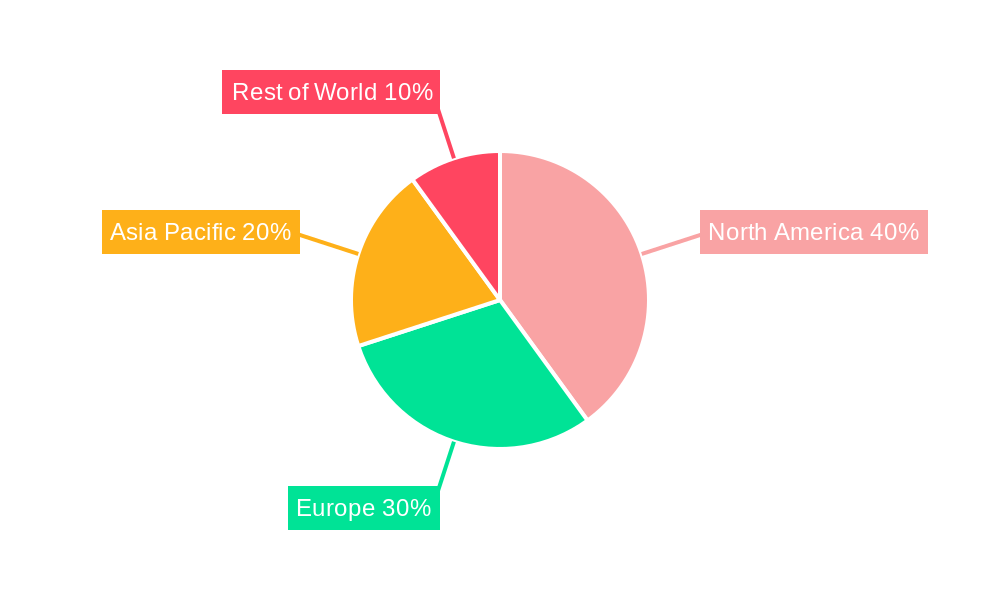
North America currently dominates the Amblyopia Treatment Market, driven by high healthcare expenditure, advanced healthcare infrastructure, and strong regulatory support. Europe follows as a significant market, while Asia-Pacific is poised for substantial growth, propelled by increasing awareness, rising disposable incomes, and expanding healthcare access. Within segments, digital therapeutics are experiencing the highest growth rates, owing to their effectiveness, convenience, and potential for remote monitoring.
- North America: High healthcare expenditure, robust infrastructure, and early adoption of new technologies.
- Europe: Strong regulatory framework and significant investment in healthcare innovation.
- Asia-Pacific: Rapidly growing market, fueled by rising disposable incomes and increasing healthcare awareness.
- Digital Therapeutics: Fastest-growing segment, driven by convenience, effectiveness, and remote monitoring capabilities.
Amblyopia Treatment Market Product Landscape
The Amblyopia Treatment Market offers a diverse range of products, including traditional methods like eye patches and penalization, along with advanced digital therapies like vision therapy software and VR applications. These newer digital solutions often incorporate gamification to enhance patient engagement and compliance. Key performance metrics focus on treatment efficacy, patient compliance, and overall visual acuity improvement. Unique selling propositions frequently center on improved patient experience, personalized treatment plans, and objective measures of treatment progress.
Key Drivers, Barriers & Challenges in Amblyopia Treatment Market
Key Drivers:
- Increasing prevalence of amblyopia, particularly in children.
- Technological advancements in digital therapies and VR applications.
- Rising healthcare expenditure and insurance coverage.
- Growing awareness among parents and healthcare professionals.
Key Challenges:
- High cost of advanced treatment options, limiting accessibility.
- Regulatory hurdles and approval processes for new technologies.
- Competition from established traditional treatments.
- Ensuring patient compliance with treatment regimens.
Emerging Opportunities in Amblyopia Treatment Market
- Expansion into untapped markets in developing countries.
- Development of AI-powered diagnostic tools for early detection.
- Personalized treatment approaches using advanced data analytics.
- Integration of telehealth platforms for remote monitoring and support.
Growth Accelerators in the Amblyopia Treatment Market Industry
Technological breakthroughs in AI, VR, and AR will play a key role in accelerating market growth. Strategic partnerships between technology companies and healthcare providers will expedite product development and market penetration. Expansion into emerging markets through increased awareness campaigns and affordable treatment options will further enhance market size.
Key Players Shaping the Amblyopia Treatment Market Market
- Bausch and Lomb Incorporated
- Acorn operating company LLC
- Oculus Pharmaceuticals Ltd
- Santen Pharmaceuticals Co Ltd
- Coopervision
- Frensel prism and lens Co
- Hilco Vision
- Good-Lite
- Vivid Vision Inc
- Krafty Eye patches
- Hoya Vision Care
- Orthopad USA
Notable Milestones in Amblyopia Treatment Market Sector
- October 2023: Bynocs launched AmblyGo, a vision therapy software program using 3D anaglyph glasses.
- January 2023: InnoJin Inc., Sumitomo Corporation, and ImaCreate Co. Ltd. partnered to develop a VR amblyopia treatment app.
In-Depth Amblyopia Treatment Market Outlook
The Amblyopia Treatment Market is poised for significant growth, driven by continuous technological advancements and a rising focus on early intervention. Strategic opportunities lie in developing cost-effective solutions, expanding into underserved markets, and fostering collaborative partnerships to accelerate innovation and improve treatment accessibility. The future market potential is substantial, with further expansion anticipated in digital therapeutics and personalized medicine.
Amblyopia Treatment Market Segmentation
-
1. Type
- 1.1. Strabismic Amblyopia
- 1.2. Refractive Ambylopia
- 1.3. Deprivation Amblyopia
-
2. Treatment Products
- 2.1. Eye Patches
- 2.2. Atropine Drops
- 2.3. Glasses
- 2.4. Video Games
Amblyopia Treatment Market Segmentation By Geography
-
1. North America
- 1.1. United States
- 1.2. Canada
- 1.3. Mexico
-
2. Europe
- 2.1. Germany
- 2.2. United Kingdom
- 2.3. France
- 2.4. Italy
- 2.5. Spain
- 2.6. Rest of Europe
-
3. Asia Pacific
- 3.1. China
- 3.2. Japan
- 3.3. India
- 3.4. Australia
- 3.5. South Korea
- 3.6. Rest of Asia Pacific
-
4. Middle East and Africa
- 4.1. GCC
- 4.2. South Africa
- 4.3. Rest of Middle East and Africa
-
5. South America
- 5.1. Brazil
- 5.2. Argentina
- 5.3. Rest of South America
Amblyopia Treatment Market REPORT HIGHLIGHTS
| Aspects | Details |
|---|---|
| Study Period | 2019-2033 |
| Base Year | 2024 |
| Estimated Year | 2025 |
| Forecast Period | 2025-2033 |
| Historical Period | 2019-2024 |
| Growth Rate | CAGR of 3.90% from 2019-2033 |
| Segmentation |
|
Table of Contents
- 1. Introduction
- 1.1. Research Scope
- 1.2. Market Segmentation
- 1.3. Research Methodology
- 1.4. Definitions and Assumptions
- 2. Executive Summary
- 2.1. Introduction
- 3. Market Dynamics
- 3.1. Introduction
- 3.2. Market Drivers
- 3.2.1. Rising Prevalence of Amblyopia; Increasing Technological Advancements for the Treatment of Amblyopia
- 3.3. Market Restrains
- 3.3.1. Rising Prevalence of Amblyopia; Increasing Technological Advancements for the Treatment of Amblyopia
- 3.4. Market Trends
- 3.4.1. The Strabismic Amblyopia Segment is Expected to Hold a Significant Market Share in the Amblyopia Treatment Market
- 4. Market Factor Analysis
- 4.1. Porters Five Forces
- 4.2. Supply/Value Chain
- 4.3. PESTEL analysis
- 4.4. Market Entropy
- 4.5. Patent/Trademark Analysis
- 5. Global Amblyopia Treatment Market Analysis, Insights and Forecast, 2019-2031
- 5.1. Market Analysis, Insights and Forecast - by Type
- 5.1.1. Strabismic Amblyopia
- 5.1.2. Refractive Ambylopia
- 5.1.3. Deprivation Amblyopia
- 5.2. Market Analysis, Insights and Forecast - by Treatment Products
- 5.2.1. Eye Patches
- 5.2.2. Atropine Drops
- 5.2.3. Glasses
- 5.2.4. Video Games
- 5.3. Market Analysis, Insights and Forecast - by Region
- 5.3.1. North America
- 5.3.2. Europe
- 5.3.3. Asia Pacific
- 5.3.4. Middle East and Africa
- 5.3.5. South America
- 5.1. Market Analysis, Insights and Forecast - by Type
- 6. North America Amblyopia Treatment Market Analysis, Insights and Forecast, 2019-2031
- 6.1. Market Analysis, Insights and Forecast - by Type
- 6.1.1. Strabismic Amblyopia
- 6.1.2. Refractive Ambylopia
- 6.1.3. Deprivation Amblyopia
- 6.2. Market Analysis, Insights and Forecast - by Treatment Products
- 6.2.1. Eye Patches
- 6.2.2. Atropine Drops
- 6.2.3. Glasses
- 6.2.4. Video Games
- 6.1. Market Analysis, Insights and Forecast - by Type
- 7. Europe Amblyopia Treatment Market Analysis, Insights and Forecast, 2019-2031
- 7.1. Market Analysis, Insights and Forecast - by Type
- 7.1.1. Strabismic Amblyopia
- 7.1.2. Refractive Ambylopia
- 7.1.3. Deprivation Amblyopia
- 7.2. Market Analysis, Insights and Forecast - by Treatment Products
- 7.2.1. Eye Patches
- 7.2.2. Atropine Drops
- 7.2.3. Glasses
- 7.2.4. Video Games
- 7.1. Market Analysis, Insights and Forecast - by Type
- 8. Asia Pacific Amblyopia Treatment Market Analysis, Insights and Forecast, 2019-2031
- 8.1. Market Analysis, Insights and Forecast - by Type
- 8.1.1. Strabismic Amblyopia
- 8.1.2. Refractive Ambylopia
- 8.1.3. Deprivation Amblyopia
- 8.2. Market Analysis, Insights and Forecast - by Treatment Products
- 8.2.1. Eye Patches
- 8.2.2. Atropine Drops
- 8.2.3. Glasses
- 8.2.4. Video Games
- 8.1. Market Analysis, Insights and Forecast - by Type
- 9. Middle East and Africa Amblyopia Treatment Market Analysis, Insights and Forecast, 2019-2031
- 9.1. Market Analysis, Insights and Forecast - by Type
- 9.1.1. Strabismic Amblyopia
- 9.1.2. Refractive Ambylopia
- 9.1.3. Deprivation Amblyopia
- 9.2. Market Analysis, Insights and Forecast - by Treatment Products
- 9.2.1. Eye Patches
- 9.2.2. Atropine Drops
- 9.2.3. Glasses
- 9.2.4. Video Games
- 9.1. Market Analysis, Insights and Forecast - by Type
- 10. South America Amblyopia Treatment Market Analysis, Insights and Forecast, 2019-2031
- 10.1. Market Analysis, Insights and Forecast - by Type
- 10.1.1. Strabismic Amblyopia
- 10.1.2. Refractive Ambylopia
- 10.1.3. Deprivation Amblyopia
- 10.2. Market Analysis, Insights and Forecast - by Treatment Products
- 10.2.1. Eye Patches
- 10.2.2. Atropine Drops
- 10.2.3. Glasses
- 10.2.4. Video Games
- 10.1. Market Analysis, Insights and Forecast - by Type
- 11. Competitive Analysis
- 11.1. Global Market Share Analysis 2024
- 11.2. Company Profiles
- 11.2.1 Bausch and Lomb Incorporated
- 11.2.1.1. Overview
- 11.2.1.2. Products
- 11.2.1.3. SWOT Analysis
- 11.2.1.4. Recent Developments
- 11.2.1.5. Financials (Based on Availability)
- 11.2.2 Acorn operating company LLC
- 11.2.2.1. Overview
- 11.2.2.2. Products
- 11.2.2.3. SWOT Analysis
- 11.2.2.4. Recent Developments
- 11.2.2.5. Financials (Based on Availability)
- 11.2.3 Oculus Pharmaceuticals Ltd
- 11.2.3.1. Overview
- 11.2.3.2. Products
- 11.2.3.3. SWOT Analysis
- 11.2.3.4. Recent Developments
- 11.2.3.5. Financials (Based on Availability)
- 11.2.4 Santen Pharmaceuticals Co Ltd
- 11.2.4.1. Overview
- 11.2.4.2. Products
- 11.2.4.3. SWOT Analysis
- 11.2.4.4. Recent Developments
- 11.2.4.5. Financials (Based on Availability)
- 11.2.5 Coopervision
- 11.2.5.1. Overview
- 11.2.5.2. Products
- 11.2.5.3. SWOT Analysis
- 11.2.5.4. Recent Developments
- 11.2.5.5. Financials (Based on Availability)
- 11.2.6 Frensel prism and lens Co
- 11.2.6.1. Overview
- 11.2.6.2. Products
- 11.2.6.3. SWOT Analysis
- 11.2.6.4. Recent Developments
- 11.2.6.5. Financials (Based on Availability)
- 11.2.7 Hilco Vision
- 11.2.7.1. Overview
- 11.2.7.2. Products
- 11.2.7.3. SWOT Analysis
- 11.2.7.4. Recent Developments
- 11.2.7.5. Financials (Based on Availability)
- 11.2.8 Good-Lite
- 11.2.8.1. Overview
- 11.2.8.2. Products
- 11.2.8.3. SWOT Analysis
- 11.2.8.4. Recent Developments
- 11.2.8.5. Financials (Based on Availability)
- 11.2.9 Vivid Vision Inc
- 11.2.9.1. Overview
- 11.2.9.2. Products
- 11.2.9.3. SWOT Analysis
- 11.2.9.4. Recent Developments
- 11.2.9.5. Financials (Based on Availability)
- 11.2.10 Krafty Eye patches
- 11.2.10.1. Overview
- 11.2.10.2. Products
- 11.2.10.3. SWOT Analysis
- 11.2.10.4. Recent Developments
- 11.2.10.5. Financials (Based on Availability)
- 11.2.11 Hoya Vision Care
- 11.2.11.1. Overview
- 11.2.11.2. Products
- 11.2.11.3. SWOT Analysis
- 11.2.11.4. Recent Developments
- 11.2.11.5. Financials (Based on Availability)
- 11.2.12 Orthopad USA*List Not Exhaustive
- 11.2.12.1. Overview
- 11.2.12.2. Products
- 11.2.12.3. SWOT Analysis
- 11.2.12.4. Recent Developments
- 11.2.12.5. Financials (Based on Availability)
- 11.2.1 Bausch and Lomb Incorporated
List of Figures
- Figure 1: Global Amblyopia Treatment Market Revenue Breakdown (Million, %) by Region 2024 & 2032
- Figure 2: Global Amblyopia Treatment Market Volume Breakdown (Million, %) by Region 2024 & 2032
- Figure 3: North America Amblyopia Treatment Market Revenue (Million), by Type 2024 & 2032
- Figure 4: North America Amblyopia Treatment Market Volume (Million), by Type 2024 & 2032
- Figure 5: North America Amblyopia Treatment Market Revenue Share (%), by Type 2024 & 2032
- Figure 6: North America Amblyopia Treatment Market Volume Share (%), by Type 2024 & 2032
- Figure 7: North America Amblyopia Treatment Market Revenue (Million), by Treatment Products 2024 & 2032
- Figure 8: North America Amblyopia Treatment Market Volume (Million), by Treatment Products 2024 & 2032
- Figure 9: North America Amblyopia Treatment Market Revenue Share (%), by Treatment Products 2024 & 2032
- Figure 10: North America Amblyopia Treatment Market Volume Share (%), by Treatment Products 2024 & 2032
- Figure 11: North America Amblyopia Treatment Market Revenue (Million), by Country 2024 & 2032
- Figure 12: North America Amblyopia Treatment Market Volume (Million), by Country 2024 & 2032
- Figure 13: North America Amblyopia Treatment Market Revenue Share (%), by Country 2024 & 2032
- Figure 14: North America Amblyopia Treatment Market Volume Share (%), by Country 2024 & 2032
- Figure 15: Europe Amblyopia Treatment Market Revenue (Million), by Type 2024 & 2032
- Figure 16: Europe Amblyopia Treatment Market Volume (Million), by Type 2024 & 2032
- Figure 17: Europe Amblyopia Treatment Market Revenue Share (%), by Type 2024 & 2032
- Figure 18: Europe Amblyopia Treatment Market Volume Share (%), by Type 2024 & 2032
- Figure 19: Europe Amblyopia Treatment Market Revenue (Million), by Treatment Products 2024 & 2032
- Figure 20: Europe Amblyopia Treatment Market Volume (Million), by Treatment Products 2024 & 2032
- Figure 21: Europe Amblyopia Treatment Market Revenue Share (%), by Treatment Products 2024 & 2032
- Figure 22: Europe Amblyopia Treatment Market Volume Share (%), by Treatment Products 2024 & 2032
- Figure 23: Europe Amblyopia Treatment Market Revenue (Million), by Country 2024 & 2032
- Figure 24: Europe Amblyopia Treatment Market Volume (Million), by Country 2024 & 2032
- Figure 25: Europe Amblyopia Treatment Market Revenue Share (%), by Country 2024 & 2032
- Figure 26: Europe Amblyopia Treatment Market Volume Share (%), by Country 2024 & 2032
- Figure 27: Asia Pacific Amblyopia Treatment Market Revenue (Million), by Type 2024 & 2032
- Figure 28: Asia Pacific Amblyopia Treatment Market Volume (Million), by Type 2024 & 2032
- Figure 29: Asia Pacific Amblyopia Treatment Market Revenue Share (%), by Type 2024 & 2032
- Figure 30: Asia Pacific Amblyopia Treatment Market Volume Share (%), by Type 2024 & 2032
- Figure 31: Asia Pacific Amblyopia Treatment Market Revenue (Million), by Treatment Products 2024 & 2032
- Figure 32: Asia Pacific Amblyopia Treatment Market Volume (Million), by Treatment Products 2024 & 2032
- Figure 33: Asia Pacific Amblyopia Treatment Market Revenue Share (%), by Treatment Products 2024 & 2032
- Figure 34: Asia Pacific Amblyopia Treatment Market Volume Share (%), by Treatment Products 2024 & 2032
- Figure 35: Asia Pacific Amblyopia Treatment Market Revenue (Million), by Country 2024 & 2032
- Figure 36: Asia Pacific Amblyopia Treatment Market Volume (Million), by Country 2024 & 2032
- Figure 37: Asia Pacific Amblyopia Treatment Market Revenue Share (%), by Country 2024 & 2032
- Figure 38: Asia Pacific Amblyopia Treatment Market Volume Share (%), by Country 2024 & 2032
- Figure 39: Middle East and Africa Amblyopia Treatment Market Revenue (Million), by Type 2024 & 2032
- Figure 40: Middle East and Africa Amblyopia Treatment Market Volume (Million), by Type 2024 & 2032
- Figure 41: Middle East and Africa Amblyopia Treatment Market Revenue Share (%), by Type 2024 & 2032
- Figure 42: Middle East and Africa Amblyopia Treatment Market Volume Share (%), by Type 2024 & 2032
- Figure 43: Middle East and Africa Amblyopia Treatment Market Revenue (Million), by Treatment Products 2024 & 2032
- Figure 44: Middle East and Africa Amblyopia Treatment Market Volume (Million), by Treatment Products 2024 & 2032
- Figure 45: Middle East and Africa Amblyopia Treatment Market Revenue Share (%), by Treatment Products 2024 & 2032
- Figure 46: Middle East and Africa Amblyopia Treatment Market Volume Share (%), by Treatment Products 2024 & 2032
- Figure 47: Middle East and Africa Amblyopia Treatment Market Revenue (Million), by Country 2024 & 2032
- Figure 48: Middle East and Africa Amblyopia Treatment Market Volume (Million), by Country 2024 & 2032
- Figure 49: Middle East and Africa Amblyopia Treatment Market Revenue Share (%), by Country 2024 & 2032
- Figure 50: Middle East and Africa Amblyopia Treatment Market Volume Share (%), by Country 2024 & 2032
- Figure 51: South America Amblyopia Treatment Market Revenue (Million), by Type 2024 & 2032
- Figure 52: South America Amblyopia Treatment Market Volume (Million), by Type 2024 & 2032
- Figure 53: South America Amblyopia Treatment Market Revenue Share (%), by Type 2024 & 2032
- Figure 54: South America Amblyopia Treatment Market Volume Share (%), by Type 2024 & 2032
- Figure 55: South America Amblyopia Treatment Market Revenue (Million), by Treatment Products 2024 & 2032
- Figure 56: South America Amblyopia Treatment Market Volume (Million), by Treatment Products 2024 & 2032
- Figure 57: South America Amblyopia Treatment Market Revenue Share (%), by Treatment Products 2024 & 2032
- Figure 58: South America Amblyopia Treatment Market Volume Share (%), by Treatment Products 2024 & 2032
- Figure 59: South America Amblyopia Treatment Market Revenue (Million), by Country 2024 & 2032
- Figure 60: South America Amblyopia Treatment Market Volume (Million), by Country 2024 & 2032
- Figure 61: South America Amblyopia Treatment Market Revenue Share (%), by Country 2024 & 2032
- Figure 62: South America Amblyopia Treatment Market Volume Share (%), by Country 2024 & 2032
List of Tables
- Table 1: Global Amblyopia Treatment Market Revenue Million Forecast, by Region 2019 & 2032
- Table 2: Global Amblyopia Treatment Market Volume Million Forecast, by Region 2019 & 2032
- Table 3: Global Amblyopia Treatment Market Revenue Million Forecast, by Type 2019 & 2032
- Table 4: Global Amblyopia Treatment Market Volume Million Forecast, by Type 2019 & 2032
- Table 5: Global Amblyopia Treatment Market Revenue Million Forecast, by Treatment Products 2019 & 2032
- Table 6: Global Amblyopia Treatment Market Volume Million Forecast, by Treatment Products 2019 & 2032
- Table 7: Global Amblyopia Treatment Market Revenue Million Forecast, by Region 2019 & 2032
- Table 8: Global Amblyopia Treatment Market Volume Million Forecast, by Region 2019 & 2032
- Table 9: Global Amblyopia Treatment Market Revenue Million Forecast, by Type 2019 & 2032
- Table 10: Global Amblyopia Treatment Market Volume Million Forecast, by Type 2019 & 2032
- Table 11: Global Amblyopia Treatment Market Revenue Million Forecast, by Treatment Products 2019 & 2032
- Table 12: Global Amblyopia Treatment Market Volume Million Forecast, by Treatment Products 2019 & 2032
- Table 13: Global Amblyopia Treatment Market Revenue Million Forecast, by Country 2019 & 2032
- Table 14: Global Amblyopia Treatment Market Volume Million Forecast, by Country 2019 & 2032
- Table 15: United States Amblyopia Treatment Market Revenue (Million) Forecast, by Application 2019 & 2032
- Table 16: United States Amblyopia Treatment Market Volume (Million) Forecast, by Application 2019 & 2032
- Table 17: Canada Amblyopia Treatment Market Revenue (Million) Forecast, by Application 2019 & 2032
- Table 18: Canada Amblyopia Treatment Market Volume (Million) Forecast, by Application 2019 & 2032
- Table 19: Mexico Amblyopia Treatment Market Revenue (Million) Forecast, by Application 2019 & 2032
- Table 20: Mexico Amblyopia Treatment Market Volume (Million) Forecast, by Application 2019 & 2032
- Table 21: Global Amblyopia Treatment Market Revenue Million Forecast, by Type 2019 & 2032
- Table 22: Global Amblyopia Treatment Market Volume Million Forecast, by Type 2019 & 2032
- Table 23: Global Amblyopia Treatment Market Revenue Million Forecast, by Treatment Products 2019 & 2032
- Table 24: Global Amblyopia Treatment Market Volume Million Forecast, by Treatment Products 2019 & 2032
- Table 25: Global Amblyopia Treatment Market Revenue Million Forecast, by Country 2019 & 2032
- Table 26: Global Amblyopia Treatment Market Volume Million Forecast, by Country 2019 & 2032
- Table 27: Germany Amblyopia Treatment Market Revenue (Million) Forecast, by Application 2019 & 2032
- Table 28: Germany Amblyopia Treatment Market Volume (Million) Forecast, by Application 2019 & 2032
- Table 29: United Kingdom Amblyopia Treatment Market Revenue (Million) Forecast, by Application 2019 & 2032
- Table 30: United Kingdom Amblyopia Treatment Market Volume (Million) Forecast, by Application 2019 & 2032
- Table 31: France Amblyopia Treatment Market Revenue (Million) Forecast, by Application 2019 & 2032
- Table 32: France Amblyopia Treatment Market Volume (Million) Forecast, by Application 2019 & 2032
- Table 33: Italy Amblyopia Treatment Market Revenue (Million) Forecast, by Application 2019 & 2032
- Table 34: Italy Amblyopia Treatment Market Volume (Million) Forecast, by Application 2019 & 2032
- Table 35: Spain Amblyopia Treatment Market Revenue (Million) Forecast, by Application 2019 & 2032
- Table 36: Spain Amblyopia Treatment Market Volume (Million) Forecast, by Application 2019 & 2032
- Table 37: Rest of Europe Amblyopia Treatment Market Revenue (Million) Forecast, by Application 2019 & 2032
- Table 38: Rest of Europe Amblyopia Treatment Market Volume (Million) Forecast, by Application 2019 & 2032
- Table 39: Global Amblyopia Treatment Market Revenue Million Forecast, by Type 2019 & 2032
- Table 40: Global Amblyopia Treatment Market Volume Million Forecast, by Type 2019 & 2032
- Table 41: Global Amblyopia Treatment Market Revenue Million Forecast, by Treatment Products 2019 & 2032
- Table 42: Global Amblyopia Treatment Market Volume Million Forecast, by Treatment Products 2019 & 2032
- Table 43: Global Amblyopia Treatment Market Revenue Million Forecast, by Country 2019 & 2032
- Table 44: Global Amblyopia Treatment Market Volume Million Forecast, by Country 2019 & 2032
- Table 45: China Amblyopia Treatment Market Revenue (Million) Forecast, by Application 2019 & 2032
- Table 46: China Amblyopia Treatment Market Volume (Million) Forecast, by Application 2019 & 2032
- Table 47: Japan Amblyopia Treatment Market Revenue (Million) Forecast, by Application 2019 & 2032
- Table 48: Japan Amblyopia Treatment Market Volume (Million) Forecast, by Application 2019 & 2032
- Table 49: India Amblyopia Treatment Market Revenue (Million) Forecast, by Application 2019 & 2032
- Table 50: India Amblyopia Treatment Market Volume (Million) Forecast, by Application 2019 & 2032
- Table 51: Australia Amblyopia Treatment Market Revenue (Million) Forecast, by Application 2019 & 2032
- Table 52: Australia Amblyopia Treatment Market Volume (Million) Forecast, by Application 2019 & 2032
- Table 53: South Korea Amblyopia Treatment Market Revenue (Million) Forecast, by Application 2019 & 2032
- Table 54: South Korea Amblyopia Treatment Market Volume (Million) Forecast, by Application 2019 & 2032
- Table 55: Rest of Asia Pacific Amblyopia Treatment Market Revenue (Million) Forecast, by Application 2019 & 2032
- Table 56: Rest of Asia Pacific Amblyopia Treatment Market Volume (Million) Forecast, by Application 2019 & 2032
- Table 57: Global Amblyopia Treatment Market Revenue Million Forecast, by Type 2019 & 2032
- Table 58: Global Amblyopia Treatment Market Volume Million Forecast, by Type 2019 & 2032
- Table 59: Global Amblyopia Treatment Market Revenue Million Forecast, by Treatment Products 2019 & 2032
- Table 60: Global Amblyopia Treatment Market Volume Million Forecast, by Treatment Products 2019 & 2032
- Table 61: Global Amblyopia Treatment Market Revenue Million Forecast, by Country 2019 & 2032
- Table 62: Global Amblyopia Treatment Market Volume Million Forecast, by Country 2019 & 2032
- Table 63: GCC Amblyopia Treatment Market Revenue (Million) Forecast, by Application 2019 & 2032
- Table 64: GCC Amblyopia Treatment Market Volume (Million) Forecast, by Application 2019 & 2032
- Table 65: South Africa Amblyopia Treatment Market Revenue (Million) Forecast, by Application 2019 & 2032
- Table 66: South Africa Amblyopia Treatment Market Volume (Million) Forecast, by Application 2019 & 2032
- Table 67: Rest of Middle East and Africa Amblyopia Treatment Market Revenue (Million) Forecast, by Application 2019 & 2032
- Table 68: Rest of Middle East and Africa Amblyopia Treatment Market Volume (Million) Forecast, by Application 2019 & 2032
- Table 69: Global Amblyopia Treatment Market Revenue Million Forecast, by Type 2019 & 2032
- Table 70: Global Amblyopia Treatment Market Volume Million Forecast, by Type 2019 & 2032
- Table 71: Global Amblyopia Treatment Market Revenue Million Forecast, by Treatment Products 2019 & 2032
- Table 72: Global Amblyopia Treatment Market Volume Million Forecast, by Treatment Products 2019 & 2032
- Table 73: Global Amblyopia Treatment Market Revenue Million Forecast, by Country 2019 & 2032
- Table 74: Global Amblyopia Treatment Market Volume Million Forecast, by Country 2019 & 2032
- Table 75: Brazil Amblyopia Treatment Market Revenue (Million) Forecast, by Application 2019 & 2032
- Table 76: Brazil Amblyopia Treatment Market Volume (Million) Forecast, by Application 2019 & 2032
- Table 77: Argentina Amblyopia Treatment Market Revenue (Million) Forecast, by Application 2019 & 2032
- Table 78: Argentina Amblyopia Treatment Market Volume (Million) Forecast, by Application 2019 & 2032
- Table 79: Rest of South America Amblyopia Treatment Market Revenue (Million) Forecast, by Application 2019 & 2032
- Table 80: Rest of South America Amblyopia Treatment Market Volume (Million) Forecast, by Application 2019 & 2032
Frequently Asked Questions
1. What is the projected Compound Annual Growth Rate (CAGR) of the Amblyopia Treatment Market?
The projected CAGR is approximately 3.90%.
2. Which companies are prominent players in the Amblyopia Treatment Market?
Key companies in the market include Bausch and Lomb Incorporated, Acorn operating company LLC, Oculus Pharmaceuticals Ltd, Santen Pharmaceuticals Co Ltd, Coopervision, Frensel prism and lens Co, Hilco Vision, Good-Lite, Vivid Vision Inc, Krafty Eye patches, Hoya Vision Care, Orthopad USA*List Not Exhaustive.
3. What are the main segments of the Amblyopia Treatment Market?
The market segments include Type, Treatment Products.
4. Can you provide details about the market size?
The market size is estimated to be USD 72.5 Million as of 2022.
5. What are some drivers contributing to market growth?
Rising Prevalence of Amblyopia; Increasing Technological Advancements for the Treatment of Amblyopia.
6. What are the notable trends driving market growth?
The Strabismic Amblyopia Segment is Expected to Hold a Significant Market Share in the Amblyopia Treatment Market.
7. Are there any restraints impacting market growth?
Rising Prevalence of Amblyopia; Increasing Technological Advancements for the Treatment of Amblyopia.
8. Can you provide examples of recent developments in the market?
October 2023: Bynocs, a company that offers lazy eye treatment therapies, launched a vision therapy software program (AmblyGo) to treat amblyopia in the form of tailored computer games. The patient plays the games with both eyes open while wearing special 3D anaglyph glasses (with different color lenses) for 30 minutes over 30 sessions.
9. What pricing options are available for accessing the report?
Pricing options include single-user, multi-user, and enterprise licenses priced at USD 4750, USD 5250, and USD 8750 respectively.
10. Is the market size provided in terms of value or volume?
The market size is provided in terms of value, measured in Million and volume, measured in Million.
11. Are there any specific market keywords associated with the report?
Yes, the market keyword associated with the report is "Amblyopia Treatment Market," which aids in identifying and referencing the specific market segment covered.
12. How do I determine which pricing option suits my needs best?
The pricing options vary based on user requirements and access needs. Individual users may opt for single-user licenses, while businesses requiring broader access may choose multi-user or enterprise licenses for cost-effective access to the report.
13. Are there any additional resources or data provided in the Amblyopia Treatment Market report?
While the report offers comprehensive insights, it's advisable to review the specific contents or supplementary materials provided to ascertain if additional resources or data are available.
14. How can I stay updated on further developments or reports in the Amblyopia Treatment Market?
To stay informed about further developments, trends, and reports in the Amblyopia Treatment Market, consider subscribing to industry newsletters, following relevant companies and organizations, or regularly checking reputable industry news sources and publications.
Methodology
Step 1 - Identification of Relevant Samples Size from Population Database


Step 2 - Approaches for Defining Global Market Size (Value, Volume* & Price*)

Note*: In applicable scenarios
Step 3 - Data Sources
Primary Research
- Web Analytics
- Survey Reports
- Research Institute
- Latest Research Reports
- Opinion Leaders
Secondary Research
- Annual Reports
- White Paper
- Latest Press Release
- Industry Association
- Paid Database
- Investor Presentations

Step 4 - Data Triangulation
Involves using different sources of information in order to increase the validity of a study
These sources are likely to be stakeholders in a program - participants, other researchers, program staff, other community members, and so on.
Then we put all data in single framework & apply various statistical tools to find out the dynamic on the market.
During the analysis stage, feedback from the stakeholder groups would be compared to determine areas of agreement as well as areas of divergence
