

Key Insights
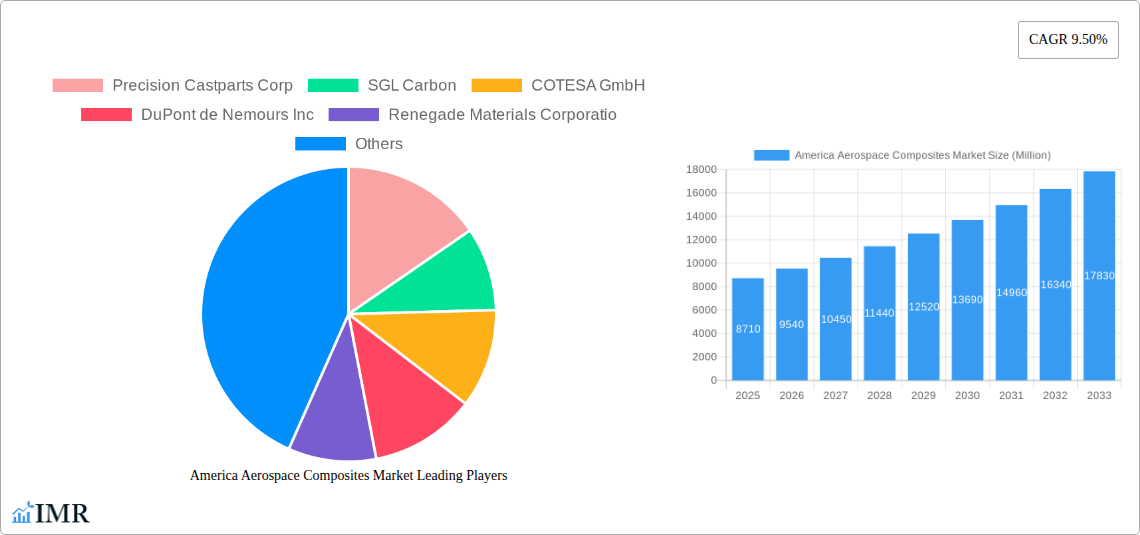
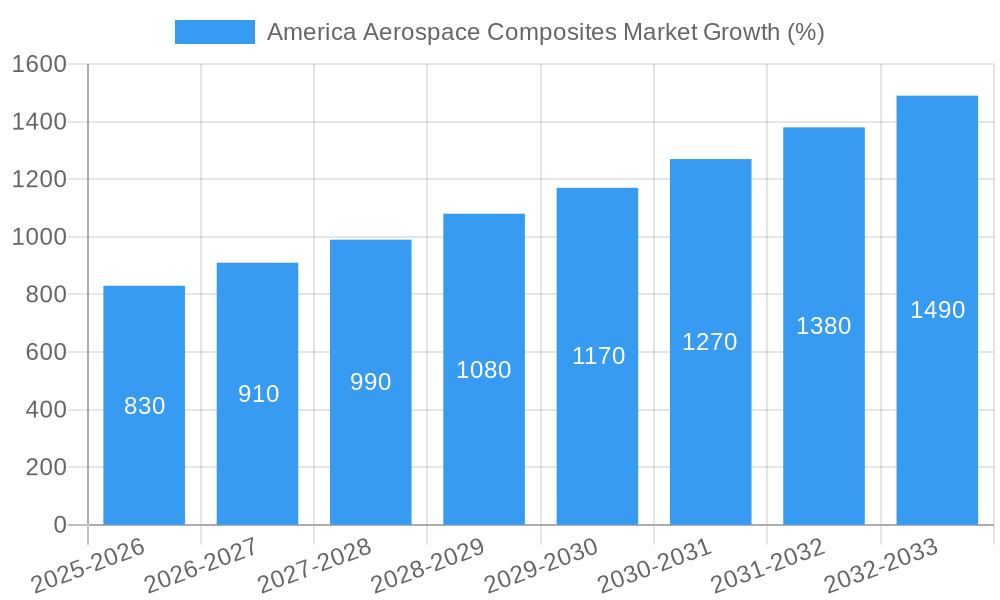
The North American aerospace composites market, valued at $8.71 billion in 2025, is projected to experience robust growth, driven by the increasing demand for lightweight and high-strength materials in commercial and military aircraft. A Compound Annual Growth Rate (CAGR) of 9.50% from 2025 to 2033 indicates a significant expansion, fueled by factors such as the rising adoption of fuel-efficient aircraft designs and the ongoing development of advanced composite materials with enhanced properties. Key application segments include commercial aircraft, military aircraft, general aviation aircraft, and the burgeoning space exploration sector. Leading companies like Precision Castparts Corp, SGL Carbon, and Hexcel Corporation are driving innovation and expanding their market share through strategic partnerships and technological advancements. The market's growth is further supported by government initiatives promoting aerospace technology and the continuous need for lighter, more durable aircraft components. While potential supply chain constraints and material cost fluctuations could pose challenges, the overall market outlook remains positive.
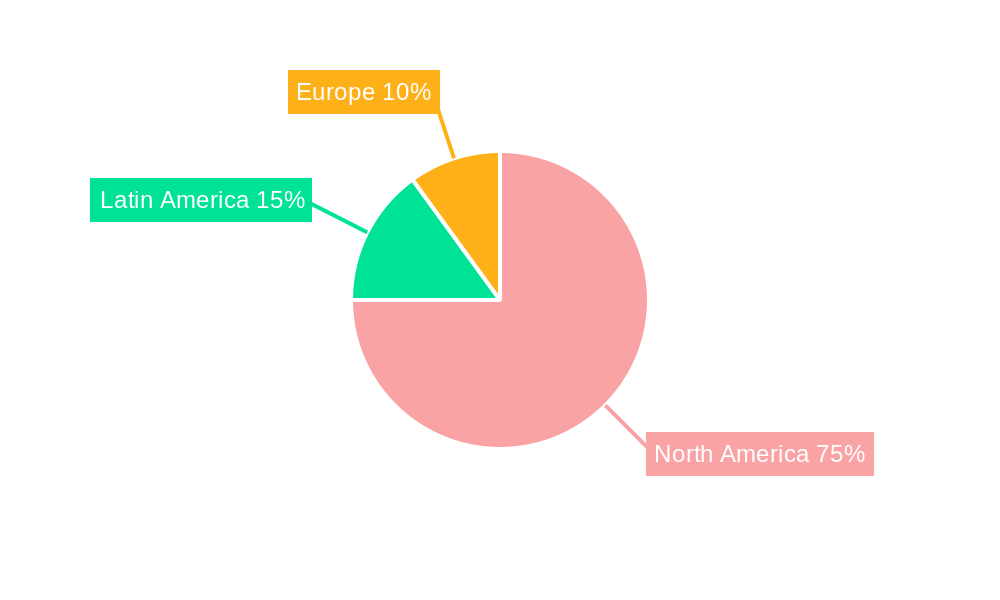
Growth within the North American Aerospace Composites Market is geographically concentrated, with the United States and Canada leading the way, reflecting a strong domestic aerospace manufacturing base and significant investment in research and development. Latin America, particularly Mexico and Brazil, are also exhibiting growth potential, driven by increased regional air travel and a rising demand for advanced aerospace technologies. The forecast period (2025-2033) anticipates continued expansion across all segments, driven by technological advancements in composite materials, increasing production capacity, and sustained government support for aerospace manufacturing and innovation. The diverse applications across commercial, military, and space sectors ensure the market's resilience and offer numerous growth opportunities for existing and emerging players. Strategic alliances and technological partnerships will continue to shape the competitive landscape.
This comprehensive report provides an in-depth analysis of the America Aerospace Composites Market, offering invaluable insights for industry professionals, investors, and strategic decision-makers. The report covers the period from 2019 to 2033, with a base year of 2025 and a forecast period from 2025 to 2033. The market is segmented by application (Commercial Aircraft, Military Aircraft, General Aviation Aircraft, Space) and key players include Precision Castparts Corp, SGL Carbon, COTESA GmbH, DuPont de Nemours Inc, Renegade Materials Corporation, Solvay SA, Hexcel Corporation, Materion Corporation, and EKISUI CHEMICAL CO LTD. The total market size in 2025 is estimated at XX Million units.
America Aerospace Composites Market Market Dynamics & Structure
The America Aerospace Composites market is characterized by moderate concentration, with a few major players holding significant market share. Technological innovation, driven by the need for lighter, stronger, and more fuel-efficient aircraft, is a primary growth driver. Stringent regulatory frameworks regarding material safety and environmental impact influence market dynamics. Competitive substitutes, such as traditional metallic materials, continue to exert pressure, although the advantages of composites in terms of weight and performance are increasingly offsetting this. The end-user demographic is largely dominated by aerospace manufacturers and defense contractors. Mergers and acquisitions (M&A) activity has been relatively steady, with larger players consolidating their market position through acquisitions of smaller, specialized companies.
- Market Concentration: Moderately concentrated, with the top 5 players holding approximately xx% of the market share in 2025.
- Technological Innovation: Focus on advanced materials like carbon fiber reinforced polymers (CFRP) and high-performance thermoplastic composites.
- Regulatory Framework: Stringent safety and environmental regulations impacting material selection and manufacturing processes.
- Competitive Substitutes: Metallic materials remain a significant competitor, but composite advantages in weight and performance are driving substitution.
- End-User Demographics: Primarily aerospace manufacturers (both commercial and military) and government agencies.
- M&A Trends: Steady M&A activity, with xx major deals recorded between 2019 and 2024.
America Aerospace Composites Market Growth Trends & Insights
The America Aerospace Composites market has witnessed consistent growth over the historical period (2019-2024), primarily driven by the increasing demand for fuel-efficient aircraft and the rising adoption of composites in new aircraft designs. The market is expected to maintain a robust Compound Annual Growth Rate (CAGR) of xx% during the forecast period (2025-2033). This growth is fueled by technological advancements leading to improved material properties and manufacturing techniques, coupled with a rising preference for lightweight and high-strength materials in aerospace applications. Consumer behavior shifts, particularly the preference for sustainable and environmentally friendly options, are also influencing market trends. Market penetration is expected to reach xx% by 2033, reflecting the growing adoption of composite materials across various aerospace segments. The introduction of new materials and manufacturing techniques has spurred further innovation in areas such as additive manufacturing and nanocomposites, enhancing the market's future outlook.
Dominant Regions, Countries, or Segments in America Aerospace Composites Market
The Commercial Aircraft segment is currently the dominant application area within the America Aerospace Composites market, accounting for approximately xx% of the market share in 2025. This dominance stems from the significant demand for fuel-efficient aircraft, where composites offer substantial weight reduction benefits and improved aerodynamic performance.
- Key Drivers for Commercial Aircraft Segment Dominance:
- High demand for fuel-efficient aircraft, leading to increased composite material adoption.
- Continuous technological advancements improving the performance and cost-effectiveness of composites.
- Favorable government policies and incentives promoting the use of advanced materials in aerospace.
- Growth Potential: The Commercial Aircraft segment is projected to maintain its leadership position, driven by the expanding global air travel market and ongoing investments in new aircraft programs. Further growth is expected from the increasing adoption of composite materials in next-generation aircraft designs.
America Aerospace Composites Market Product Landscape
The America Aerospace Composites market showcases a diverse range of products, including carbon fiber reinforced polymers (CFRP), glass fiber reinforced polymers (GFRP), and other advanced composite materials. These materials offer a unique combination of high strength-to-weight ratio, stiffness, and durability, making them ideal for various aerospace applications. Continuous innovations focus on enhancing material properties, improving manufacturing processes, and exploring novel composite structures to meet the evolving demands of the industry. Unique selling propositions often involve enhanced toughness, fatigue resistance, and damage tolerance characteristics, coupled with lighter weight and improved fuel efficiency for the final aircraft.
Key Drivers, Barriers & Challenges in America Aerospace Composites Market
Key Drivers: The primary drivers include the increasing demand for lightweight and high-strength materials in aerospace applications, advancements in composite material technology, and stringent regulatory requirements aimed at improving fuel efficiency and reducing emissions. Government investments in research and development further stimulate market growth.
Challenges & Restraints: High manufacturing costs associated with composite materials, supply chain complexities, and the potential for material degradation and damage during aircraft operation pose significant challenges. Stringent regulatory approvals and certifications add to the complexities, with a xx% failure rate for new composite material certifications impacting timelines and profitability.
Emerging Opportunities in America Aerospace Composites Market
Emerging opportunities exist in the development of novel composite materials with enhanced performance characteristics, the expansion into new aerospace applications like unmanned aerial vehicles (UAVs) and hypersonic vehicles, and the utilization of sustainable and recyclable composites to meet environmental concerns. Growing demand from the space exploration industry also provides significant growth potential.
Growth Accelerators in the America Aerospace Composites Market Industry
Technological advancements in materials science, such as the development of self-healing composites and advanced manufacturing techniques like 3D printing, are crucial growth catalysts. Strategic partnerships between materials suppliers, aerospace manufacturers, and research institutions foster innovation and accelerate market expansion. Government incentives and funding for research and development initiatives further support the long-term growth of this sector.
Key Players Shaping the America Aerospace Composites Market Market
- Precision Castparts Corp
- SGL Carbon
- COTESA GmbH
- DuPont de Nemours Inc
- Renegade Materials Corporation
- Solvay SA
- Hexcel Corporation
- Materion Corporation
- EKISUI CHEMICAL CO LTD
Notable Milestones in America Aerospace Composites Market Sector
- 2020: Introduction of a new generation of CFRP with improved fatigue resistance by Hexcel Corporation.
- 2022: Acquisition of a smaller composite manufacturer by Solvay SA, expanding its market presence.
- 2023: Successful flight testing of a new aircraft incorporating advanced thermoplastic composites.
- 2024: Launch of a new government initiative promoting sustainable aerospace composite materials.
In-Depth America Aerospace Composites Market Market Outlook
The America Aerospace Composites market is poised for continued growth, driven by ongoing technological advancements, the increasing adoption of composites in new aircraft designs, and the expanding global aerospace industry. Strategic partnerships, investments in research and development, and supportive government policies will further accelerate market expansion. The long-term outlook is positive, with significant opportunities for both established players and new entrants. The market is expected to continue to evolve with greater emphasis on sustainability and the development of more advanced, high-performance materials.
America Aerospace Composites Market Segmentation
- 1. Production Analysis
- 2. Consumption Analysis
- 3. Import Market Analysis (Value & Volume)
- 4. Export Market Analysis (Value & Volume)
- 5. Price Trend Analysis
America Aerospace Composites Market Segmentation By Geography
-
1. North America
- 1.1. United States
- 1.2. Canada
- 1.3. Mexico
-
2. South America
- 2.1. Brazil
- 2.2. Argentina
- 2.3. Rest of South America
-
3. Europe
- 3.1. United Kingdom
- 3.2. Germany
- 3.3. France
- 3.4. Italy
- 3.5. Spain
- 3.6. Russia
- 3.7. Benelux
- 3.8. Nordics
- 3.9. Rest of Europe
-
4. Middle East & Africa
- 4.1. Turkey
- 4.2. Israel
- 4.3. GCC
- 4.4. North Africa
- 4.5. South Africa
- 4.6. Rest of Middle East & Africa
-
5. Asia Pacific
- 5.1. China
- 5.2. India
- 5.3. Japan
- 5.4. South Korea
- 5.5. ASEAN
- 5.6. Oceania
- 5.7. Rest of Asia Pacific
America Aerospace Composites Market REPORT HIGHLIGHTS
| Aspects | Details |
|---|---|
| Study Period | 2019-2033 |
| Base Year | 2024 |
| Estimated Year | 2025 |
| Forecast Period | 2025-2033 |
| Historical Period | 2019-2024 |
| Growth Rate | CAGR of 9.50% from 2019-2033 |
| Segmentation |
|
Table of Contents
- 1. Introduction
- 1.1. Research Scope
- 1.2. Market Segmentation
- 1.3. Research Methodology
- 1.4. Definitions and Assumptions
- 2. Executive Summary
- 2.1. Introduction
- 3. Market Dynamics
- 3.1. Introduction
- 3.2. Market Drivers
- 3.3. Market Restrains
- 3.4. Market Trends
- 3.4.1. Commercial Aircraft Segment to have the Largest Market Share During the Forecast Period
- 4. Market Factor Analysis
- 4.1. Porters Five Forces
- 4.2. Supply/Value Chain
- 4.3. PESTEL analysis
- 4.4. Market Entropy
- 4.5. Patent/Trademark Analysis
- 5. Global America Aerospace Composites Market Analysis, Insights and Forecast, 2019-2031
- 5.1. Market Analysis, Insights and Forecast - by Production Analysis
- 5.2. Market Analysis, Insights and Forecast - by Consumption Analysis
- 5.3. Market Analysis, Insights and Forecast - by Import Market Analysis (Value & Volume)
- 5.4. Market Analysis, Insights and Forecast - by Export Market Analysis (Value & Volume)
- 5.5. Market Analysis, Insights and Forecast - by Price Trend Analysis
- 5.6. Market Analysis, Insights and Forecast - by Region
- 5.6.1. North America
- 5.6.2. South America
- 5.6.3. Europe
- 5.6.4. Middle East & Africa
- 5.6.5. Asia Pacific
- 5.1. Market Analysis, Insights and Forecast - by Production Analysis
- 6. North America America Aerospace Composites Market Analysis, Insights and Forecast, 2019-2031
- 6.1. Market Analysis, Insights and Forecast - by Production Analysis
- 6.2. Market Analysis, Insights and Forecast - by Consumption Analysis
- 6.3. Market Analysis, Insights and Forecast - by Import Market Analysis (Value & Volume)
- 6.4. Market Analysis, Insights and Forecast - by Export Market Analysis (Value & Volume)
- 6.5. Market Analysis, Insights and Forecast - by Price Trend Analysis
- 6.1. Market Analysis, Insights and Forecast - by Production Analysis
- 7. South America America Aerospace Composites Market Analysis, Insights and Forecast, 2019-2031
- 7.1. Market Analysis, Insights and Forecast - by Production Analysis
- 7.2. Market Analysis, Insights and Forecast - by Consumption Analysis
- 7.3. Market Analysis, Insights and Forecast - by Import Market Analysis (Value & Volume)
- 7.4. Market Analysis, Insights and Forecast - by Export Market Analysis (Value & Volume)
- 7.5. Market Analysis, Insights and Forecast - by Price Trend Analysis
- 7.1. Market Analysis, Insights and Forecast - by Production Analysis
- 8. Europe America Aerospace Composites Market Analysis, Insights and Forecast, 2019-2031
- 8.1. Market Analysis, Insights and Forecast - by Production Analysis
- 8.2. Market Analysis, Insights and Forecast - by Consumption Analysis
- 8.3. Market Analysis, Insights and Forecast - by Import Market Analysis (Value & Volume)
- 8.4. Market Analysis, Insights and Forecast - by Export Market Analysis (Value & Volume)
- 8.5. Market Analysis, Insights and Forecast - by Price Trend Analysis
- 8.1. Market Analysis, Insights and Forecast - by Production Analysis
- 9. Middle East & Africa America Aerospace Composites Market Analysis, Insights and Forecast, 2019-2031
- 9.1. Market Analysis, Insights and Forecast - by Production Analysis
- 9.2. Market Analysis, Insights and Forecast - by Consumption Analysis
- 9.3. Market Analysis, Insights and Forecast - by Import Market Analysis (Value & Volume)
- 9.4. Market Analysis, Insights and Forecast - by Export Market Analysis (Value & Volume)
- 9.5. Market Analysis, Insights and Forecast - by Price Trend Analysis
- 9.1. Market Analysis, Insights and Forecast - by Production Analysis
- 10. Asia Pacific America Aerospace Composites Market Analysis, Insights and Forecast, 2019-2031
- 10.1. Market Analysis, Insights and Forecast - by Production Analysis
- 10.2. Market Analysis, Insights and Forecast - by Consumption Analysis
- 10.3. Market Analysis, Insights and Forecast - by Import Market Analysis (Value & Volume)
- 10.4. Market Analysis, Insights and Forecast - by Export Market Analysis (Value & Volume)
- 10.5. Market Analysis, Insights and Forecast - by Price Trend Analysis
- 10.1. Market Analysis, Insights and Forecast - by Production Analysis
- 11. North America America Aerospace Composites Market Analysis, Insights and Forecast, 2019-2031
- 11.1. Market Analysis, Insights and Forecast - By Country/Sub-region
- 11.1.1 United States
- 11.1.2 Canada
- 12. Latin America America Aerospace Composites Market Analysis, Insights and Forecast, 2019-2031
- 12.1. Market Analysis, Insights and Forecast - By Country/Sub-region
- 12.1.1 Mexico
- 12.1.2 Brazil
- 12.1.3 Rest of Latin America
- 13. Competitive Analysis
- 13.1. Global Market Share Analysis 2024
- 13.2. Company Profiles
- 13.2.1 Precision Castparts Corp
- 13.2.1.1. Overview
- 13.2.1.2. Products
- 13.2.1.3. SWOT Analysis
- 13.2.1.4. Recent Developments
- 13.2.1.5. Financials (Based on Availability)
- 13.2.2 SGL Carbon
- 13.2.2.1. Overview
- 13.2.2.2. Products
- 13.2.2.3. SWOT Analysis
- 13.2.2.4. Recent Developments
- 13.2.2.5. Financials (Based on Availability)
- 13.2.3 COTESA GmbH
- 13.2.3.1. Overview
- 13.2.3.2. Products
- 13.2.3.3. SWOT Analysis
- 13.2.3.4. Recent Developments
- 13.2.3.5. Financials (Based on Availability)
- 13.2.4 DuPont de Nemours Inc
- 13.2.4.1. Overview
- 13.2.4.2. Products
- 13.2.4.3. SWOT Analysis
- 13.2.4.4. Recent Developments
- 13.2.4.5. Financials (Based on Availability)
- 13.2.5 Renegade Materials Corporatio
- 13.2.5.1. Overview
- 13.2.5.2. Products
- 13.2.5.3. SWOT Analysis
- 13.2.5.4. Recent Developments
- 13.2.5.5. Financials (Based on Availability)
- 13.2.6 Solvay SA
- 13.2.6.1. Overview
- 13.2.6.2. Products
- 13.2.6.3. SWOT Analysis
- 13.2.6.4. Recent Developments
- 13.2.6.5. Financials (Based on Availability)
- 13.2.7 Hexcel Corporation
- 13.2.7.1. Overview
- 13.2.7.2. Products
- 13.2.7.3. SWOT Analysis
- 13.2.7.4. Recent Developments
- 13.2.7.5. Financials (Based on Availability)
- 13.2.8 Materion Corporation
- 13.2.8.1. Overview
- 13.2.8.2. Products
- 13.2.8.3. SWOT Analysis
- 13.2.8.4. Recent Developments
- 13.2.8.5. Financials (Based on Availability)
- 13.2.9 EKISUI CHEMICAL CO LTD
- 13.2.9.1. Overview
- 13.2.9.2. Products
- 13.2.9.3. SWOT Analysis
- 13.2.9.4. Recent Developments
- 13.2.9.5. Financials (Based on Availability)
- 13.2.1 Precision Castparts Corp
List of Figures
- Figure 1: Global America Aerospace Composites Market Revenue Breakdown (Million, %) by Region 2024 & 2032
- Figure 2: North America America Aerospace Composites Market Revenue (Million), by Country 2024 & 2032
- Figure 3: North America America Aerospace Composites Market Revenue Share (%), by Country 2024 & 2032
- Figure 4: Latin America America Aerospace Composites Market Revenue (Million), by Country 2024 & 2032
- Figure 5: Latin America America Aerospace Composites Market Revenue Share (%), by Country 2024 & 2032
- Figure 6: North America America Aerospace Composites Market Revenue (Million), by Production Analysis 2024 & 2032
- Figure 7: North America America Aerospace Composites Market Revenue Share (%), by Production Analysis 2024 & 2032
- Figure 8: North America America Aerospace Composites Market Revenue (Million), by Consumption Analysis 2024 & 2032
- Figure 9: North America America Aerospace Composites Market Revenue Share (%), by Consumption Analysis 2024 & 2032
- Figure 10: North America America Aerospace Composites Market Revenue (Million), by Import Market Analysis (Value & Volume) 2024 & 2032
- Figure 11: North America America Aerospace Composites Market Revenue Share (%), by Import Market Analysis (Value & Volume) 2024 & 2032
- Figure 12: North America America Aerospace Composites Market Revenue (Million), by Export Market Analysis (Value & Volume) 2024 & 2032
- Figure 13: North America America Aerospace Composites Market Revenue Share (%), by Export Market Analysis (Value & Volume) 2024 & 2032
- Figure 14: North America America Aerospace Composites Market Revenue (Million), by Price Trend Analysis 2024 & 2032
- Figure 15: North America America Aerospace Composites Market Revenue Share (%), by Price Trend Analysis 2024 & 2032
- Figure 16: North America America Aerospace Composites Market Revenue (Million), by Country 2024 & 2032
- Figure 17: North America America Aerospace Composites Market Revenue Share (%), by Country 2024 & 2032
- Figure 18: South America America Aerospace Composites Market Revenue (Million), by Production Analysis 2024 & 2032
- Figure 19: South America America Aerospace Composites Market Revenue Share (%), by Production Analysis 2024 & 2032
- Figure 20: South America America Aerospace Composites Market Revenue (Million), by Consumption Analysis 2024 & 2032
- Figure 21: South America America Aerospace Composites Market Revenue Share (%), by Consumption Analysis 2024 & 2032
- Figure 22: South America America Aerospace Composites Market Revenue (Million), by Import Market Analysis (Value & Volume) 2024 & 2032
- Figure 23: South America America Aerospace Composites Market Revenue Share (%), by Import Market Analysis (Value & Volume) 2024 & 2032
- Figure 24: South America America Aerospace Composites Market Revenue (Million), by Export Market Analysis (Value & Volume) 2024 & 2032
- Figure 25: South America America Aerospace Composites Market Revenue Share (%), by Export Market Analysis (Value & Volume) 2024 & 2032
- Figure 26: South America America Aerospace Composites Market Revenue (Million), by Price Trend Analysis 2024 & 2032
- Figure 27: South America America Aerospace Composites Market Revenue Share (%), by Price Trend Analysis 2024 & 2032
- Figure 28: South America America Aerospace Composites Market Revenue (Million), by Country 2024 & 2032
- Figure 29: South America America Aerospace Composites Market Revenue Share (%), by Country 2024 & 2032
- Figure 30: Europe America Aerospace Composites Market Revenue (Million), by Production Analysis 2024 & 2032
- Figure 31: Europe America Aerospace Composites Market Revenue Share (%), by Production Analysis 2024 & 2032
- Figure 32: Europe America Aerospace Composites Market Revenue (Million), by Consumption Analysis 2024 & 2032
- Figure 33: Europe America Aerospace Composites Market Revenue Share (%), by Consumption Analysis 2024 & 2032
- Figure 34: Europe America Aerospace Composites Market Revenue (Million), by Import Market Analysis (Value & Volume) 2024 & 2032
- Figure 35: Europe America Aerospace Composites Market Revenue Share (%), by Import Market Analysis (Value & Volume) 2024 & 2032
- Figure 36: Europe America Aerospace Composites Market Revenue (Million), by Export Market Analysis (Value & Volume) 2024 & 2032
- Figure 37: Europe America Aerospace Composites Market Revenue Share (%), by Export Market Analysis (Value & Volume) 2024 & 2032
- Figure 38: Europe America Aerospace Composites Market Revenue (Million), by Price Trend Analysis 2024 & 2032
- Figure 39: Europe America Aerospace Composites Market Revenue Share (%), by Price Trend Analysis 2024 & 2032
- Figure 40: Europe America Aerospace Composites Market Revenue (Million), by Country 2024 & 2032
- Figure 41: Europe America Aerospace Composites Market Revenue Share (%), by Country 2024 & 2032
- Figure 42: Middle East & Africa America Aerospace Composites Market Revenue (Million), by Production Analysis 2024 & 2032
- Figure 43: Middle East & Africa America Aerospace Composites Market Revenue Share (%), by Production Analysis 2024 & 2032
- Figure 44: Middle East & Africa America Aerospace Composites Market Revenue (Million), by Consumption Analysis 2024 & 2032
- Figure 45: Middle East & Africa America Aerospace Composites Market Revenue Share (%), by Consumption Analysis 2024 & 2032
- Figure 46: Middle East & Africa America Aerospace Composites Market Revenue (Million), by Import Market Analysis (Value & Volume) 2024 & 2032
- Figure 47: Middle East & Africa America Aerospace Composites Market Revenue Share (%), by Import Market Analysis (Value & Volume) 2024 & 2032
- Figure 48: Middle East & Africa America Aerospace Composites Market Revenue (Million), by Export Market Analysis (Value & Volume) 2024 & 2032
- Figure 49: Middle East & Africa America Aerospace Composites Market Revenue Share (%), by Export Market Analysis (Value & Volume) 2024 & 2032
- Figure 50: Middle East & Africa America Aerospace Composites Market Revenue (Million), by Price Trend Analysis 2024 & 2032
- Figure 51: Middle East & Africa America Aerospace Composites Market Revenue Share (%), by Price Trend Analysis 2024 & 2032
- Figure 52: Middle East & Africa America Aerospace Composites Market Revenue (Million), by Country 2024 & 2032
- Figure 53: Middle East & Africa America Aerospace Composites Market Revenue Share (%), by Country 2024 & 2032
- Figure 54: Asia Pacific America Aerospace Composites Market Revenue (Million), by Production Analysis 2024 & 2032
- Figure 55: Asia Pacific America Aerospace Composites Market Revenue Share (%), by Production Analysis 2024 & 2032
- Figure 56: Asia Pacific America Aerospace Composites Market Revenue (Million), by Consumption Analysis 2024 & 2032
- Figure 57: Asia Pacific America Aerospace Composites Market Revenue Share (%), by Consumption Analysis 2024 & 2032
- Figure 58: Asia Pacific America Aerospace Composites Market Revenue (Million), by Import Market Analysis (Value & Volume) 2024 & 2032
- Figure 59: Asia Pacific America Aerospace Composites Market Revenue Share (%), by Import Market Analysis (Value & Volume) 2024 & 2032
- Figure 60: Asia Pacific America Aerospace Composites Market Revenue (Million), by Export Market Analysis (Value & Volume) 2024 & 2032
- Figure 61: Asia Pacific America Aerospace Composites Market Revenue Share (%), by Export Market Analysis (Value & Volume) 2024 & 2032
- Figure 62: Asia Pacific America Aerospace Composites Market Revenue (Million), by Price Trend Analysis 2024 & 2032
- Figure 63: Asia Pacific America Aerospace Composites Market Revenue Share (%), by Price Trend Analysis 2024 & 2032
- Figure 64: Asia Pacific America Aerospace Composites Market Revenue (Million), by Country 2024 & 2032
- Figure 65: Asia Pacific America Aerospace Composites Market Revenue Share (%), by Country 2024 & 2032
List of Tables
- Table 1: Global America Aerospace Composites Market Revenue Million Forecast, by Region 2019 & 2032
- Table 2: Global America Aerospace Composites Market Revenue Million Forecast, by Production Analysis 2019 & 2032
- Table 3: Global America Aerospace Composites Market Revenue Million Forecast, by Consumption Analysis 2019 & 2032
- Table 4: Global America Aerospace Composites Market Revenue Million Forecast, by Import Market Analysis (Value & Volume) 2019 & 2032
- Table 5: Global America Aerospace Composites Market Revenue Million Forecast, by Export Market Analysis (Value & Volume) 2019 & 2032
- Table 6: Global America Aerospace Composites Market Revenue Million Forecast, by Price Trend Analysis 2019 & 2032
- Table 7: Global America Aerospace Composites Market Revenue Million Forecast, by Region 2019 & 2032
- Table 8: Global America Aerospace Composites Market Revenue Million Forecast, by Country 2019 & 2032
- Table 9: United States America Aerospace Composites Market Revenue (Million) Forecast, by Application 2019 & 2032
- Table 10: Canada America Aerospace Composites Market Revenue (Million) Forecast, by Application 2019 & 2032
- Table 11: Global America Aerospace Composites Market Revenue Million Forecast, by Country 2019 & 2032
- Table 12: Mexico America Aerospace Composites Market Revenue (Million) Forecast, by Application 2019 & 2032
- Table 13: Brazil America Aerospace Composites Market Revenue (Million) Forecast, by Application 2019 & 2032
- Table 14: Rest of Latin America America Aerospace Composites Market Revenue (Million) Forecast, by Application 2019 & 2032
- Table 15: Global America Aerospace Composites Market Revenue Million Forecast, by Production Analysis 2019 & 2032
- Table 16: Global America Aerospace Composites Market Revenue Million Forecast, by Consumption Analysis 2019 & 2032
- Table 17: Global America Aerospace Composites Market Revenue Million Forecast, by Import Market Analysis (Value & Volume) 2019 & 2032
- Table 18: Global America Aerospace Composites Market Revenue Million Forecast, by Export Market Analysis (Value & Volume) 2019 & 2032
- Table 19: Global America Aerospace Composites Market Revenue Million Forecast, by Price Trend Analysis 2019 & 2032
- Table 20: Global America Aerospace Composites Market Revenue Million Forecast, by Country 2019 & 2032
- Table 21: United States America Aerospace Composites Market Revenue (Million) Forecast, by Application 2019 & 2032
- Table 22: Canada America Aerospace Composites Market Revenue (Million) Forecast, by Application 2019 & 2032
- Table 23: Mexico America Aerospace Composites Market Revenue (Million) Forecast, by Application 2019 & 2032
- Table 24: Global America Aerospace Composites Market Revenue Million Forecast, by Production Analysis 2019 & 2032
- Table 25: Global America Aerospace Composites Market Revenue Million Forecast, by Consumption Analysis 2019 & 2032
- Table 26: Global America Aerospace Composites Market Revenue Million Forecast, by Import Market Analysis (Value & Volume) 2019 & 2032
- Table 27: Global America Aerospace Composites Market Revenue Million Forecast, by Export Market Analysis (Value & Volume) 2019 & 2032
- Table 28: Global America Aerospace Composites Market Revenue Million Forecast, by Price Trend Analysis 2019 & 2032
- Table 29: Global America Aerospace Composites Market Revenue Million Forecast, by Country 2019 & 2032
- Table 30: Brazil America Aerospace Composites Market Revenue (Million) Forecast, by Application 2019 & 2032
- Table 31: Argentina America Aerospace Composites Market Revenue (Million) Forecast, by Application 2019 & 2032
- Table 32: Rest of South America America Aerospace Composites Market Revenue (Million) Forecast, by Application 2019 & 2032
- Table 33: Global America Aerospace Composites Market Revenue Million Forecast, by Production Analysis 2019 & 2032
- Table 34: Global America Aerospace Composites Market Revenue Million Forecast, by Consumption Analysis 2019 & 2032
- Table 35: Global America Aerospace Composites Market Revenue Million Forecast, by Import Market Analysis (Value & Volume) 2019 & 2032
- Table 36: Global America Aerospace Composites Market Revenue Million Forecast, by Export Market Analysis (Value & Volume) 2019 & 2032
- Table 37: Global America Aerospace Composites Market Revenue Million Forecast, by Price Trend Analysis 2019 & 2032
- Table 38: Global America Aerospace Composites Market Revenue Million Forecast, by Country 2019 & 2032
- Table 39: United Kingdom America Aerospace Composites Market Revenue (Million) Forecast, by Application 2019 & 2032
- Table 40: Germany America Aerospace Composites Market Revenue (Million) Forecast, by Application 2019 & 2032
- Table 41: France America Aerospace Composites Market Revenue (Million) Forecast, by Application 2019 & 2032
- Table 42: Italy America Aerospace Composites Market Revenue (Million) Forecast, by Application 2019 & 2032
- Table 43: Spain America Aerospace Composites Market Revenue (Million) Forecast, by Application 2019 & 2032
- Table 44: Russia America Aerospace Composites Market Revenue (Million) Forecast, by Application 2019 & 2032
- Table 45: Benelux America Aerospace Composites Market Revenue (Million) Forecast, by Application 2019 & 2032
- Table 46: Nordics America Aerospace Composites Market Revenue (Million) Forecast, by Application 2019 & 2032
- Table 47: Rest of Europe America Aerospace Composites Market Revenue (Million) Forecast, by Application 2019 & 2032
- Table 48: Global America Aerospace Composites Market Revenue Million Forecast, by Production Analysis 2019 & 2032
- Table 49: Global America Aerospace Composites Market Revenue Million Forecast, by Consumption Analysis 2019 & 2032
- Table 50: Global America Aerospace Composites Market Revenue Million Forecast, by Import Market Analysis (Value & Volume) 2019 & 2032
- Table 51: Global America Aerospace Composites Market Revenue Million Forecast, by Export Market Analysis (Value & Volume) 2019 & 2032
- Table 52: Global America Aerospace Composites Market Revenue Million Forecast, by Price Trend Analysis 2019 & 2032
- Table 53: Global America Aerospace Composites Market Revenue Million Forecast, by Country 2019 & 2032
- Table 54: Turkey America Aerospace Composites Market Revenue (Million) Forecast, by Application 2019 & 2032
- Table 55: Israel America Aerospace Composites Market Revenue (Million) Forecast, by Application 2019 & 2032
- Table 56: GCC America Aerospace Composites Market Revenue (Million) Forecast, by Application 2019 & 2032
- Table 57: North Africa America Aerospace Composites Market Revenue (Million) Forecast, by Application 2019 & 2032
- Table 58: South Africa America Aerospace Composites Market Revenue (Million) Forecast, by Application 2019 & 2032
- Table 59: Rest of Middle East & Africa America Aerospace Composites Market Revenue (Million) Forecast, by Application 2019 & 2032
- Table 60: Global America Aerospace Composites Market Revenue Million Forecast, by Production Analysis 2019 & 2032
- Table 61: Global America Aerospace Composites Market Revenue Million Forecast, by Consumption Analysis 2019 & 2032
- Table 62: Global America Aerospace Composites Market Revenue Million Forecast, by Import Market Analysis (Value & Volume) 2019 & 2032
- Table 63: Global America Aerospace Composites Market Revenue Million Forecast, by Export Market Analysis (Value & Volume) 2019 & 2032
- Table 64: Global America Aerospace Composites Market Revenue Million Forecast, by Price Trend Analysis 2019 & 2032
- Table 65: Global America Aerospace Composites Market Revenue Million Forecast, by Country 2019 & 2032
- Table 66: China America Aerospace Composites Market Revenue (Million) Forecast, by Application 2019 & 2032
- Table 67: India America Aerospace Composites Market Revenue (Million) Forecast, by Application 2019 & 2032
- Table 68: Japan America Aerospace Composites Market Revenue (Million) Forecast, by Application 2019 & 2032
- Table 69: South Korea America Aerospace Composites Market Revenue (Million) Forecast, by Application 2019 & 2032
- Table 70: ASEAN America Aerospace Composites Market Revenue (Million) Forecast, by Application 2019 & 2032
- Table 71: Oceania America Aerospace Composites Market Revenue (Million) Forecast, by Application 2019 & 2032
- Table 72: Rest of Asia Pacific America Aerospace Composites Market Revenue (Million) Forecast, by Application 2019 & 2032
Frequently Asked Questions
1. What is the projected Compound Annual Growth Rate (CAGR) of the America Aerospace Composites Market?
The projected CAGR is approximately 9.50%.
2. Which companies are prominent players in the America Aerospace Composites Market?
Key companies in the market include Precision Castparts Corp, SGL Carbon, COTESA GmbH, DuPont de Nemours Inc, Renegade Materials Corporatio, Solvay SA, Hexcel Corporation, Materion Corporation, EKISUI CHEMICAL CO LTD.
3. What are the main segments of the America Aerospace Composites Market?
The market segments include Production Analysis, Consumption Analysis, Import Market Analysis (Value & Volume), Export Market Analysis (Value & Volume), Price Trend Analysis.
4. Can you provide details about the market size?
The market size is estimated to be USD 8.71 Million as of 2022.
5. What are some drivers contributing to market growth?
N/A
6. What are the notable trends driving market growth?
Commercial Aircraft Segment to have the Largest Market Share During the Forecast Period.
7. Are there any restraints impacting market growth?
N/A
8. Can you provide examples of recent developments in the market?
N/A
9. What pricing options are available for accessing the report?
Pricing options include single-user, multi-user, and enterprise licenses priced at USD 4750, USD 5250, and USD 8750 respectively.
10. Is the market size provided in terms of value or volume?
The market size is provided in terms of value, measured in Million.
11. Are there any specific market keywords associated with the report?
Yes, the market keyword associated with the report is "America Aerospace Composites Market," which aids in identifying and referencing the specific market segment covered.
12. How do I determine which pricing option suits my needs best?
The pricing options vary based on user requirements and access needs. Individual users may opt for single-user licenses, while businesses requiring broader access may choose multi-user or enterprise licenses for cost-effective access to the report.
13. Are there any additional resources or data provided in the America Aerospace Composites Market report?
While the report offers comprehensive insights, it's advisable to review the specific contents or supplementary materials provided to ascertain if additional resources or data are available.
14. How can I stay updated on further developments or reports in the America Aerospace Composites Market?
To stay informed about further developments, trends, and reports in the America Aerospace Composites Market, consider subscribing to industry newsletters, following relevant companies and organizations, or regularly checking reputable industry news sources and publications.
Methodology
Step 1 - Identification of Relevant Samples Size from Population Database


Step 2 - Approaches for Defining Global Market Size (Value, Volume* & Price*)

Note*: In applicable scenarios
Step 3 - Data Sources
Primary Research
- Web Analytics
- Survey Reports
- Research Institute
- Latest Research Reports
- Opinion Leaders
Secondary Research
- Annual Reports
- White Paper
- Latest Press Release
- Industry Association
- Paid Database
- Investor Presentations

Step 4 - Data Triangulation
Involves using different sources of information in order to increase the validity of a study
These sources are likely to be stakeholders in a program - participants, other researchers, program staff, other community members, and so on.
Then we put all data in single framework & apply various statistical tools to find out the dynamic on the market.
During the analysis stage, feedback from the stakeholder groups would be compared to determine areas of agreement as well as areas of divergence
