

Key Insights
The Radar Simulators Market is poised for substantial expansion, driven by the escalating demand for advanced training and testing solutions across the defense and aerospace industries. With a projected Compound Annual Growth Rate (CAGR) of 6.4%, the market is anticipated to reach $2.9 billion by 2025. Key growth catalysts include the imperative for realistic simulation environments to elevate pilot and operator proficiency and the burgeoning adoption of sophisticated radar systems in both military and commercial spheres. Innovations in high-fidelity graphics and advanced software algorithms are further accelerating market penetration. The market is segmented by component (hardware, software) and application (commercial, military), with the military segment currently leading due to robust global defense investments. Prominent players such as L3Harris Technologies Inc., Rockwell Collins, and Mercury Systems Inc. are actively engaged in R&D to deliver state-of-the-art radar simulator solutions, fostering a competitive and innovative landscape. Despite potential challenges like regulatory complexities and significant upfront investment, the market outlook remains exceptionally strong, with considerable growth opportunities expected in North America, Europe, and the Asia-Pacific region. The increasing integration of simulation technology in civilian applications, including air traffic control training and autonomous vehicle development, will significantly contribute to market growth.
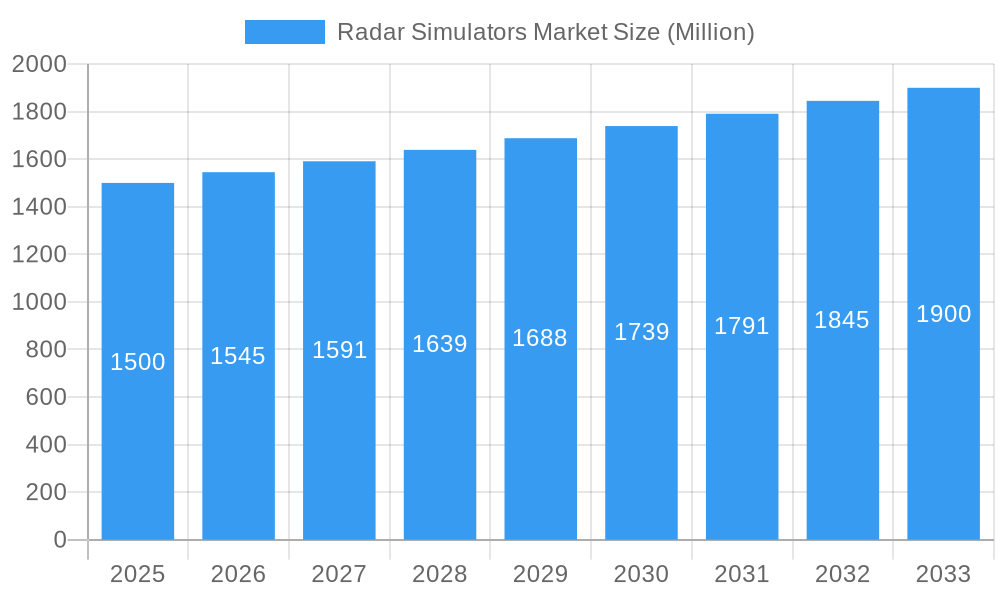
Radar Simulators Market Market Size (In Billion)
The historical performance from 2019 to 2024 establishes a solid foundation for future projections. The market size in 2025 is expected to reflect significant growth from its 2019 baseline, demonstrating a pronounced compounding effect. The forecast period will be characterized by continued expansion, fueled by ongoing technological advancements and escalating demand. Geographically, North America and Europe currently dominate the market, owing to their well-established defense sectors and advanced technological infrastructure. However, the Asia-Pacific region is projected to experience considerable growth in the upcoming years, propelled by increasing military expenditures and infrastructure development in key nations within the region. This geographical diversification underscores the market's resilience and its potential for sustained expansion throughout the forecast horizon. Detailed market segmentation by component and application enables a focused analysis of individual growth drivers and emergent trends within each segment.
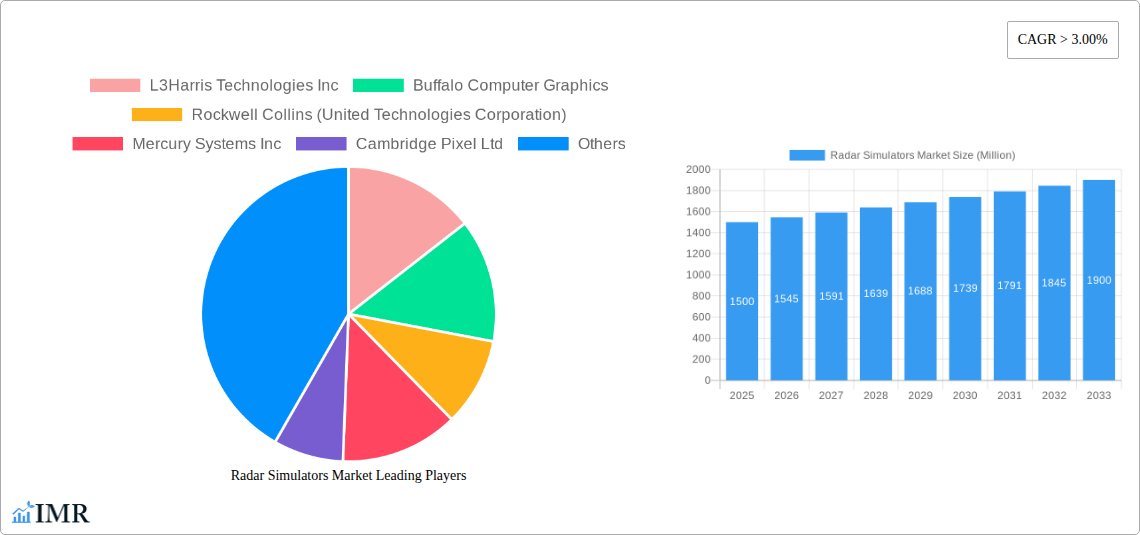
Radar Simulators Market Company Market Share
Radar Simulators Market: A Comprehensive Market Report 2019-2033
This in-depth report provides a comprehensive analysis of the Radar Simulators Market, encompassing market dynamics, growth trends, regional dominance, product landscape, key players, and future outlook. The report covers the period 2019-2033, with a base year of 2025 and a forecast period of 2025-2033. The parent market is the broader Simulation and Training market, while the child market is specifically Radar Simulation systems used for training and testing purposes across various sectors. The global market size in 2025 is estimated to be xx Million.
Radar Simulators Market Dynamics & Structure
This section analyzes the competitive landscape, technological advancements, regulatory influences, and market trends within the radar simulators market. The market exhibits a moderately concentrated structure, with a few major players holding significant market share, while numerous smaller companies cater to niche segments. Technological innovations, particularly in software and hardware capabilities, are key growth drivers. Stringent safety and regulatory standards influence market dynamics, while the increasing demand for realistic simulation environments drives further investment and development.
- Market Concentration: Moderately concentrated, with top 5 players holding approximately xx% market share in 2025.
- Technological Innovation: Advancements in real-time processing, high-fidelity graphics, and AI-powered features fuel growth.
- Regulatory Framework: Compliance with aviation and defense standards influences product development and adoption.
- Competitive Substitutes: Limited direct substitutes, but alternative training methods pose indirect competition.
- M&A Trends: A moderate level of M&A activity, with xx deals recorded between 2019 and 2024, primarily focused on expanding capabilities and market reach. The average deal size was approximately xx Million.
- End-User Demographics: Primarily defense and aviation sectors, with growing demand from commercial and civil applications.
Radar Simulators Market Growth Trends & Insights
The Radar Simulators market is experiencing robust growth, driven by increasing defense spending, the need for enhanced pilot and operator training, and the adoption of advanced simulation technologies. The market's Compound Annual Growth Rate (CAGR) from 2025 to 2033 is projected to be xx%, resulting in a market size of xx Million by 2033. This growth is attributed to several factors including rising demand for realistic training simulations, technological advancements enabling more immersive experiences, and increasing investment in modernization programs within the defense and aviation sectors. The adoption rate of advanced radar simulators continues to increase steadily, particularly in developing economies with rapidly expanding aviation industries. Market penetration remains relatively high in developed countries, with the focus now shifting toward more sophisticated and advanced systems.
Dominant Regions, Countries, or Segments in Radar Simulators Market
North America currently dominates the Radar Simulators market, holding the largest market share due to high defense expenditure and a strong presence of major industry players. However, the Asia-Pacific region is anticipated to witness the fastest growth rate owing to expanding aviation infrastructure and rising military budgets.
Component Segment:
- Hardware: Holds a larger market share compared to software, driven by the need for high-performance computing and sophisticated display systems. The hardware segment is projected to grow at a CAGR of xx% during the forecast period.
- Software: Experiencing rapid growth due to the increasing demand for advanced simulation capabilities and customization options. The software segment is projected to grow at a CAGR of xx% during the forecast period.
Application Segment:
- Military: The largest application segment, driven by the demand for realistic training scenarios and operational readiness.
- Commercial: Growing steadily as air traffic increases and regulatory requirements necessitate enhanced training programs.
Radar Simulators Market Product Landscape
Radar simulators offer increasingly realistic and immersive training environments. Innovations focus on high-fidelity graphics, advanced physics engines, and integration with other training systems. Key selling propositions include improved training effectiveness, reduced training costs, and enhanced safety. Technological advancements involve the use of virtual reality (VR), augmented reality (AR), and AI-powered features to create more dynamic and interactive training experiences.
Key Drivers, Barriers & Challenges in Radar Simulators Market
Key Drivers:
- Increased defense spending globally.
- Growing demand for sophisticated pilot and operator training.
- Technological advancements in simulation technology.
- Stringent regulatory requirements for pilot training.
Key Challenges & Restraints:
- High initial investment costs.
- Complex integration with existing systems.
- Maintaining software updates and compatibility.
- Cybersecurity risks associated with interconnected systems.
Emerging Opportunities in Radar Simulators Market
Emerging opportunities lie in the development of more affordable and accessible simulators for smaller training facilities. The integration of AI and machine learning to personalize training programs and the expansion into new markets (e.g., maritime, space) also present significant growth potential. The increasing adoption of cloud-based simulation platforms offers improved scalability and accessibility.
Growth Accelerators in the Radar Simulators Market Industry
Long-term growth will be propelled by the continuous development of more realistic and immersive training environments, strategic partnerships between simulation providers and training organizations, and the expansion of simulation technology into new applications and sectors. Government initiatives promoting advanced training technologies will further accelerate market expansion.
Key Players Shaping the Radar Simulators Market Market
- L3Harris Technologies Inc
- Buffalo Computer Graphics
- Rockwell Collins (United Technologies Corporation)
- Mercury Systems Inc
- Cambridge Pixel Ltd
- Ultra Electronics Holdings PL
- Textron Systems Corporation (Textron Inc)
- ARI Simulation
- Adacel Technologies Limited
- Acewavetech
Notable Milestones in Radar Simulators Market Sector
- October 2021: Thales and the Tanzania Civil Aviation Authority (TCAA) completed the delivery of an Air Traffic Management (ATM) system and radars for six airports. This project demonstrates the growing adoption of advanced radar systems and the associated need for effective training simulators.
In-Depth Radar Simulators Market Market Outlook
The Radar Simulators market is poised for continued growth, driven by technological advancements, increased demand for realistic training, and expanding applications across various sectors. Strategic partnerships and investments in research and development will shape the future landscape, creating opportunities for both established players and new entrants. The market is expected to show a consistent upward trend for the next decade, reaching xx Million by 2033, promising lucrative returns for stakeholders who actively engage in this evolving market.
Radar Simulators Market Segmentation
-
1. Component
- 1.1. Hardware
- 1.2. Software
-
2. Application
- 2.1. Commercial
- 2.2. Military
Radar Simulators Market Segmentation By Geography
- 1. North America
- 2. Europe
- 3. Asia Pacific
- 4. Latin America
- 5. Middle East and Africa
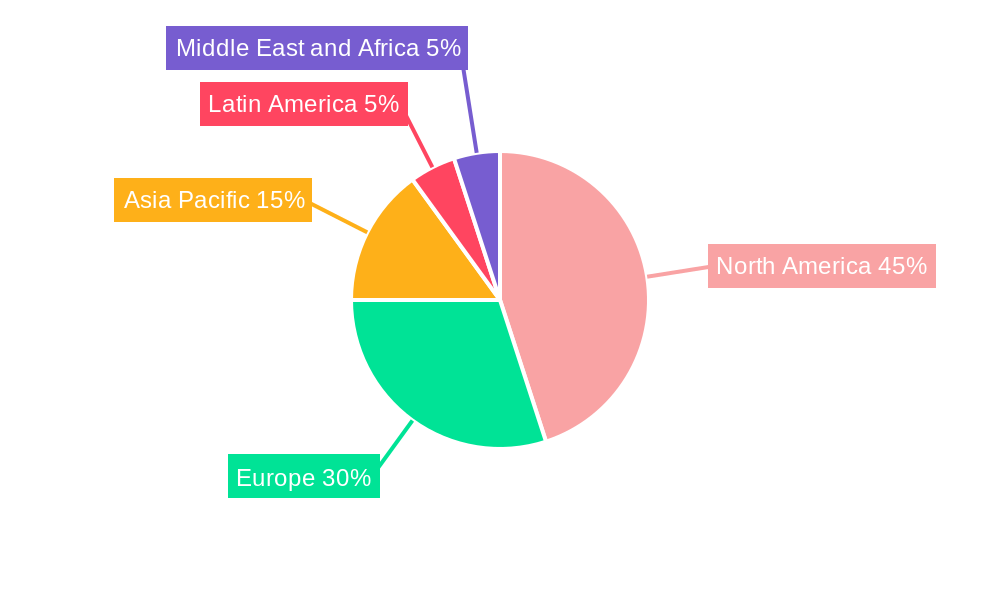
Radar Simulators Market Regional Market Share
Geographic Coverage of Radar Simulators Market
Radar Simulators Market REPORT HIGHLIGHTS
| Aspects | Details |
|---|---|
| Study Period | 2020-2034 |
| Base Year | 2025 |
| Estimated Year | 2026 |
| Forecast Period | 2026-2034 |
| Historical Period | 2020-2025 |
| Growth Rate | CAGR of 6.4% from 2020-2034 |
| Segmentation |
|
Table of Contents
- 1. Introduction
- 1.1. Research Scope
- 1.2. Market Segmentation
- 1.3. Research Objective
- 1.4. Definitions and Assumptions
- 2. Executive Summary
- 2.1. Market Snapshot
- 3. Market Dynamics
- 3.1. Market Drivers
- 3.2. Market Restrains
- 3.3. Market Trends
- 3.4. Market Opportunities
- 4. Market Factor Analysis
- 4.1. Porters Five Forces
- 4.1.1. Bargaining Power of Suppliers
- 4.1.2. Bargaining Power of Buyers
- 4.1.3. Threat of New Entrants
- 4.1.4. Threat of Substitutes
- 4.1.5. Competitive Rivalry
- 4.2. PESTEL analysis
- 4.3. BCG Analysis
- 4.3.1. Stars (High Growth, High Market Share)
- 4.3.2. Cash Cows (Low Growth, High Market Share)
- 4.3.3. Question Mark (High Growth, Low Market Share)
- 4.3.4. Dogs (Low Growth, Low Market Share)
- 4.4. Ansoff Matrix Analysis
- 4.5. Supply Chain Analysis
- 4.6. Regulatory Landscape
- 4.7. Current Market Potential and Opportunity Assessment (TAM–SAM–SOM Framework)
- 4.8. IMR Analyst Note
- 4.1. Porters Five Forces
- 5. Market Analysis, Insights and Forecast 2021-2033
- 5.1. Market Analysis, Insights and Forecast - by Component
- 5.1.1. Hardware
- 5.1.2. Software
- 5.2. Market Analysis, Insights and Forecast - by Application
- 5.2.1. Commercial
- 5.2.2. Military
- 5.3. Market Analysis, Insights and Forecast - by Region
- 5.3.1. North America
- 5.3.2. Europe
- 5.3.3. Asia Pacific
- 5.3.4. Latin America
- 5.3.5. Middle East and Africa
- 5.1. Market Analysis, Insights and Forecast - by Component
- 6. Global Radar Simulators Market Analysis, Insights and Forecast, 2021-2033
- 6.1. Market Analysis, Insights and Forecast - by Component
- 6.1.1. Hardware
- 6.1.2. Software
- 6.2. Market Analysis, Insights and Forecast - by Application
- 6.2.1. Commercial
- 6.2.2. Military
- 6.1. Market Analysis, Insights and Forecast - by Component
- 7. North America Radar Simulators Market Analysis, Insights and Forecast, 2020-2032
- 7.1. Market Analysis, Insights and Forecast - by Component
- 7.1.1. Hardware
- 7.1.2. Software
- 7.2. Market Analysis, Insights and Forecast - by Application
- 7.2.1. Commercial
- 7.2.2. Military
- 7.1. Market Analysis, Insights and Forecast - by Component
- 8. Europe Radar Simulators Market Analysis, Insights and Forecast, 2020-2032
- 8.1. Market Analysis, Insights and Forecast - by Component
- 8.1.1. Hardware
- 8.1.2. Software
- 8.2. Market Analysis, Insights and Forecast - by Application
- 8.2.1. Commercial
- 8.2.2. Military
- 8.1. Market Analysis, Insights and Forecast - by Component
- 9. Asia Pacific Radar Simulators Market Analysis, Insights and Forecast, 2020-2032
- 9.1. Market Analysis, Insights and Forecast - by Component
- 9.1.1. Hardware
- 9.1.2. Software
- 9.2. Market Analysis, Insights and Forecast - by Application
- 9.2.1. Commercial
- 9.2.2. Military
- 9.1. Market Analysis, Insights and Forecast - by Component
- 10. Latin America Radar Simulators Market Analysis, Insights and Forecast, 2020-2032
- 10.1. Market Analysis, Insights and Forecast - by Component
- 10.1.1. Hardware
- 10.1.2. Software
- 10.2. Market Analysis, Insights and Forecast - by Application
- 10.2.1. Commercial
- 10.2.2. Military
- 10.1. Market Analysis, Insights and Forecast - by Component
- 11. Middle East and Africa Radar Simulators Market Analysis, Insights and Forecast, 2020-2032
- 11.1. Market Analysis, Insights and Forecast - by Component
- 11.1.1. Hardware
- 11.1.2. Software
- 11.2. Market Analysis, Insights and Forecast - by Application
- 11.2.1. Commercial
- 11.2.2. Military
- 11.1. Market Analysis, Insights and Forecast - by Component
- 12. Competitive Analysis
- 12.1. Company Profiles
- 12.1.1 L3Harris Technologies Inc
- 12.1.1.1. Company Overview
- 12.1.1.2. Products
- 12.1.1.3. Company Financials
- 12.1.1.4. SWOT Analysis
- 12.1.2 Buffalo Computer Graphics
- 12.1.2.1. Company Overview
- 12.1.2.2. Products
- 12.1.2.3. Company Financials
- 12.1.2.4. SWOT Analysis
- 12.1.3 Rockwell Collins (United Technologies Corporation)
- 12.1.3.1. Company Overview
- 12.1.3.2. Products
- 12.1.3.3. Company Financials
- 12.1.3.4. SWOT Analysis
- 12.1.4 Mercury Systems Inc
- 12.1.4.1. Company Overview
- 12.1.4.2. Products
- 12.1.4.3. Company Financials
- 12.1.4.4. SWOT Analysis
- 12.1.5 Cambridge Pixel Ltd
- 12.1.5.1. Company Overview
- 12.1.5.2. Products
- 12.1.5.3. Company Financials
- 12.1.5.4. SWOT Analysis
- 12.1.6 Ultra Electronics Holdings PL
- 12.1.6.1. Company Overview
- 12.1.6.2. Products
- 12.1.6.3. Company Financials
- 12.1.6.4. SWOT Analysis
- 12.1.7 Textron Systems Corporation (Textron Inc )
- 12.1.7.1. Company Overview
- 12.1.7.2. Products
- 12.1.7.3. Company Financials
- 12.1.7.4. SWOT Analysis
- 12.1.8 ARI Simulation
- 12.1.8.1. Company Overview
- 12.1.8.2. Products
- 12.1.8.3. Company Financials
- 12.1.8.4. SWOT Analysis
- 12.1.9 Adacel Technologies Limited
- 12.1.9.1. Company Overview
- 12.1.9.2. Products
- 12.1.9.3. Company Financials
- 12.1.9.4. SWOT Analysis
- 12.1.10 Acewavetech
- 12.1.10.1. Company Overview
- 12.1.10.2. Products
- 12.1.10.3. Company Financials
- 12.1.10.4. SWOT Analysis
- 12.1.1 L3Harris Technologies Inc
- 12.2. Market Entropy
- 12.2.1 Company's Key Areas Served
- 12.2.2 Recent Developments
- 12.3. Company Market Share Analysis 2025
- 12.3.1 Top 5 Companies Market Share Analysis
- 12.3.2 Top 3 Companies Market Share Analysis
- 12.4. List of Potential Customers
- 13. Research Methodology
List of Figures
- Figure 1: Global Radar Simulators Market Revenue Breakdown (billion, %) by Region 2025 & 2033
- Figure 2: North America Radar Simulators Market Revenue (billion), by Component 2025 & 2033
- Figure 3: North America Radar Simulators Market Revenue Share (%), by Component 2025 & 2033
- Figure 4: North America Radar Simulators Market Revenue (billion), by Application 2025 & 2033
- Figure 5: North America Radar Simulators Market Revenue Share (%), by Application 2025 & 2033
- Figure 6: North America Radar Simulators Market Revenue (billion), by Country 2025 & 2033
- Figure 7: North America Radar Simulators Market Revenue Share (%), by Country 2025 & 2033
- Figure 8: Europe Radar Simulators Market Revenue (billion), by Component 2025 & 2033
- Figure 9: Europe Radar Simulators Market Revenue Share (%), by Component 2025 & 2033
- Figure 10: Europe Radar Simulators Market Revenue (billion), by Application 2025 & 2033
- Figure 11: Europe Radar Simulators Market Revenue Share (%), by Application 2025 & 2033
- Figure 12: Europe Radar Simulators Market Revenue (billion), by Country 2025 & 2033
- Figure 13: Europe Radar Simulators Market Revenue Share (%), by Country 2025 & 2033
- Figure 14: Asia Pacific Radar Simulators Market Revenue (billion), by Component 2025 & 2033
- Figure 15: Asia Pacific Radar Simulators Market Revenue Share (%), by Component 2025 & 2033
- Figure 16: Asia Pacific Radar Simulators Market Revenue (billion), by Application 2025 & 2033
- Figure 17: Asia Pacific Radar Simulators Market Revenue Share (%), by Application 2025 & 2033
- Figure 18: Asia Pacific Radar Simulators Market Revenue (billion), by Country 2025 & 2033
- Figure 19: Asia Pacific Radar Simulators Market Revenue Share (%), by Country 2025 & 2033
- Figure 20: Latin America Radar Simulators Market Revenue (billion), by Component 2025 & 2033
- Figure 21: Latin America Radar Simulators Market Revenue Share (%), by Component 2025 & 2033
- Figure 22: Latin America Radar Simulators Market Revenue (billion), by Application 2025 & 2033
- Figure 23: Latin America Radar Simulators Market Revenue Share (%), by Application 2025 & 2033
- Figure 24: Latin America Radar Simulators Market Revenue (billion), by Country 2025 & 2033
- Figure 25: Latin America Radar Simulators Market Revenue Share (%), by Country 2025 & 2033
- Figure 26: Middle East and Africa Radar Simulators Market Revenue (billion), by Component 2025 & 2033
- Figure 27: Middle East and Africa Radar Simulators Market Revenue Share (%), by Component 2025 & 2033
- Figure 28: Middle East and Africa Radar Simulators Market Revenue (billion), by Application 2025 & 2033
- Figure 29: Middle East and Africa Radar Simulators Market Revenue Share (%), by Application 2025 & 2033
- Figure 30: Middle East and Africa Radar Simulators Market Revenue (billion), by Country 2025 & 2033
- Figure 31: Middle East and Africa Radar Simulators Market Revenue Share (%), by Country 2025 & 2033
List of Tables
- Table 1: Global Radar Simulators Market Revenue billion Forecast, by Component 2020 & 2033
- Table 2: Global Radar Simulators Market Revenue billion Forecast, by Application 2020 & 2033
- Table 3: Global Radar Simulators Market Revenue billion Forecast, by Region 2020 & 2033
- Table 4: Global Radar Simulators Market Revenue billion Forecast, by Component 2020 & 2033
- Table 5: Global Radar Simulators Market Revenue billion Forecast, by Application 2020 & 2033
- Table 6: Global Radar Simulators Market Revenue billion Forecast, by Country 2020 & 2033
- Table 7: Global Radar Simulators Market Revenue billion Forecast, by Component 2020 & 2033
- Table 8: Global Radar Simulators Market Revenue billion Forecast, by Application 2020 & 2033
- Table 9: Global Radar Simulators Market Revenue billion Forecast, by Country 2020 & 2033
- Table 10: Global Radar Simulators Market Revenue billion Forecast, by Component 2020 & 2033
- Table 11: Global Radar Simulators Market Revenue billion Forecast, by Application 2020 & 2033
- Table 12: Global Radar Simulators Market Revenue billion Forecast, by Country 2020 & 2033
- Table 13: Global Radar Simulators Market Revenue billion Forecast, by Component 2020 & 2033
- Table 14: Global Radar Simulators Market Revenue billion Forecast, by Application 2020 & 2033
- Table 15: Global Radar Simulators Market Revenue billion Forecast, by Country 2020 & 2033
- Table 16: Global Radar Simulators Market Revenue billion Forecast, by Component 2020 & 2033
- Table 17: Global Radar Simulators Market Revenue billion Forecast, by Application 2020 & 2033
- Table 18: Global Radar Simulators Market Revenue billion Forecast, by Country 2020 & 2033
Frequently Asked Questions
1. What is the projected Compound Annual Growth Rate (CAGR) of the Radar Simulators Market?
The projected CAGR is approximately 6.4%.
2. Which companies are prominent players in the Radar Simulators Market?
Key companies in the market include L3Harris Technologies Inc, Buffalo Computer Graphics, Rockwell Collins (United Technologies Corporation), Mercury Systems Inc, Cambridge Pixel Ltd, Ultra Electronics Holdings PL, Textron Systems Corporation (Textron Inc ), ARI Simulation, Adacel Technologies Limited, Acewavetech.
3. What are the main segments of the Radar Simulators Market?
The market segments include Component, Application.
4. Can you provide details about the market size?
The market size is estimated to be USD 2.9 billion as of 2022.
5. What are some drivers contributing to market growth?
N/A
6. What are the notable trends driving market growth?
Growth in Air Passenger Traffic Bolstering Requirement for Trained ATC Personnel.
7. Are there any restraints impacting market growth?
N/A
8. Can you provide examples of recent developments in the market?
In October 2021, Thales and Tanzania Civil Aviation Authority (TCAA) have completed the delivery of the Air Traffic Management (ATM) system and radars for six of the country's airports. As part of the modernization program, ATC surveillance radars and TopSky - ATC has been deployed at Songwe (HTGW), Dar es Salaam (DAR), Kilimanjaro (JRO), Mwanza (MWZ), Zanzibar (ZNZ) and Arusha (ARK) airports in Tanzania. Combined with current sensors, Thales' co-mounted STAR NG Primary approach radar with RSM970S Mode S en-route secondary radar alongside TopSky - ATC will automate the en-route, approach, and tower control centers. Besides, the RSM 970S secondary radar Mode S downloads aircraft parameters, offering timely notice of aircraft evolution and clearances to the controller. It also provides the ACAS Resolution Advisory Report.
9. What pricing options are available for accessing the report?
Pricing options include single-user, multi-user, and enterprise licenses priced at USD 4750, USD 5250, and USD 8750 respectively.
10. Is the market size provided in terms of value or volume?
The market size is provided in terms of value, measured in billion.
11. Are there any specific market keywords associated with the report?
Yes, the market keyword associated with the report is "Radar Simulators Market," which aids in identifying and referencing the specific market segment covered.
12. How do I determine which pricing option suits my needs best?
The pricing options vary based on user requirements and access needs. Individual users may opt for single-user licenses, while businesses requiring broader access may choose multi-user or enterprise licenses for cost-effective access to the report.
13. Are there any additional resources or data provided in the Radar Simulators Market report?
While the report offers comprehensive insights, it's advisable to review the specific contents or supplementary materials provided to ascertain if additional resources or data are available.
14. How can I stay updated on further developments or reports in the Radar Simulators Market?
To stay informed about further developments, trends, and reports in the Radar Simulators Market, consider subscribing to industry newsletters, following relevant companies and organizations, or regularly checking reputable industry news sources and publications.
Methodology
Step 1 - Identification of Relevant Samples Size from Population Database


Step 2 - Approaches for Defining Global Market Size (Value, Volume* & Price*)

Note*: In applicable scenarios
Step 3 - Data Sources
Primary Research
- Web Analytics
- Survey Reports
- Research Institute
- Latest Research Reports
- Opinion Leaders
Secondary Research
- Annual Reports
- White Paper
- Latest Press Release
- Industry Association
- Paid Database
- Investor Presentations

Step 4 - Data Triangulation
Involves using different sources of information in order to increase the validity of a study
These sources are likely to be stakeholders in a program - participants, other researchers, program staff, other community members, and so on.
Then we put all data in single framework & apply various statistical tools to find out the dynamic on the market.
During the analysis stage, feedback from the stakeholder groups would be compared to determine areas of agreement as well as areas of divergence