

Key Insights
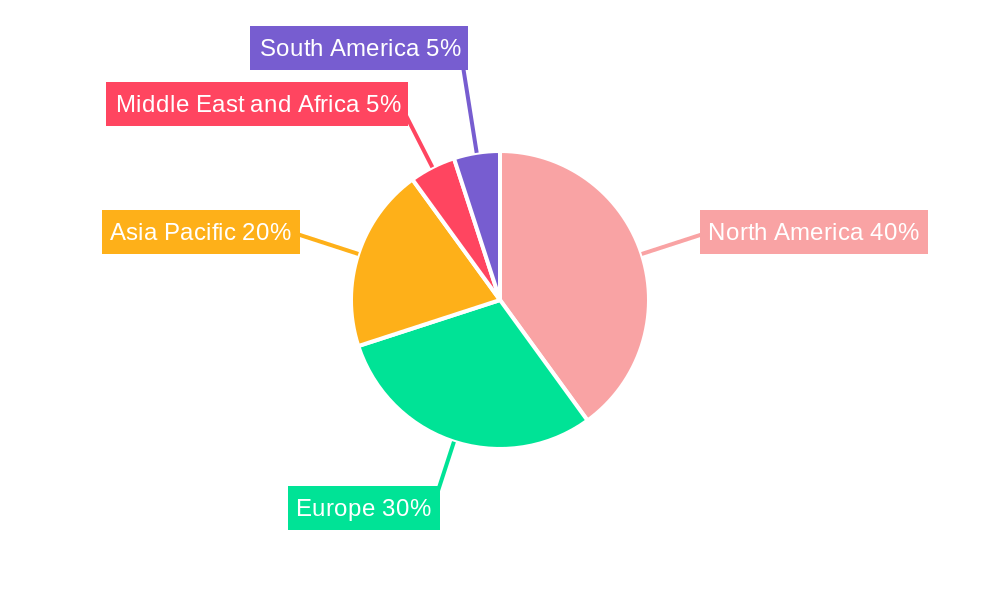
The global angiography devices market is experiencing robust growth, driven by a confluence of factors. The increasing prevalence of cardiovascular diseases, particularly coronary artery disease, necessitates advanced diagnostic and interventional procedures, fueling demand for angiography systems and consumables. Technological advancements, such as the integration of artificial intelligence and improved image resolution in MRI, CT, and X-ray systems, are enhancing diagnostic accuracy and procedural efficiency, further stimulating market expansion. The growing geriatric population, susceptible to cardiovascular ailments, also significantly contributes to market growth. While the market faces certain restraints, such as high costs associated with advanced systems and the need for skilled professionals, the overall trend indicates a sustained period of expansion. The market is segmented by product type (angiographic systems and consumables), technology (MRI, CT, X-ray, and other technologies), application (cerebral, carotid, peripheral, aortic, coronary, and other applications), and end-user (hospitals, diagnostic centers, and ambulatory surgical centers). North America currently holds a substantial market share, followed by Europe and Asia Pacific, with the latter exhibiting rapid growth due to increasing healthcare infrastructure investments and rising disposable incomes.
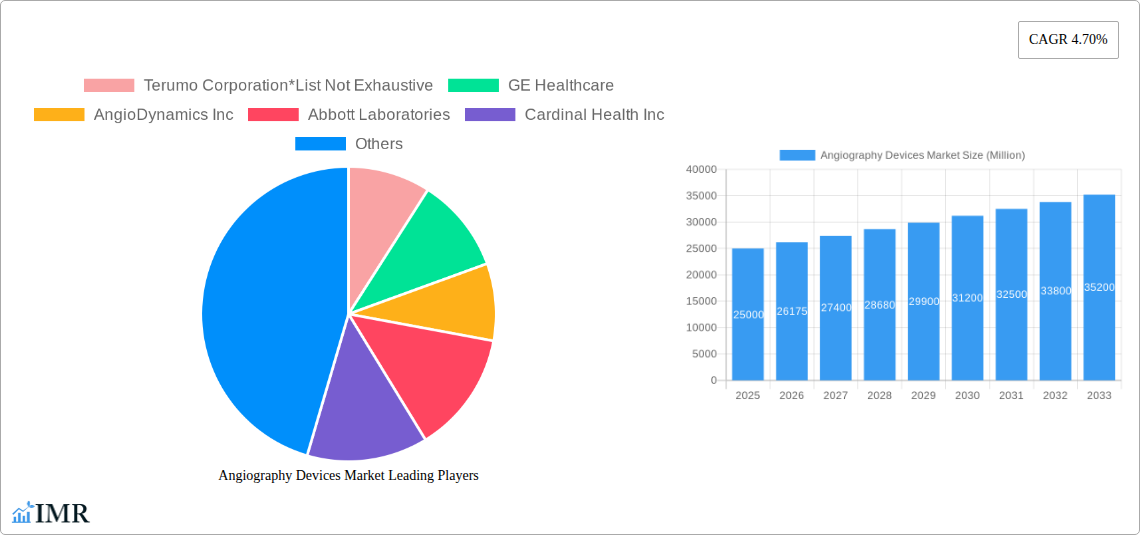
The projected Compound Annual Growth Rate (CAGR) of 4.70% suggests a substantial increase in market value over the forecast period (2025-2033). The competitive landscape is characterized by both established industry giants like GE Healthcare and Medtronic and specialized players like AngioDynamics, each striving to innovate and capture market share. Future growth will likely be influenced by the adoption of minimally invasive procedures, expansion into emerging markets, and continued technological breakthroughs in imaging and intervention. The development of more sophisticated and user-friendly systems, coupled with robust training programs for medical professionals, is crucial for driving market penetration and broadening access to advanced angiography services. This combination of factors positions the angiography devices market for sustained, positive growth in the coming years.
Angiography Devices Market: A Comprehensive Report (2019-2033)
This comprehensive report provides an in-depth analysis of the Angiography Devices market, encompassing its dynamics, growth trends, leading players, and future outlook. The study covers the period from 2019 to 2033, with 2025 serving as the base and estimated year. The report segments the market by product (Angiographic Systems, Consumables), technology (MRI, CT, X-ray, Other Technologies), application (Cerebral, Carotid, Peripheral, Aortic, Coronary, Other Applications), and end-user (Hospitals, Diagnostic Centers, Ambulatory Surgical Centers). Key players analyzed include Terumo Corporation, GE Healthcare, AngioDynamics Inc, Abbott Laboratories, Cardinal Health Inc, Siemens Healthineers AG, Medtronic PLC, Koninklijke Philips NV, Boston Scientific Corporation, and Shimadzu Corporation. The market size is presented in million units.
Angiography Devices Market Market Dynamics & Structure
The angiography devices market is characterized by a moderately concentrated landscape with several key players holding significant market share. Technological innovation, particularly in image quality and minimally invasive procedures, is a primary growth driver. Stringent regulatory frameworks governing medical devices influence market access and adoption. Competitive product substitutes, such as ultrasound imaging, exert pressure on market growth. The end-user demographic is expanding due to rising prevalence of cardiovascular diseases. M&A activity within the sector has been moderate, with xx deals recorded in the historical period (2019-2024), contributing to market consolidation.
- Market Concentration: Moderately concentrated, with top 5 players holding approximately xx% market share in 2024.
- Technological Innovation: Focus on AI-powered image analysis, miniaturization of devices, and improved biocompatibility.
- Regulatory Landscape: Stringent regulatory approvals (e.g., FDA, CE mark) create barriers to entry.
- Competitive Substitutes: Ultrasound and other imaging modalities present alternatives for certain applications.
- End-User Demographics: Aging population and increasing prevalence of cardiovascular diseases drive demand.
- M&A Trends: xx M&A deals between 2019 and 2024, primarily focused on expanding product portfolios and geographic reach.
Angiography Devices Market Growth Trends & Insights
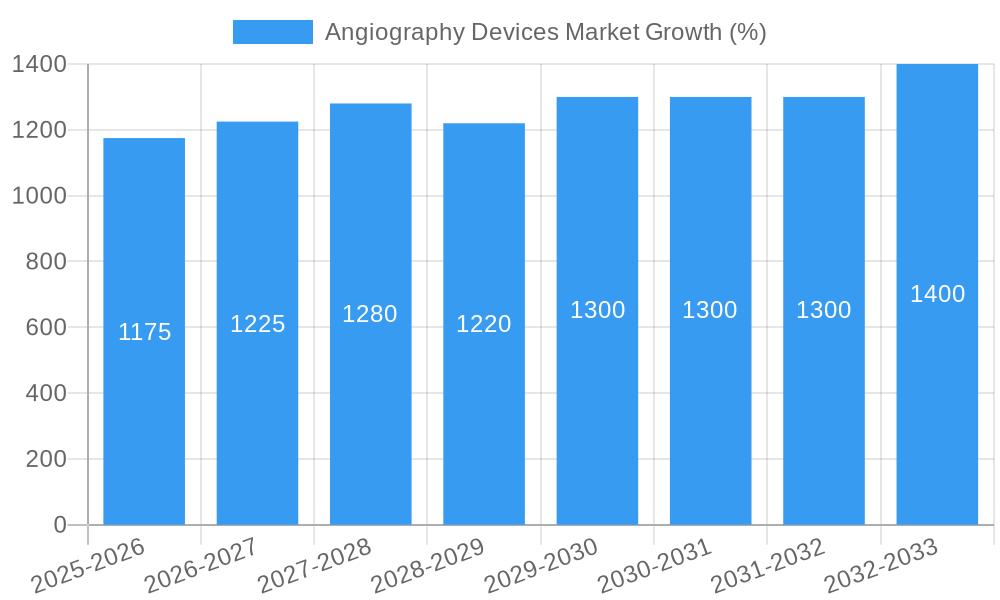
The angiography devices market witnessed robust growth during the historical period (2019-2024), expanding at a CAGR of xx%. This growth is attributed to factors such as the increasing prevalence of cardiovascular diseases, technological advancements leading to improved diagnostic capabilities, and rising healthcare expenditure globally. The market is expected to continue its expansion during the forecast period (2025-2033), with a projected CAGR of xx%. Market penetration rates vary significantly across different regions and applications, with higher penetration observed in developed economies and for coronary applications. Technological disruptions, such as the integration of AI and machine learning, are expected to further accelerate market growth. Consumer behavior is shifting towards minimally invasive procedures, increasing the demand for advanced angiography devices.
Dominant Regions, Countries, or Segments in Angiography Devices Market
North America currently holds the largest market share in the angiography devices market, driven by factors like high healthcare expenditure, advanced healthcare infrastructure, and a large number of specialized hospitals. Within North America, the United States dominates due to its well-established healthcare system and high prevalence of cardiovascular diseases. Europe follows as a significant market, exhibiting steady growth driven by increasing adoption of advanced technologies. Asia-Pacific is expected to show the fastest growth in the coming years due to rapidly expanding healthcare infrastructure and rising disposable incomes.
- Product Segment: Angiographic Systems currently holds a larger market share than consumables, but the consumables segment is anticipated to witness faster growth.
- Technology Segment: X-ray technology dominates, though CT and MRI technologies are gaining traction due to their improved image quality and diagnostic capabilities.
- Application Segment: Coronary angiography remains the largest application segment, followed by peripheral and cerebral angiography.
- End-User Segment: Hospitals and diagnostic centers are major end users, although ambulatory surgical centers are showing growth.
Angiography Devices Market Product Landscape
The angiography devices market offers a diverse range of products, including advanced angiographic systems with improved image resolution and minimally invasive catheters with enhanced maneuverability. Technological advancements encompass the integration of AI and machine learning for improved image analysis, reduced radiation exposure, and enhanced diagnostic accuracy. Unique selling propositions often center around improved image quality, reduced procedure times, and enhanced patient comfort. The market is witnessing increased integration of robotic-assisted procedures to further improve accuracy and efficiency.
Key Drivers, Barriers & Challenges in Angiography Devices Market
Key Drivers: The rising prevalence of cardiovascular diseases globally is a primary driver, along with advancements in imaging technology (e.g., AI-driven image analysis), increasing demand for minimally invasive procedures, and growing healthcare expenditure.
Key Barriers and Challenges: High initial investment costs for advanced systems, stringent regulatory approvals, potential supply chain disruptions, and intense competition among established players pose challenges. Furthermore, the reimbursement landscape for angiography procedures varies across countries, affecting market access and growth. Approximately xx% of hospitals in developing countries lack access to advanced angiography systems due to cost constraints.
Emerging Opportunities in Angiography Devices Market
Emerging opportunities exist in developing economies, where the demand for affordable and high-quality angiography devices is rapidly increasing. The integration of AI and machine learning offers significant potential for improved diagnostics and personalized treatment plans. Furthermore, the development of novel minimally invasive techniques and biodegradable stents presents promising avenues for market growth.
Growth Accelerators in the Angiography Devices Market Industry
Technological breakthroughs, particularly in AI-driven image analysis and minimally invasive procedures, are key growth accelerators. Strategic partnerships between device manufacturers and healthcare providers enhance market penetration. Market expansion strategies focusing on developing economies and untapped applications (e.g., neurovascular interventions) also contribute significantly to market growth.
Key Players Shaping the Angiography Devices Market Market
- Terumo Corporation
- GE Healthcare
- AngioDynamics Inc
- Abbott Laboratories
- Cardinal Health Inc
- Siemens Healthineers AG
- Medtronic PLC
- Koninklijke Philips NV
- Boston Scientific Corporation
- Shimadzu Corporation
Notable Milestones in Angiography Devices Market Sector
- 2022 Q3: Abbott Laboratories launched a new generation of coronary stents.
- 2021 Q4: Medtronic PLC acquired a smaller angiography device company, expanding its product portfolio.
- 2020 Q1: Significant investments were made in AI-powered image analysis for angiography systems.
- 2019 Q4: New regulatory guidelines for angiography devices were implemented in several key markets. (Further milestones can be added here)
In-Depth Angiography Devices Market Market Outlook
The angiography devices market is poised for significant growth in the coming years, driven by several factors. Technological innovation, rising healthcare spending, and the increasing prevalence of cardiovascular diseases will all play a role in the market's expansion. Strategic partnerships and market expansion initiatives, especially in developing economies, will further fuel growth. Companies investing in AI-driven solutions and minimally invasive technologies are expected to gain a competitive advantage. The long-term outlook for the angiography devices market remains highly positive, with significant opportunities for innovation and expansion.
Angiography Devices Market Segmentation
-
1. Product
- 1.1. Angiographic Systems
-
1.2. Consumables
- 1.2.1. Catheters
- 1.2.2. Guidewires
- 1.2.3. Contrast Media
- 1.2.4. Incision Closure Devices
- 1.2.5. Accessories
-
2. Technology
- 2.1. MRI
- 2.2. CT
- 2.3. X-ray
- 2.4. Other Technologies
-
3. Application
- 3.1. Cerebral
- 3.2. Carotid
- 3.3. Peripheral
- 3.4. Aortic
- 3.5. Coronary
- 3.6. Other Applications
-
4. End User
- 4.1. Hospitals
- 4.2. Diagnostic Centers
- 4.3. Ambulatory Surgical Centers
Angiography Devices Market Segmentation By Geography
-
1. North America
- 1.1. United States
- 1.2. Canada
- 1.3. Mexico
-
2. Europe
- 2.1. Germany
- 2.2. United Kingdom
- 2.3. France
- 2.4. Italy
- 2.5. Spain
- 2.6. Rest of Europe
-
3. Asia Pacific
- 3.1. China
- 3.2. Japan
- 3.3. India
- 3.4. Australia
- 3.5. South Korea
- 3.6. Rest of Asia Pacific
-
4. Middle East and Africa
- 4.1. GCC
- 4.2. South Africa
- 4.3. Rest of Middle East and Africa
-
5. South America
- 5.1. Brazil
- 5.2. Argentina
- 5.3. Rest of South America
Angiography Devices Market REPORT HIGHLIGHTS
| Aspects | Details |
|---|---|
| Study Period | 2019-2033 |
| Base Year | 2024 |
| Estimated Year | 2025 |
| Forecast Period | 2025-2033 |
| Historical Period | 2019-2024 |
| Growth Rate | CAGR of 4.70% from 2019-2033 |
| Segmentation |
|
Table of Contents
- 1. Introduction
- 1.1. Research Scope
- 1.2. Market Segmentation
- 1.3. Research Methodology
- 1.4. Definitions and Assumptions
- 2. Executive Summary
- 2.1. Introduction
- 3. Market Dynamics
- 3.1. Introduction
- 3.2. Market Drivers
- 3.2.1. ; Rising Geriatric Population and Increasing Prevalence of Cardiovascular Diseases; Growing Demand for Interventional Angiography in Minimally Invasive Surgeries
- 3.3. Market Restrains
- 3.3.1. ; High Procedure and Equipment Cost; Risks Associated with Angiography Procedures
- 3.4. Market Trends
- 3.4.1. The Hospital Segment is Expected to Dominate the Market During the Forecast Period
- 4. Market Factor Analysis
- 4.1. Porters Five Forces
- 4.2. Supply/Value Chain
- 4.3. PESTEL analysis
- 4.4. Market Entropy
- 4.5. Patent/Trademark Analysis
- 5. Global Angiography Devices Market Analysis, Insights and Forecast, 2019-2031
- 5.1. Market Analysis, Insights and Forecast - by Product
- 5.1.1. Angiographic Systems
- 5.1.2. Consumables
- 5.1.2.1. Catheters
- 5.1.2.2. Guidewires
- 5.1.2.3. Contrast Media
- 5.1.2.4. Incision Closure Devices
- 5.1.2.5. Accessories
- 5.2. Market Analysis, Insights and Forecast - by Technology
- 5.2.1. MRI
- 5.2.2. CT
- 5.2.3. X-ray
- 5.2.4. Other Technologies
- 5.3. Market Analysis, Insights and Forecast - by Application
- 5.3.1. Cerebral
- 5.3.2. Carotid
- 5.3.3. Peripheral
- 5.3.4. Aortic
- 5.3.5. Coronary
- 5.3.6. Other Applications
- 5.4. Market Analysis, Insights and Forecast - by End User
- 5.4.1. Hospitals
- 5.4.2. Diagnostic Centers
- 5.4.3. Ambulatory Surgical Centers
- 5.5. Market Analysis, Insights and Forecast - by Region
- 5.5.1. North America
- 5.5.2. Europe
- 5.5.3. Asia Pacific
- 5.5.4. Middle East and Africa
- 5.5.5. South America
- 5.1. Market Analysis, Insights and Forecast - by Product
- 6. North America Angiography Devices Market Analysis, Insights and Forecast, 2019-2031
- 6.1. Market Analysis, Insights and Forecast - by Product
- 6.1.1. Angiographic Systems
- 6.1.2. Consumables
- 6.1.2.1. Catheters
- 6.1.2.2. Guidewires
- 6.1.2.3. Contrast Media
- 6.1.2.4. Incision Closure Devices
- 6.1.2.5. Accessories
- 6.2. Market Analysis, Insights and Forecast - by Technology
- 6.2.1. MRI
- 6.2.2. CT
- 6.2.3. X-ray
- 6.2.4. Other Technologies
- 6.3. Market Analysis, Insights and Forecast - by Application
- 6.3.1. Cerebral
- 6.3.2. Carotid
- 6.3.3. Peripheral
- 6.3.4. Aortic
- 6.3.5. Coronary
- 6.3.6. Other Applications
- 6.4. Market Analysis, Insights and Forecast - by End User
- 6.4.1. Hospitals
- 6.4.2. Diagnostic Centers
- 6.4.3. Ambulatory Surgical Centers
- 6.1. Market Analysis, Insights and Forecast - by Product
- 7. Europe Angiography Devices Market Analysis, Insights and Forecast, 2019-2031
- 7.1. Market Analysis, Insights and Forecast - by Product
- 7.1.1. Angiographic Systems
- 7.1.2. Consumables
- 7.1.2.1. Catheters
- 7.1.2.2. Guidewires
- 7.1.2.3. Contrast Media
- 7.1.2.4. Incision Closure Devices
- 7.1.2.5. Accessories
- 7.2. Market Analysis, Insights and Forecast - by Technology
- 7.2.1. MRI
- 7.2.2. CT
- 7.2.3. X-ray
- 7.2.4. Other Technologies
- 7.3. Market Analysis, Insights and Forecast - by Application
- 7.3.1. Cerebral
- 7.3.2. Carotid
- 7.3.3. Peripheral
- 7.3.4. Aortic
- 7.3.5. Coronary
- 7.3.6. Other Applications
- 7.4. Market Analysis, Insights and Forecast - by End User
- 7.4.1. Hospitals
- 7.4.2. Diagnostic Centers
- 7.4.3. Ambulatory Surgical Centers
- 7.1. Market Analysis, Insights and Forecast - by Product
- 8. Asia Pacific Angiography Devices Market Analysis, Insights and Forecast, 2019-2031
- 8.1. Market Analysis, Insights and Forecast - by Product
- 8.1.1. Angiographic Systems
- 8.1.2. Consumables
- 8.1.2.1. Catheters
- 8.1.2.2. Guidewires
- 8.1.2.3. Contrast Media
- 8.1.2.4. Incision Closure Devices
- 8.1.2.5. Accessories
- 8.2. Market Analysis, Insights and Forecast - by Technology
- 8.2.1. MRI
- 8.2.2. CT
- 8.2.3. X-ray
- 8.2.4. Other Technologies
- 8.3. Market Analysis, Insights and Forecast - by Application
- 8.3.1. Cerebral
- 8.3.2. Carotid
- 8.3.3. Peripheral
- 8.3.4. Aortic
- 8.3.5. Coronary
- 8.3.6. Other Applications
- 8.4. Market Analysis, Insights and Forecast - by End User
- 8.4.1. Hospitals
- 8.4.2. Diagnostic Centers
- 8.4.3. Ambulatory Surgical Centers
- 8.1. Market Analysis, Insights and Forecast - by Product
- 9. Middle East and Africa Angiography Devices Market Analysis, Insights and Forecast, 2019-2031
- 9.1. Market Analysis, Insights and Forecast - by Product
- 9.1.1. Angiographic Systems
- 9.1.2. Consumables
- 9.1.2.1. Catheters
- 9.1.2.2. Guidewires
- 9.1.2.3. Contrast Media
- 9.1.2.4. Incision Closure Devices
- 9.1.2.5. Accessories
- 9.2. Market Analysis, Insights and Forecast - by Technology
- 9.2.1. MRI
- 9.2.2. CT
- 9.2.3. X-ray
- 9.2.4. Other Technologies
- 9.3. Market Analysis, Insights and Forecast - by Application
- 9.3.1. Cerebral
- 9.3.2. Carotid
- 9.3.3. Peripheral
- 9.3.4. Aortic
- 9.3.5. Coronary
- 9.3.6. Other Applications
- 9.4. Market Analysis, Insights and Forecast - by End User
- 9.4.1. Hospitals
- 9.4.2. Diagnostic Centers
- 9.4.3. Ambulatory Surgical Centers
- 9.1. Market Analysis, Insights and Forecast - by Product
- 10. South America Angiography Devices Market Analysis, Insights and Forecast, 2019-2031
- 10.1. Market Analysis, Insights and Forecast - by Product
- 10.1.1. Angiographic Systems
- 10.1.2. Consumables
- 10.1.2.1. Catheters
- 10.1.2.2. Guidewires
- 10.1.2.3. Contrast Media
- 10.1.2.4. Incision Closure Devices
- 10.1.2.5. Accessories
- 10.2. Market Analysis, Insights and Forecast - by Technology
- 10.2.1. MRI
- 10.2.2. CT
- 10.2.3. X-ray
- 10.2.4. Other Technologies
- 10.3. Market Analysis, Insights and Forecast - by Application
- 10.3.1. Cerebral
- 10.3.2. Carotid
- 10.3.3. Peripheral
- 10.3.4. Aortic
- 10.3.5. Coronary
- 10.3.6. Other Applications
- 10.4. Market Analysis, Insights and Forecast - by End User
- 10.4.1. Hospitals
- 10.4.2. Diagnostic Centers
- 10.4.3. Ambulatory Surgical Centers
- 10.1. Market Analysis, Insights and Forecast - by Product
- 11. North America Angiography Devices Market Analysis, Insights and Forecast, 2019-2031
- 11.1. Market Analysis, Insights and Forecast - By Country/Sub-region
- 11.1.1 United States
- 11.1.2 Canada
- 11.1.3 Mexico
- 12. Europe Angiography Devices Market Analysis, Insights and Forecast, 2019-2031
- 12.1. Market Analysis, Insights and Forecast - By Country/Sub-region
- 12.1.1 Germany
- 12.1.2 United Kingdom
- 12.1.3 France
- 12.1.4 Italy
- 12.1.5 Spain
- 12.1.6 Rest of Europe
- 13. Asia Pacific Angiography Devices Market Analysis, Insights and Forecast, 2019-2031
- 13.1. Market Analysis, Insights and Forecast - By Country/Sub-region
- 13.1.1 China
- 13.1.2 Japan
- 13.1.3 India
- 13.1.4 Australia
- 13.1.5 South Korea
- 13.1.6 Rest of Asia Pacific
- 14. Middle East and Africa Angiography Devices Market Analysis, Insights and Forecast, 2019-2031
- 14.1. Market Analysis, Insights and Forecast - By Country/Sub-region
- 14.1.1 GCC
- 14.1.2 South Africa
- 14.1.3 Rest of Middle East and Africa
- 15. South America Angiography Devices Market Analysis, Insights and Forecast, 2019-2031
- 15.1. Market Analysis, Insights and Forecast - By Country/Sub-region
- 15.1.1 Brazil
- 15.1.2 Argentina
- 15.1.3 Rest of South America
- 16. Competitive Analysis
- 16.1. Global Market Share Analysis 2024
- 16.2. Company Profiles
- 16.2.1 Terumo Corporation*List Not Exhaustive
- 16.2.1.1. Overview
- 16.2.1.2. Products
- 16.2.1.3. SWOT Analysis
- 16.2.1.4. Recent Developments
- 16.2.1.5. Financials (Based on Availability)
- 16.2.2 GE Healthcare
- 16.2.2.1. Overview
- 16.2.2.2. Products
- 16.2.2.3. SWOT Analysis
- 16.2.2.4. Recent Developments
- 16.2.2.5. Financials (Based on Availability)
- 16.2.3 AngioDynamics Inc
- 16.2.3.1. Overview
- 16.2.3.2. Products
- 16.2.3.3. SWOT Analysis
- 16.2.3.4. Recent Developments
- 16.2.3.5. Financials (Based on Availability)
- 16.2.4 Abbott Laboratories
- 16.2.4.1. Overview
- 16.2.4.2. Products
- 16.2.4.3. SWOT Analysis
- 16.2.4.4. Recent Developments
- 16.2.4.5. Financials (Based on Availability)
- 16.2.5 Cardinal Health Inc
- 16.2.5.1. Overview
- 16.2.5.2. Products
- 16.2.5.3. SWOT Analysis
- 16.2.5.4. Recent Developments
- 16.2.5.5. Financials (Based on Availability)
- 16.2.6 Siemens Healthineers AG
- 16.2.6.1. Overview
- 16.2.6.2. Products
- 16.2.6.3. SWOT Analysis
- 16.2.6.4. Recent Developments
- 16.2.6.5. Financials (Based on Availability)
- 16.2.7 Medtronic PLC
- 16.2.7.1. Overview
- 16.2.7.2. Products
- 16.2.7.3. SWOT Analysis
- 16.2.7.4. Recent Developments
- 16.2.7.5. Financials (Based on Availability)
- 16.2.8 Koninklijke Philips NV
- 16.2.8.1. Overview
- 16.2.8.2. Products
- 16.2.8.3. SWOT Analysis
- 16.2.8.4. Recent Developments
- 16.2.8.5. Financials (Based on Availability)
- 16.2.9 Boston Scientific Corporation
- 16.2.9.1. Overview
- 16.2.9.2. Products
- 16.2.9.3. SWOT Analysis
- 16.2.9.4. Recent Developments
- 16.2.9.5. Financials (Based on Availability)
- 16.2.10 Shimadzu Corporation
- 16.2.10.1. Overview
- 16.2.10.2. Products
- 16.2.10.3. SWOT Analysis
- 16.2.10.4. Recent Developments
- 16.2.10.5. Financials (Based on Availability)
- 16.2.1 Terumo Corporation*List Not Exhaustive
List of Figures
- Figure 1: Global Angiography Devices Market Revenue Breakdown (Million, %) by Region 2024 & 2032
- Figure 2: Global Angiography Devices Market Volume Breakdown (K Unit, %) by Region 2024 & 2032
- Figure 3: North America Angiography Devices Market Revenue (Million), by Country 2024 & 2032
- Figure 4: North America Angiography Devices Market Volume (K Unit), by Country 2024 & 2032
- Figure 5: North America Angiography Devices Market Revenue Share (%), by Country 2024 & 2032
- Figure 6: North America Angiography Devices Market Volume Share (%), by Country 2024 & 2032
- Figure 7: Europe Angiography Devices Market Revenue (Million), by Country 2024 & 2032
- Figure 8: Europe Angiography Devices Market Volume (K Unit), by Country 2024 & 2032
- Figure 9: Europe Angiography Devices Market Revenue Share (%), by Country 2024 & 2032
- Figure 10: Europe Angiography Devices Market Volume Share (%), by Country 2024 & 2032
- Figure 11: Asia Pacific Angiography Devices Market Revenue (Million), by Country 2024 & 2032
- Figure 12: Asia Pacific Angiography Devices Market Volume (K Unit), by Country 2024 & 2032
- Figure 13: Asia Pacific Angiography Devices Market Revenue Share (%), by Country 2024 & 2032
- Figure 14: Asia Pacific Angiography Devices Market Volume Share (%), by Country 2024 & 2032
- Figure 15: Middle East and Africa Angiography Devices Market Revenue (Million), by Country 2024 & 2032
- Figure 16: Middle East and Africa Angiography Devices Market Volume (K Unit), by Country 2024 & 2032
- Figure 17: Middle East and Africa Angiography Devices Market Revenue Share (%), by Country 2024 & 2032
- Figure 18: Middle East and Africa Angiography Devices Market Volume Share (%), by Country 2024 & 2032
- Figure 19: South America Angiography Devices Market Revenue (Million), by Country 2024 & 2032
- Figure 20: South America Angiography Devices Market Volume (K Unit), by Country 2024 & 2032
- Figure 21: South America Angiography Devices Market Revenue Share (%), by Country 2024 & 2032
- Figure 22: South America Angiography Devices Market Volume Share (%), by Country 2024 & 2032
- Figure 23: North America Angiography Devices Market Revenue (Million), by Product 2024 & 2032
- Figure 24: North America Angiography Devices Market Volume (K Unit), by Product 2024 & 2032
- Figure 25: North America Angiography Devices Market Revenue Share (%), by Product 2024 & 2032
- Figure 26: North America Angiography Devices Market Volume Share (%), by Product 2024 & 2032
- Figure 27: North America Angiography Devices Market Revenue (Million), by Technology 2024 & 2032
- Figure 28: North America Angiography Devices Market Volume (K Unit), by Technology 2024 & 2032
- Figure 29: North America Angiography Devices Market Revenue Share (%), by Technology 2024 & 2032
- Figure 30: North America Angiography Devices Market Volume Share (%), by Technology 2024 & 2032
- Figure 31: North America Angiography Devices Market Revenue (Million), by Application 2024 & 2032
- Figure 32: North America Angiography Devices Market Volume (K Unit), by Application 2024 & 2032
- Figure 33: North America Angiography Devices Market Revenue Share (%), by Application 2024 & 2032
- Figure 34: North America Angiography Devices Market Volume Share (%), by Application 2024 & 2032
- Figure 35: North America Angiography Devices Market Revenue (Million), by End User 2024 & 2032
- Figure 36: North America Angiography Devices Market Volume (K Unit), by End User 2024 & 2032
- Figure 37: North America Angiography Devices Market Revenue Share (%), by End User 2024 & 2032
- Figure 38: North America Angiography Devices Market Volume Share (%), by End User 2024 & 2032
- Figure 39: North America Angiography Devices Market Revenue (Million), by Country 2024 & 2032
- Figure 40: North America Angiography Devices Market Volume (K Unit), by Country 2024 & 2032
- Figure 41: North America Angiography Devices Market Revenue Share (%), by Country 2024 & 2032
- Figure 42: North America Angiography Devices Market Volume Share (%), by Country 2024 & 2032
- Figure 43: Europe Angiography Devices Market Revenue (Million), by Product 2024 & 2032
- Figure 44: Europe Angiography Devices Market Volume (K Unit), by Product 2024 & 2032
- Figure 45: Europe Angiography Devices Market Revenue Share (%), by Product 2024 & 2032
- Figure 46: Europe Angiography Devices Market Volume Share (%), by Product 2024 & 2032
- Figure 47: Europe Angiography Devices Market Revenue (Million), by Technology 2024 & 2032
- Figure 48: Europe Angiography Devices Market Volume (K Unit), by Technology 2024 & 2032
- Figure 49: Europe Angiography Devices Market Revenue Share (%), by Technology 2024 & 2032
- Figure 50: Europe Angiography Devices Market Volume Share (%), by Technology 2024 & 2032
- Figure 51: Europe Angiography Devices Market Revenue (Million), by Application 2024 & 2032
- Figure 52: Europe Angiography Devices Market Volume (K Unit), by Application 2024 & 2032
- Figure 53: Europe Angiography Devices Market Revenue Share (%), by Application 2024 & 2032
- Figure 54: Europe Angiography Devices Market Volume Share (%), by Application 2024 & 2032
- Figure 55: Europe Angiography Devices Market Revenue (Million), by End User 2024 & 2032
- Figure 56: Europe Angiography Devices Market Volume (K Unit), by End User 2024 & 2032
- Figure 57: Europe Angiography Devices Market Revenue Share (%), by End User 2024 & 2032
- Figure 58: Europe Angiography Devices Market Volume Share (%), by End User 2024 & 2032
- Figure 59: Europe Angiography Devices Market Revenue (Million), by Country 2024 & 2032
- Figure 60: Europe Angiography Devices Market Volume (K Unit), by Country 2024 & 2032
- Figure 61: Europe Angiography Devices Market Revenue Share (%), by Country 2024 & 2032
- Figure 62: Europe Angiography Devices Market Volume Share (%), by Country 2024 & 2032
- Figure 63: Asia Pacific Angiography Devices Market Revenue (Million), by Product 2024 & 2032
- Figure 64: Asia Pacific Angiography Devices Market Volume (K Unit), by Product 2024 & 2032
- Figure 65: Asia Pacific Angiography Devices Market Revenue Share (%), by Product 2024 & 2032
- Figure 66: Asia Pacific Angiography Devices Market Volume Share (%), by Product 2024 & 2032
- Figure 67: Asia Pacific Angiography Devices Market Revenue (Million), by Technology 2024 & 2032
- Figure 68: Asia Pacific Angiography Devices Market Volume (K Unit), by Technology 2024 & 2032
- Figure 69: Asia Pacific Angiography Devices Market Revenue Share (%), by Technology 2024 & 2032
- Figure 70: Asia Pacific Angiography Devices Market Volume Share (%), by Technology 2024 & 2032
- Figure 71: Asia Pacific Angiography Devices Market Revenue (Million), by Application 2024 & 2032
- Figure 72: Asia Pacific Angiography Devices Market Volume (K Unit), by Application 2024 & 2032
- Figure 73: Asia Pacific Angiography Devices Market Revenue Share (%), by Application 2024 & 2032
- Figure 74: Asia Pacific Angiography Devices Market Volume Share (%), by Application 2024 & 2032
- Figure 75: Asia Pacific Angiography Devices Market Revenue (Million), by End User 2024 & 2032
- Figure 76: Asia Pacific Angiography Devices Market Volume (K Unit), by End User 2024 & 2032
- Figure 77: Asia Pacific Angiography Devices Market Revenue Share (%), by End User 2024 & 2032
- Figure 78: Asia Pacific Angiography Devices Market Volume Share (%), by End User 2024 & 2032
- Figure 79: Asia Pacific Angiography Devices Market Revenue (Million), by Country 2024 & 2032
- Figure 80: Asia Pacific Angiography Devices Market Volume (K Unit), by Country 2024 & 2032
- Figure 81: Asia Pacific Angiography Devices Market Revenue Share (%), by Country 2024 & 2032
- Figure 82: Asia Pacific Angiography Devices Market Volume Share (%), by Country 2024 & 2032
- Figure 83: Middle East and Africa Angiography Devices Market Revenue (Million), by Product 2024 & 2032
- Figure 84: Middle East and Africa Angiography Devices Market Volume (K Unit), by Product 2024 & 2032
- Figure 85: Middle East and Africa Angiography Devices Market Revenue Share (%), by Product 2024 & 2032
- Figure 86: Middle East and Africa Angiography Devices Market Volume Share (%), by Product 2024 & 2032
- Figure 87: Middle East and Africa Angiography Devices Market Revenue (Million), by Technology 2024 & 2032
- Figure 88: Middle East and Africa Angiography Devices Market Volume (K Unit), by Technology 2024 & 2032
- Figure 89: Middle East and Africa Angiography Devices Market Revenue Share (%), by Technology 2024 & 2032
- Figure 90: Middle East and Africa Angiography Devices Market Volume Share (%), by Technology 2024 & 2032
- Figure 91: Middle East and Africa Angiography Devices Market Revenue (Million), by Application 2024 & 2032
- Figure 92: Middle East and Africa Angiography Devices Market Volume (K Unit), by Application 2024 & 2032
- Figure 93: Middle East and Africa Angiography Devices Market Revenue Share (%), by Application 2024 & 2032
- Figure 94: Middle East and Africa Angiography Devices Market Volume Share (%), by Application 2024 & 2032
- Figure 95: Middle East and Africa Angiography Devices Market Revenue (Million), by End User 2024 & 2032
- Figure 96: Middle East and Africa Angiography Devices Market Volume (K Unit), by End User 2024 & 2032
- Figure 97: Middle East and Africa Angiography Devices Market Revenue Share (%), by End User 2024 & 2032
- Figure 98: Middle East and Africa Angiography Devices Market Volume Share (%), by End User 2024 & 2032
- Figure 99: Middle East and Africa Angiography Devices Market Revenue (Million), by Country 2024 & 2032
- Figure 100: Middle East and Africa Angiography Devices Market Volume (K Unit), by Country 2024 & 2032
- Figure 101: Middle East and Africa Angiography Devices Market Revenue Share (%), by Country 2024 & 2032
- Figure 102: Middle East and Africa Angiography Devices Market Volume Share (%), by Country 2024 & 2032
- Figure 103: South America Angiography Devices Market Revenue (Million), by Product 2024 & 2032
- Figure 104: South America Angiography Devices Market Volume (K Unit), by Product 2024 & 2032
- Figure 105: South America Angiography Devices Market Revenue Share (%), by Product 2024 & 2032
- Figure 106: South America Angiography Devices Market Volume Share (%), by Product 2024 & 2032
- Figure 107: South America Angiography Devices Market Revenue (Million), by Technology 2024 & 2032
- Figure 108: South America Angiography Devices Market Volume (K Unit), by Technology 2024 & 2032
- Figure 109: South America Angiography Devices Market Revenue Share (%), by Technology 2024 & 2032
- Figure 110: South America Angiography Devices Market Volume Share (%), by Technology 2024 & 2032
- Figure 111: South America Angiography Devices Market Revenue (Million), by Application 2024 & 2032
- Figure 112: South America Angiography Devices Market Volume (K Unit), by Application 2024 & 2032
- Figure 113: South America Angiography Devices Market Revenue Share (%), by Application 2024 & 2032
- Figure 114: South America Angiography Devices Market Volume Share (%), by Application 2024 & 2032
- Figure 115: South America Angiography Devices Market Revenue (Million), by End User 2024 & 2032
- Figure 116: South America Angiography Devices Market Volume (K Unit), by End User 2024 & 2032
- Figure 117: South America Angiography Devices Market Revenue Share (%), by End User 2024 & 2032
- Figure 118: South America Angiography Devices Market Volume Share (%), by End User 2024 & 2032
- Figure 119: South America Angiography Devices Market Revenue (Million), by Country 2024 & 2032
- Figure 120: South America Angiography Devices Market Volume (K Unit), by Country 2024 & 2032
- Figure 121: South America Angiography Devices Market Revenue Share (%), by Country 2024 & 2032
- Figure 122: South America Angiography Devices Market Volume Share (%), by Country 2024 & 2032
List of Tables
- Table 1: Global Angiography Devices Market Revenue Million Forecast, by Region 2019 & 2032
- Table 2: Global Angiography Devices Market Volume K Unit Forecast, by Region 2019 & 2032
- Table 3: Global Angiography Devices Market Revenue Million Forecast, by Product 2019 & 2032
- Table 4: Global Angiography Devices Market Volume K Unit Forecast, by Product 2019 & 2032
- Table 5: Global Angiography Devices Market Revenue Million Forecast, by Technology 2019 & 2032
- Table 6: Global Angiography Devices Market Volume K Unit Forecast, by Technology 2019 & 2032
- Table 7: Global Angiography Devices Market Revenue Million Forecast, by Application 2019 & 2032
- Table 8: Global Angiography Devices Market Volume K Unit Forecast, by Application 2019 & 2032
- Table 9: Global Angiography Devices Market Revenue Million Forecast, by End User 2019 & 2032
- Table 10: Global Angiography Devices Market Volume K Unit Forecast, by End User 2019 & 2032
- Table 11: Global Angiography Devices Market Revenue Million Forecast, by Region 2019 & 2032
- Table 12: Global Angiography Devices Market Volume K Unit Forecast, by Region 2019 & 2032
- Table 13: Global Angiography Devices Market Revenue Million Forecast, by Country 2019 & 2032
- Table 14: Global Angiography Devices Market Volume K Unit Forecast, by Country 2019 & 2032
- Table 15: United States Angiography Devices Market Revenue (Million) Forecast, by Application 2019 & 2032
- Table 16: United States Angiography Devices Market Volume (K Unit) Forecast, by Application 2019 & 2032
- Table 17: Canada Angiography Devices Market Revenue (Million) Forecast, by Application 2019 & 2032
- Table 18: Canada Angiography Devices Market Volume (K Unit) Forecast, by Application 2019 & 2032
- Table 19: Mexico Angiography Devices Market Revenue (Million) Forecast, by Application 2019 & 2032
- Table 20: Mexico Angiography Devices Market Volume (K Unit) Forecast, by Application 2019 & 2032
- Table 21: Global Angiography Devices Market Revenue Million Forecast, by Country 2019 & 2032
- Table 22: Global Angiography Devices Market Volume K Unit Forecast, by Country 2019 & 2032
- Table 23: Germany Angiography Devices Market Revenue (Million) Forecast, by Application 2019 & 2032
- Table 24: Germany Angiography Devices Market Volume (K Unit) Forecast, by Application 2019 & 2032
- Table 25: United Kingdom Angiography Devices Market Revenue (Million) Forecast, by Application 2019 & 2032
- Table 26: United Kingdom Angiography Devices Market Volume (K Unit) Forecast, by Application 2019 & 2032
- Table 27: France Angiography Devices Market Revenue (Million) Forecast, by Application 2019 & 2032
- Table 28: France Angiography Devices Market Volume (K Unit) Forecast, by Application 2019 & 2032
- Table 29: Italy Angiography Devices Market Revenue (Million) Forecast, by Application 2019 & 2032
- Table 30: Italy Angiography Devices Market Volume (K Unit) Forecast, by Application 2019 & 2032
- Table 31: Spain Angiography Devices Market Revenue (Million) Forecast, by Application 2019 & 2032
- Table 32: Spain Angiography Devices Market Volume (K Unit) Forecast, by Application 2019 & 2032
- Table 33: Rest of Europe Angiography Devices Market Revenue (Million) Forecast, by Application 2019 & 2032
- Table 34: Rest of Europe Angiography Devices Market Volume (K Unit) Forecast, by Application 2019 & 2032
- Table 35: Global Angiography Devices Market Revenue Million Forecast, by Country 2019 & 2032
- Table 36: Global Angiography Devices Market Volume K Unit Forecast, by Country 2019 & 2032
- Table 37: China Angiography Devices Market Revenue (Million) Forecast, by Application 2019 & 2032
- Table 38: China Angiography Devices Market Volume (K Unit) Forecast, by Application 2019 & 2032
- Table 39: Japan Angiography Devices Market Revenue (Million) Forecast, by Application 2019 & 2032
- Table 40: Japan Angiography Devices Market Volume (K Unit) Forecast, by Application 2019 & 2032
- Table 41: India Angiography Devices Market Revenue (Million) Forecast, by Application 2019 & 2032
- Table 42: India Angiography Devices Market Volume (K Unit) Forecast, by Application 2019 & 2032
- Table 43: Australia Angiography Devices Market Revenue (Million) Forecast, by Application 2019 & 2032
- Table 44: Australia Angiography Devices Market Volume (K Unit) Forecast, by Application 2019 & 2032
- Table 45: South Korea Angiography Devices Market Revenue (Million) Forecast, by Application 2019 & 2032
- Table 46: South Korea Angiography Devices Market Volume (K Unit) Forecast, by Application 2019 & 2032
- Table 47: Rest of Asia Pacific Angiography Devices Market Revenue (Million) Forecast, by Application 2019 & 2032
- Table 48: Rest of Asia Pacific Angiography Devices Market Volume (K Unit) Forecast, by Application 2019 & 2032
- Table 49: Global Angiography Devices Market Revenue Million Forecast, by Country 2019 & 2032
- Table 50: Global Angiography Devices Market Volume K Unit Forecast, by Country 2019 & 2032
- Table 51: GCC Angiography Devices Market Revenue (Million) Forecast, by Application 2019 & 2032
- Table 52: GCC Angiography Devices Market Volume (K Unit) Forecast, by Application 2019 & 2032
- Table 53: South Africa Angiography Devices Market Revenue (Million) Forecast, by Application 2019 & 2032
- Table 54: South Africa Angiography Devices Market Volume (K Unit) Forecast, by Application 2019 & 2032
- Table 55: Rest of Middle East and Africa Angiography Devices Market Revenue (Million) Forecast, by Application 2019 & 2032
- Table 56: Rest of Middle East and Africa Angiography Devices Market Volume (K Unit) Forecast, by Application 2019 & 2032
- Table 57: Global Angiography Devices Market Revenue Million Forecast, by Country 2019 & 2032
- Table 58: Global Angiography Devices Market Volume K Unit Forecast, by Country 2019 & 2032
- Table 59: Brazil Angiography Devices Market Revenue (Million) Forecast, by Application 2019 & 2032
- Table 60: Brazil Angiography Devices Market Volume (K Unit) Forecast, by Application 2019 & 2032
- Table 61: Argentina Angiography Devices Market Revenue (Million) Forecast, by Application 2019 & 2032
- Table 62: Argentina Angiography Devices Market Volume (K Unit) Forecast, by Application 2019 & 2032
- Table 63: Rest of South America Angiography Devices Market Revenue (Million) Forecast, by Application 2019 & 2032
- Table 64: Rest of South America Angiography Devices Market Volume (K Unit) Forecast, by Application 2019 & 2032
- Table 65: Global Angiography Devices Market Revenue Million Forecast, by Product 2019 & 2032
- Table 66: Global Angiography Devices Market Volume K Unit Forecast, by Product 2019 & 2032
- Table 67: Global Angiography Devices Market Revenue Million Forecast, by Technology 2019 & 2032
- Table 68: Global Angiography Devices Market Volume K Unit Forecast, by Technology 2019 & 2032
- Table 69: Global Angiography Devices Market Revenue Million Forecast, by Application 2019 & 2032
- Table 70: Global Angiography Devices Market Volume K Unit Forecast, by Application 2019 & 2032
- Table 71: Global Angiography Devices Market Revenue Million Forecast, by End User 2019 & 2032
- Table 72: Global Angiography Devices Market Volume K Unit Forecast, by End User 2019 & 2032
- Table 73: Global Angiography Devices Market Revenue Million Forecast, by Country 2019 & 2032
- Table 74: Global Angiography Devices Market Volume K Unit Forecast, by Country 2019 & 2032
- Table 75: United States Angiography Devices Market Revenue (Million) Forecast, by Application 2019 & 2032
- Table 76: United States Angiography Devices Market Volume (K Unit) Forecast, by Application 2019 & 2032
- Table 77: Canada Angiography Devices Market Revenue (Million) Forecast, by Application 2019 & 2032
- Table 78: Canada Angiography Devices Market Volume (K Unit) Forecast, by Application 2019 & 2032
- Table 79: Mexico Angiography Devices Market Revenue (Million) Forecast, by Application 2019 & 2032
- Table 80: Mexico Angiography Devices Market Volume (K Unit) Forecast, by Application 2019 & 2032
- Table 81: Global Angiography Devices Market Revenue Million Forecast, by Product 2019 & 2032
- Table 82: Global Angiography Devices Market Volume K Unit Forecast, by Product 2019 & 2032
- Table 83: Global Angiography Devices Market Revenue Million Forecast, by Technology 2019 & 2032
- Table 84: Global Angiography Devices Market Volume K Unit Forecast, by Technology 2019 & 2032
- Table 85: Global Angiography Devices Market Revenue Million Forecast, by Application 2019 & 2032
- Table 86: Global Angiography Devices Market Volume K Unit Forecast, by Application 2019 & 2032
- Table 87: Global Angiography Devices Market Revenue Million Forecast, by End User 2019 & 2032
- Table 88: Global Angiography Devices Market Volume K Unit Forecast, by End User 2019 & 2032
- Table 89: Global Angiography Devices Market Revenue Million Forecast, by Country 2019 & 2032
- Table 90: Global Angiography Devices Market Volume K Unit Forecast, by Country 2019 & 2032
- Table 91: Germany Angiography Devices Market Revenue (Million) Forecast, by Application 2019 & 2032
- Table 92: Germany Angiography Devices Market Volume (K Unit) Forecast, by Application 2019 & 2032
- Table 93: United Kingdom Angiography Devices Market Revenue (Million) Forecast, by Application 2019 & 2032
- Table 94: United Kingdom Angiography Devices Market Volume (K Unit) Forecast, by Application 2019 & 2032
- Table 95: France Angiography Devices Market Revenue (Million) Forecast, by Application 2019 & 2032
- Table 96: France Angiography Devices Market Volume (K Unit) Forecast, by Application 2019 & 2032
- Table 97: Italy Angiography Devices Market Revenue (Million) Forecast, by Application 2019 & 2032
- Table 98: Italy Angiography Devices Market Volume (K Unit) Forecast, by Application 2019 & 2032
- Table 99: Spain Angiography Devices Market Revenue (Million) Forecast, by Application 2019 & 2032
- Table 100: Spain Angiography Devices Market Volume (K Unit) Forecast, by Application 2019 & 2032
- Table 101: Rest of Europe Angiography Devices Market Revenue (Million) Forecast, by Application 2019 & 2032
- Table 102: Rest of Europe Angiography Devices Market Volume (K Unit) Forecast, by Application 2019 & 2032
- Table 103: Global Angiography Devices Market Revenue Million Forecast, by Product 2019 & 2032
- Table 104: Global Angiography Devices Market Volume K Unit Forecast, by Product 2019 & 2032
- Table 105: Global Angiography Devices Market Revenue Million Forecast, by Technology 2019 & 2032
- Table 106: Global Angiography Devices Market Volume K Unit Forecast, by Technology 2019 & 2032
- Table 107: Global Angiography Devices Market Revenue Million Forecast, by Application 2019 & 2032
- Table 108: Global Angiography Devices Market Volume K Unit Forecast, by Application 2019 & 2032
- Table 109: Global Angiography Devices Market Revenue Million Forecast, by End User 2019 & 2032
- Table 110: Global Angiography Devices Market Volume K Unit Forecast, by End User 2019 & 2032
- Table 111: Global Angiography Devices Market Revenue Million Forecast, by Country 2019 & 2032
- Table 112: Global Angiography Devices Market Volume K Unit Forecast, by Country 2019 & 2032
- Table 113: China Angiography Devices Market Revenue (Million) Forecast, by Application 2019 & 2032
- Table 114: China Angiography Devices Market Volume (K Unit) Forecast, by Application 2019 & 2032
- Table 115: Japan Angiography Devices Market Revenue (Million) Forecast, by Application 2019 & 2032
- Table 116: Japan Angiography Devices Market Volume (K Unit) Forecast, by Application 2019 & 2032
- Table 117: India Angiography Devices Market Revenue (Million) Forecast, by Application 2019 & 2032
- Table 118: India Angiography Devices Market Volume (K Unit) Forecast, by Application 2019 & 2032
- Table 119: Australia Angiography Devices Market Revenue (Million) Forecast, by Application 2019 & 2032
- Table 120: Australia Angiography Devices Market Volume (K Unit) Forecast, by Application 2019 & 2032
- Table 121: South Korea Angiography Devices Market Revenue (Million) Forecast, by Application 2019 & 2032
- Table 122: South Korea Angiography Devices Market Volume (K Unit) Forecast, by Application 2019 & 2032
- Table 123: Rest of Asia Pacific Angiography Devices Market Revenue (Million) Forecast, by Application 2019 & 2032
- Table 124: Rest of Asia Pacific Angiography Devices Market Volume (K Unit) Forecast, by Application 2019 & 2032
- Table 125: Global Angiography Devices Market Revenue Million Forecast, by Product 2019 & 2032
- Table 126: Global Angiography Devices Market Volume K Unit Forecast, by Product 2019 & 2032
- Table 127: Global Angiography Devices Market Revenue Million Forecast, by Technology 2019 & 2032
- Table 128: Global Angiography Devices Market Volume K Unit Forecast, by Technology 2019 & 2032
- Table 129: Global Angiography Devices Market Revenue Million Forecast, by Application 2019 & 2032
- Table 130: Global Angiography Devices Market Volume K Unit Forecast, by Application 2019 & 2032
- Table 131: Global Angiography Devices Market Revenue Million Forecast, by End User 2019 & 2032
- Table 132: Global Angiography Devices Market Volume K Unit Forecast, by End User 2019 & 2032
- Table 133: Global Angiography Devices Market Revenue Million Forecast, by Country 2019 & 2032
- Table 134: Global Angiography Devices Market Volume K Unit Forecast, by Country 2019 & 2032
- Table 135: GCC Angiography Devices Market Revenue (Million) Forecast, by Application 2019 & 2032
- Table 136: GCC Angiography Devices Market Volume (K Unit) Forecast, by Application 2019 & 2032
- Table 137: South Africa Angiography Devices Market Revenue (Million) Forecast, by Application 2019 & 2032
- Table 138: South Africa Angiography Devices Market Volume (K Unit) Forecast, by Application 2019 & 2032
- Table 139: Rest of Middle East and Africa Angiography Devices Market Revenue (Million) Forecast, by Application 2019 & 2032
- Table 140: Rest of Middle East and Africa Angiography Devices Market Volume (K Unit) Forecast, by Application 2019 & 2032
- Table 141: Global Angiography Devices Market Revenue Million Forecast, by Product 2019 & 2032
- Table 142: Global Angiography Devices Market Volume K Unit Forecast, by Product 2019 & 2032
- Table 143: Global Angiography Devices Market Revenue Million Forecast, by Technology 2019 & 2032
- Table 144: Global Angiography Devices Market Volume K Unit Forecast, by Technology 2019 & 2032
- Table 145: Global Angiography Devices Market Revenue Million Forecast, by Application 2019 & 2032
- Table 146: Global Angiography Devices Market Volume K Unit Forecast, by Application 2019 & 2032
- Table 147: Global Angiography Devices Market Revenue Million Forecast, by End User 2019 & 2032
- Table 148: Global Angiography Devices Market Volume K Unit Forecast, by End User 2019 & 2032
- Table 149: Global Angiography Devices Market Revenue Million Forecast, by Country 2019 & 2032
- Table 150: Global Angiography Devices Market Volume K Unit Forecast, by Country 2019 & 2032
- Table 151: Brazil Angiography Devices Market Revenue (Million) Forecast, by Application 2019 & 2032
- Table 152: Brazil Angiography Devices Market Volume (K Unit) Forecast, by Application 2019 & 2032
- Table 153: Argentina Angiography Devices Market Revenue (Million) Forecast, by Application 2019 & 2032
- Table 154: Argentina Angiography Devices Market Volume (K Unit) Forecast, by Application 2019 & 2032
- Table 155: Rest of South America Angiography Devices Market Revenue (Million) Forecast, by Application 2019 & 2032
- Table 156: Rest of South America Angiography Devices Market Volume (K Unit) Forecast, by Application 2019 & 2032
Frequently Asked Questions
1. What is the projected Compound Annual Growth Rate (CAGR) of the Angiography Devices Market?
The projected CAGR is approximately 4.70%.
2. Which companies are prominent players in the Angiography Devices Market?
Key companies in the market include Terumo Corporation*List Not Exhaustive, GE Healthcare, AngioDynamics Inc, Abbott Laboratories, Cardinal Health Inc, Siemens Healthineers AG, Medtronic PLC, Koninklijke Philips NV, Boston Scientific Corporation, Shimadzu Corporation.
3. What are the main segments of the Angiography Devices Market?
The market segments include Product, Technology, Application, End User.
4. Can you provide details about the market size?
The market size is estimated to be USD XX Million as of 2022.
5. What are some drivers contributing to market growth?
; Rising Geriatric Population and Increasing Prevalence of Cardiovascular Diseases; Growing Demand for Interventional Angiography in Minimally Invasive Surgeries.
6. What are the notable trends driving market growth?
The Hospital Segment is Expected to Dominate the Market During the Forecast Period.
7. Are there any restraints impacting market growth?
; High Procedure and Equipment Cost; Risks Associated with Angiography Procedures.
8. Can you provide examples of recent developments in the market?
N/A
9. What pricing options are available for accessing the report?
Pricing options include single-user, multi-user, and enterprise licenses priced at USD 4750, USD 5250, and USD 8750 respectively.
10. Is the market size provided in terms of value or volume?
The market size is provided in terms of value, measured in Million and volume, measured in K Unit.
11. Are there any specific market keywords associated with the report?
Yes, the market keyword associated with the report is "Angiography Devices Market," which aids in identifying and referencing the specific market segment covered.
12. How do I determine which pricing option suits my needs best?
The pricing options vary based on user requirements and access needs. Individual users may opt for single-user licenses, while businesses requiring broader access may choose multi-user or enterprise licenses for cost-effective access to the report.
13. Are there any additional resources or data provided in the Angiography Devices Market report?
While the report offers comprehensive insights, it's advisable to review the specific contents or supplementary materials provided to ascertain if additional resources or data are available.
14. How can I stay updated on further developments or reports in the Angiography Devices Market?
To stay informed about further developments, trends, and reports in the Angiography Devices Market, consider subscribing to industry newsletters, following relevant companies and organizations, or regularly checking reputable industry news sources and publications.
Methodology
Step 1 - Identification of Relevant Samples Size from Population Database


Step 2 - Approaches for Defining Global Market Size (Value, Volume* & Price*)

Note*: In applicable scenarios
Step 3 - Data Sources
Primary Research
- Web Analytics
- Survey Reports
- Research Institute
- Latest Research Reports
- Opinion Leaders
Secondary Research
- Annual Reports
- White Paper
- Latest Press Release
- Industry Association
- Paid Database
- Investor Presentations

Step 4 - Data Triangulation
Involves using different sources of information in order to increase the validity of a study
These sources are likely to be stakeholders in a program - participants, other researchers, program staff, other community members, and so on.
Then we put all data in single framework & apply various statistical tools to find out the dynamic on the market.
During the analysis stage, feedback from the stakeholder groups would be compared to determine areas of agreement as well as areas of divergence
