

Key Insights
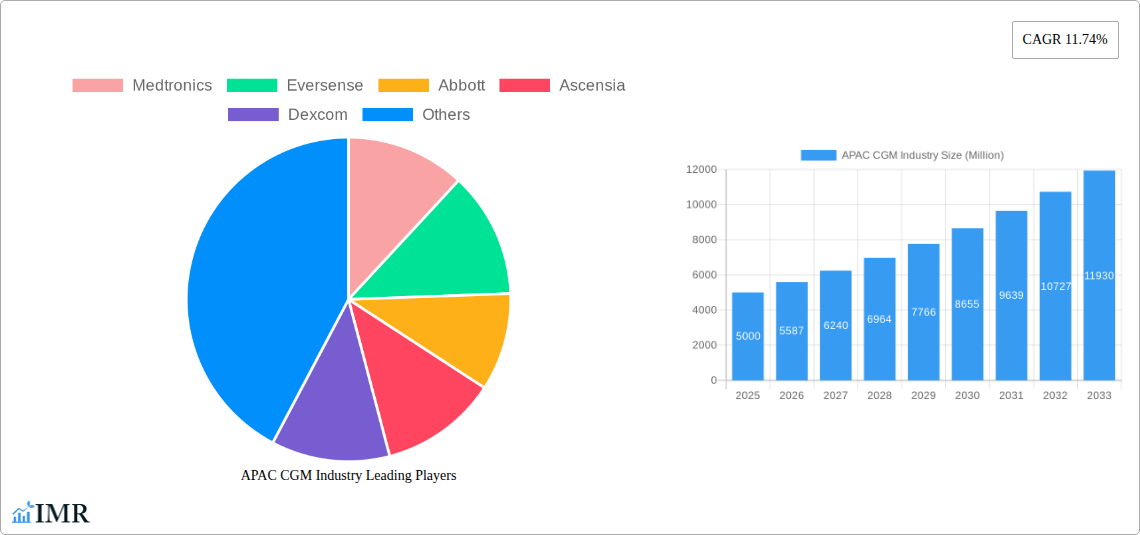
The Asia-Pacific (APAC) continuous glucose monitoring (CGM) market is experiencing robust growth, driven by rising diabetes prevalence, increasing awareness of advanced diabetes management techniques, and technological advancements leading to smaller, more user-friendly devices. The region's diverse demographics and varying healthcare infrastructure present both opportunities and challenges. China, India, and Japan represent significant market segments, exhibiting substantial growth potential due to their large diabetic populations and expanding healthcare spending. However, factors such as high device costs, limited healthcare access in certain areas, and a lack of awareness about CGM technology in some regions pose restraints. The market is segmented by components (sensors and consumables) reflecting the inherent device structure and consumable nature of the sensor elements. Key players like Medtronic, Eversense, Abbott, Ascensia, and Dexcom are actively competing through product innovation, strategic partnerships, and expansion initiatives. Growth will likely be fueled by government initiatives promoting diabetes care, rising disposable incomes, and an increasing preference for non-invasive monitoring methods.
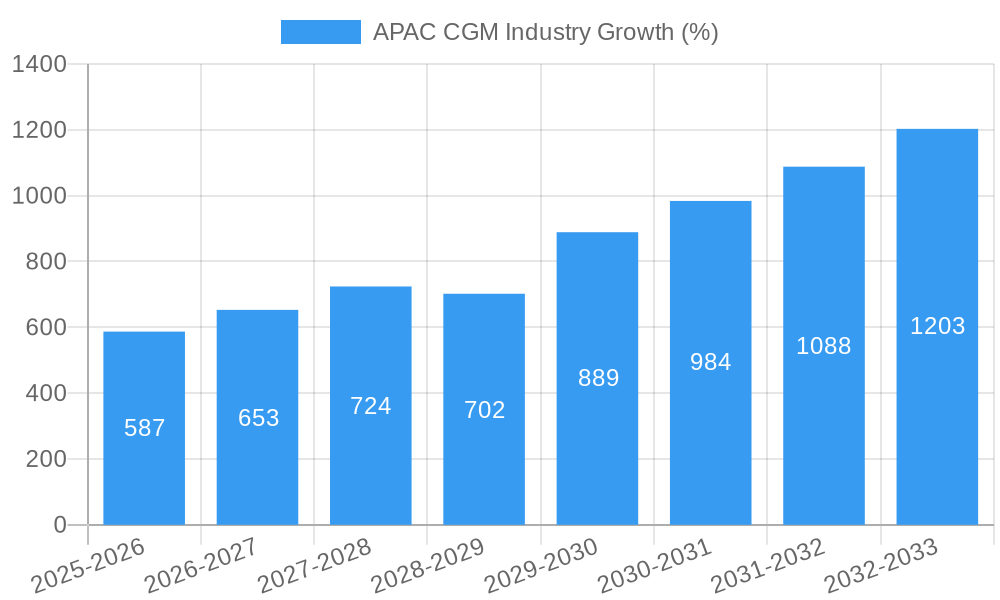
The forecast period (2025-2033) anticipates continued expansion at a compound annual growth rate (CAGR) of 11.74%, building upon the historical period (2019-2024). This growth is projected to be driven by a combination of factors, including the increasing adoption of CGM systems within established healthcare systems and the continued expansion of these systems into emerging markets across APAC. This will be coupled with continued advancements in device technology that improve accuracy, reduce costs, and enhance usability, all leading to an even wider adoption amongst diabetics. The market segmentation will remain significant, with the sensor and durable components driving individual growth trends, although the overall market growth will reflect both segments' combined performances. Future growth projections necessitate continuous monitoring of regional regulatory landscapes and healthcare policy changes.
APAC CGM Industry Market Report: 2019-2033
This comprehensive report provides a detailed analysis of the Asia-Pacific (APAC) Continuous Glucose Monitoring (CGM) industry, offering invaluable insights for industry professionals, investors, and strategic decision-makers. Covering the period from 2019 to 2033, with a focus on 2025, this report meticulously examines market dynamics, growth trends, dominant players, and future opportunities within the APAC CGM market. The report segments the market by component (Sensors and Durables) and analyzes key players like Medtronic, Eversense, Abbott, Ascensia, and Dexcom.
APAC CGM Industry Market Dynamics & Structure
This section analyzes the APAC CGM market's structure, encompassing market concentration, technological innovation, regulatory landscapes, competitive substitutes, end-user demographics, and merger & acquisition (M&A) trends. The analysis considers the influence of these factors on market growth and competitiveness.
- Market Concentration: The APAC CGM market exhibits a moderately concentrated structure, with a few major players holding significant market share. The market share of the top 5 players is estimated at xx% in 2025.
- Technological Innovation: Technological advancements, such as improved sensor accuracy, smaller device sizes, and integrated data management systems, are key drivers of market growth. Innovation barriers include high R&D costs and stringent regulatory approvals.
- Regulatory Frameworks: Varying regulatory approvals and reimbursement policies across APAC countries significantly influence market access and adoption rates. The recent expansion of reimbursement coverage in Japan (as detailed in the "Notable Milestones" section) exemplifies the impact of regulatory changes.
- Competitive Product Substitutes: While CGM systems are becoming increasingly popular, they face competition from traditional blood glucose monitoring methods. However, the convenience and accuracy of CGM are driving market shift.
- End-User Demographics: The growing prevalence of diabetes, particularly in countries like China and India, fuels the demand for CGM systems. The aging population also contributes to the market's expansion.
- M&A Trends: The APAC CGM industry has witnessed a moderate level of M&A activity in recent years, primarily focused on strategic partnerships and distribution agreements. The number of M&A deals in the sector totaled xx in the period 2019-2024.
APAC CGM Industry Growth Trends & Insights
This section leverages extensive market research data to analyze the evolution of market size, adoption rates, technological disruptions, and shifting consumer behaviors within the APAC CGM industry.
The APAC CGM market witnessed significant growth during the historical period (2019-2024), expanding from xx million units in 2019 to xx million units in 2024. This represents a CAGR of xx%. The market is projected to continue its growth trajectory during the forecast period (2025-2033), reaching xx million units by 2033, with a projected CAGR of xx%. Increased awareness of diabetes management, technological advancements, and favorable reimbursement policies are driving this growth. Market penetration is expected to increase from xx% in 2024 to xx% by 2033. Consumer behavior is shifting towards greater preference for convenient and accurate CGM technology, impacting market dynamics.
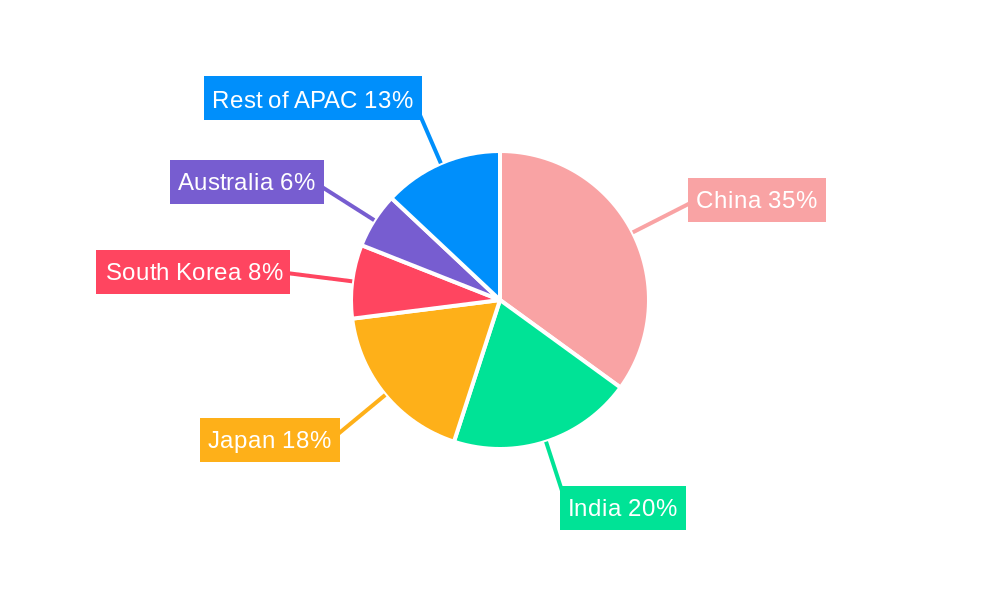
Dominant Regions, Countries, or Segments in APAC CGM Industry
This section identifies the leading region, country, or segment within the APAC CGM market, focusing on both the Sensors and Durables components.
Dominant Segment: Sensors
The sensors segment currently dominates the APAC CGM market, accounting for approximately xx% of the total market value in 2025. This dominance is driven by the higher frequency of sensor replacements compared to durable components. High demand and continuous innovation in sensor technology further contribute to its significant market share.
- Key Drivers:
- Increasing prevalence of diabetes
- Technological advancements leading to improved accuracy and comfort
- Growing adoption of CGM among healthcare providers and patients
- Favorable reimbursement policies in certain countries
Dominant Country: Japan
Japan represents a significant market for CGM systems in APAC, owing to its advanced healthcare infrastructure, high diabetes prevalence, and proactive government support. The expanded reimbursement coverage for the FreeStyle Libre system further strengthens its position as a leading market.
- Key Drivers:
- High prevalence of diabetes
- Advanced healthcare infrastructure
- Favorable regulatory environment and reimbursement policies
- Strong technological adoption among consumers and healthcare professionals
APAC CGM Industry Product Landscape
The APAC CGM market features a diverse range of products, with continuous innovation driving improvements in accuracy, usability, and data integration. New systems incorporate advanced features such as smaller sensor sizes, improved wearability, and integrated mobile applications for seamless data monitoring and sharing. These features cater to evolving user preferences and enhance the overall patient experience. Unique selling propositions include features such as longer sensor lifespans, real-time data transmission, and integration with insulin pump systems.
Key Drivers, Barriers & Challenges in APAC CGM Industry
Key Drivers:
Technological advancements, rising diabetes prevalence, growing awareness of effective diabetes management, and supportive government policies (e.g., reimbursement schemes) are significant market drivers. The increasing affordability of CGM systems also contributes to market expansion.
Key Challenges and Restraints:
High initial costs associated with CGM systems, limited reimbursement coverage in certain regions, and potential supply chain disruptions due to global events pose challenges to market growth. Stringent regulatory approvals and competition from established blood glucose monitoring methods also hinder market expansion. The competitive landscape, with established players and emerging competitors, creates further pressure.
Emerging Opportunities in APAC CGM Industry
Untapped markets in less-developed regions of APAC present significant growth opportunities. The development of innovative applications, such as integration with wearable health trackers and remote patient monitoring systems, enhances the value proposition of CGM. Evolving consumer preferences towards personalized healthcare and proactive disease management will continue to drive the demand for CGM systems. This includes expansion into new user segments and focus on disease prevention.
Growth Accelerators in the APAC CGM Industry
Technological advancements, such as the development of more accurate, user-friendly, and affordable CGM systems, are key catalysts for long-term growth. Strategic partnerships and collaborations between CGM manufacturers and healthcare providers facilitate wider market adoption. Expansion into new markets and the development of tailored solutions for specific demographics will further accelerate market growth.
Key Players Shaping the APAC CGM Industry Market
Notable Milestones in APAC CGM Industry Sector
- July 2021: Dexcom and Terumo Corporation signed an agreement for exclusively distributing Dexcom G6 across Japan. This significantly expanded Dexcom's market reach in a key APAC country.
- March 2022: Abbott announced expanded reimbursement coverage in Japan for the FreeStyle Libre system. This broadened access to CGM technology for a larger segment of the Japanese diabetic population, stimulating market growth.
In-Depth APAC CGM Industry Market Outlook
The APAC CGM market is poised for continued robust growth, driven by technological innovations, expanding reimbursement coverage, and rising diabetes prevalence. Strategic opportunities exist for companies to focus on developing user-friendly, affordable, and technologically advanced CGM systems tailored to specific regional needs. Expansion into underserved markets and leveraging digital health platforms for improved patient management will further drive long-term growth and create significant value for stakeholders.
APAC CGM Industry Segmentation
-
1. Component
- 1.1. Sensors
- 1.2. Durables
-
2. Geography
- 2.1. Australia
- 2.2. China
- 2.3. India
- 2.4. Indonesia
- 2.5. Japan
- 2.6. Malaysia
- 2.7. Philippines
- 2.8. South Korea
- 2.9. Thailand
- 2.10. Vietnam
- 2.11. Rest of Asia-Pacific
APAC CGM Industry Segmentation By Geography
- 1. Australia
- 2. China
- 3. India
- 4. Indonesia
- 5. Japan
- 6. Malaysia
- 7. Philippines
- 8. South Korea
- 9. Thailand
- 10. Vietnam
- 11. Rest of Asia Pacific
APAC CGM Industry REPORT HIGHLIGHTS
| Aspects | Details |
|---|---|
| Study Period | 2019-2033 |
| Base Year | 2024 |
| Estimated Year | 2025 |
| Forecast Period | 2025-2033 |
| Historical Period | 2019-2024 |
| Growth Rate | CAGR of 11.74% from 2019-2033 |
| Segmentation |
|
Table of Contents
- 1. Introduction
- 1.1. Research Scope
- 1.2. Market Segmentation
- 1.3. Research Methodology
- 1.4. Definitions and Assumptions
- 2. Executive Summary
- 2.1. Introduction
- 3. Market Dynamics
- 3.1. Introduction
- 3.2. Market Drivers
- 3.2.1. Growing Burden of Gastrointestinal Diseases; Rising Preference of Point of Care Test
- 3.3. Market Restrains
- 3.3.1. High Cost of Instruments
- 3.4. Market Trends
- 3.4.1. The sensors Segment is having the highest market share in Asia-Pacific Continuous Glucose Monitoring Market.
- 4. Market Factor Analysis
- 4.1. Porters Five Forces
- 4.2. Supply/Value Chain
- 4.3. PESTEL analysis
- 4.4. Market Entropy
- 4.5. Patent/Trademark Analysis
- 5. Global APAC CGM Industry Analysis, Insights and Forecast, 2019-2031
- 5.1. Market Analysis, Insights and Forecast - by Component
- 5.1.1. Sensors
- 5.1.2. Durables
- 5.2. Market Analysis, Insights and Forecast - by Geography
- 5.2.1. Australia
- 5.2.2. China
- 5.2.3. India
- 5.2.4. Indonesia
- 5.2.5. Japan
- 5.2.6. Malaysia
- 5.2.7. Philippines
- 5.2.8. South Korea
- 5.2.9. Thailand
- 5.2.10. Vietnam
- 5.2.11. Rest of Asia-Pacific
- 5.3. Market Analysis, Insights and Forecast - by Region
- 5.3.1. Australia
- 5.3.2. China
- 5.3.3. India
- 5.3.4. Indonesia
- 5.3.5. Japan
- 5.3.6. Malaysia
- 5.3.7. Philippines
- 5.3.8. South Korea
- 5.3.9. Thailand
- 5.3.10. Vietnam
- 5.3.11. Rest of Asia Pacific
- 5.1. Market Analysis, Insights and Forecast - by Component
- 6. Australia APAC CGM Industry Analysis, Insights and Forecast, 2019-2031
- 6.1. Market Analysis, Insights and Forecast - by Component
- 6.1.1. Sensors
- 6.1.2. Durables
- 6.2. Market Analysis, Insights and Forecast - by Geography
- 6.2.1. Australia
- 6.2.2. China
- 6.2.3. India
- 6.2.4. Indonesia
- 6.2.5. Japan
- 6.2.6. Malaysia
- 6.2.7. Philippines
- 6.2.8. South Korea
- 6.2.9. Thailand
- 6.2.10. Vietnam
- 6.2.11. Rest of Asia-Pacific
- 6.1. Market Analysis, Insights and Forecast - by Component
- 7. China APAC CGM Industry Analysis, Insights and Forecast, 2019-2031
- 7.1. Market Analysis, Insights and Forecast - by Component
- 7.1.1. Sensors
- 7.1.2. Durables
- 7.2. Market Analysis, Insights and Forecast - by Geography
- 7.2.1. Australia
- 7.2.2. China
- 7.2.3. India
- 7.2.4. Indonesia
- 7.2.5. Japan
- 7.2.6. Malaysia
- 7.2.7. Philippines
- 7.2.8. South Korea
- 7.2.9. Thailand
- 7.2.10. Vietnam
- 7.2.11. Rest of Asia-Pacific
- 7.1. Market Analysis, Insights and Forecast - by Component
- 8. India APAC CGM Industry Analysis, Insights and Forecast, 2019-2031
- 8.1. Market Analysis, Insights and Forecast - by Component
- 8.1.1. Sensors
- 8.1.2. Durables
- 8.2. Market Analysis, Insights and Forecast - by Geography
- 8.2.1. Australia
- 8.2.2. China
- 8.2.3. India
- 8.2.4. Indonesia
- 8.2.5. Japan
- 8.2.6. Malaysia
- 8.2.7. Philippines
- 8.2.8. South Korea
- 8.2.9. Thailand
- 8.2.10. Vietnam
- 8.2.11. Rest of Asia-Pacific
- 8.1. Market Analysis, Insights and Forecast - by Component
- 9. Indonesia APAC CGM Industry Analysis, Insights and Forecast, 2019-2031
- 9.1. Market Analysis, Insights and Forecast - by Component
- 9.1.1. Sensors
- 9.1.2. Durables
- 9.2. Market Analysis, Insights and Forecast - by Geography
- 9.2.1. Australia
- 9.2.2. China
- 9.2.3. India
- 9.2.4. Indonesia
- 9.2.5. Japan
- 9.2.6. Malaysia
- 9.2.7. Philippines
- 9.2.8. South Korea
- 9.2.9. Thailand
- 9.2.10. Vietnam
- 9.2.11. Rest of Asia-Pacific
- 9.1. Market Analysis, Insights and Forecast - by Component
- 10. Japan APAC CGM Industry Analysis, Insights and Forecast, 2019-2031
- 10.1. Market Analysis, Insights and Forecast - by Component
- 10.1.1. Sensors
- 10.1.2. Durables
- 10.2. Market Analysis, Insights and Forecast - by Geography
- 10.2.1. Australia
- 10.2.2. China
- 10.2.3. India
- 10.2.4. Indonesia
- 10.2.5. Japan
- 10.2.6. Malaysia
- 10.2.7. Philippines
- 10.2.8. South Korea
- 10.2.9. Thailand
- 10.2.10. Vietnam
- 10.2.11. Rest of Asia-Pacific
- 10.1. Market Analysis, Insights and Forecast - by Component
- 11. Malaysia APAC CGM Industry Analysis, Insights and Forecast, 2019-2031
- 11.1. Market Analysis, Insights and Forecast - by Component
- 11.1.1. Sensors
- 11.1.2. Durables
- 11.2. Market Analysis, Insights and Forecast - by Geography
- 11.2.1. Australia
- 11.2.2. China
- 11.2.3. India
- 11.2.4. Indonesia
- 11.2.5. Japan
- 11.2.6. Malaysia
- 11.2.7. Philippines
- 11.2.8. South Korea
- 11.2.9. Thailand
- 11.2.10. Vietnam
- 11.2.11. Rest of Asia-Pacific
- 11.1. Market Analysis, Insights and Forecast - by Component
- 12. Philippines APAC CGM Industry Analysis, Insights and Forecast, 2019-2031
- 12.1. Market Analysis, Insights and Forecast - by Component
- 12.1.1. Sensors
- 12.1.2. Durables
- 12.2. Market Analysis, Insights and Forecast - by Geography
- 12.2.1. Australia
- 12.2.2. China
- 12.2.3. India
- 12.2.4. Indonesia
- 12.2.5. Japan
- 12.2.6. Malaysia
- 12.2.7. Philippines
- 12.2.8. South Korea
- 12.2.9. Thailand
- 12.2.10. Vietnam
- 12.2.11. Rest of Asia-Pacific
- 12.1. Market Analysis, Insights and Forecast - by Component
- 13. South Korea APAC CGM Industry Analysis, Insights and Forecast, 2019-2031
- 13.1. Market Analysis, Insights and Forecast - by Component
- 13.1.1. Sensors
- 13.1.2. Durables
- 13.2. Market Analysis, Insights and Forecast - by Geography
- 13.2.1. Australia
- 13.2.2. China
- 13.2.3. India
- 13.2.4. Indonesia
- 13.2.5. Japan
- 13.2.6. Malaysia
- 13.2.7. Philippines
- 13.2.8. South Korea
- 13.2.9. Thailand
- 13.2.10. Vietnam
- 13.2.11. Rest of Asia-Pacific
- 13.1. Market Analysis, Insights and Forecast - by Component
- 14. Thailand APAC CGM Industry Analysis, Insights and Forecast, 2019-2031
- 14.1. Market Analysis, Insights and Forecast - by Component
- 14.1.1. Sensors
- 14.1.2. Durables
- 14.2. Market Analysis, Insights and Forecast - by Geography
- 14.2.1. Australia
- 14.2.2. China
- 14.2.3. India
- 14.2.4. Indonesia
- 14.2.5. Japan
- 14.2.6. Malaysia
- 14.2.7. Philippines
- 14.2.8. South Korea
- 14.2.9. Thailand
- 14.2.10. Vietnam
- 14.2.11. Rest of Asia-Pacific
- 14.1. Market Analysis, Insights and Forecast - by Component
- 15. Vietnam APAC CGM Industry Analysis, Insights and Forecast, 2019-2031
- 15.1. Market Analysis, Insights and Forecast - by Component
- 15.1.1. Sensors
- 15.1.2. Durables
- 15.2. Market Analysis, Insights and Forecast - by Geography
- 15.2.1. Australia
- 15.2.2. China
- 15.2.3. India
- 15.2.4. Indonesia
- 15.2.5. Japan
- 15.2.6. Malaysia
- 15.2.7. Philippines
- 15.2.8. South Korea
- 15.2.9. Thailand
- 15.2.10. Vietnam
- 15.2.11. Rest of Asia-Pacific
- 15.1. Market Analysis, Insights and Forecast - by Component
- 16. Rest of Asia Pacific APAC CGM Industry Analysis, Insights and Forecast, 2019-2031
- 16.1. Market Analysis, Insights and Forecast - by Component
- 16.1.1. Sensors
- 16.1.2. Durables
- 16.2. Market Analysis, Insights and Forecast - by Geography
- 16.2.1. Australia
- 16.2.2. China
- 16.2.3. India
- 16.2.4. Indonesia
- 16.2.5. Japan
- 16.2.6. Malaysia
- 16.2.7. Philippines
- 16.2.8. South Korea
- 16.2.9. Thailand
- 16.2.10. Vietnam
- 16.2.11. Rest of Asia-Pacific
- 16.1. Market Analysis, Insights and Forecast - by Component
- 17. China APAC CGM Industry Analysis, Insights and Forecast, 2019-2031
- 18. Japan APAC CGM Industry Analysis, Insights and Forecast, 2019-2031
- 19. India APAC CGM Industry Analysis, Insights and Forecast, 2019-2031
- 20. South Korea APAC CGM Industry Analysis, Insights and Forecast, 2019-2031
- 21. Taiwan APAC CGM Industry Analysis, Insights and Forecast, 2019-2031
- 22. Australia APAC CGM Industry Analysis, Insights and Forecast, 2019-2031
- 23. Rest of Asia-Pacific APAC CGM Industry Analysis, Insights and Forecast, 2019-2031
- 24. Competitive Analysis
- 24.1. Global Market Share Analysis 2024
- 24.2. Company Profiles
- 24.2.1 Medtronics
- 24.2.1.1. Overview
- 24.2.1.2. Products
- 24.2.1.3. SWOT Analysis
- 24.2.1.4. Recent Developments
- 24.2.1.5. Financials (Based on Availability)
- 24.2.2 Eversense
- 24.2.2.1. Overview
- 24.2.2.2. Products
- 24.2.2.3. SWOT Analysis
- 24.2.2.4. Recent Developments
- 24.2.2.5. Financials (Based on Availability)
- 24.2.3 Abbott
- 24.2.3.1. Overview
- 24.2.3.2. Products
- 24.2.3.3. SWOT Analysis
- 24.2.3.4. Recent Developments
- 24.2.3.5. Financials (Based on Availability)
- 24.2.4 Ascensia
- 24.2.4.1. Overview
- 24.2.4.2. Products
- 24.2.4.3. SWOT Analysis
- 24.2.4.4. Recent Developments
- 24.2.4.5. Financials (Based on Availability)
- 24.2.5 Dexcom
- 24.2.5.1. Overview
- 24.2.5.2. Products
- 24.2.5.3. SWOT Analysis
- 24.2.5.4. Recent Developments
- 24.2.5.5. Financials (Based on Availability)
- 24.2.1 Medtronics
List of Figures
- Figure 1: Global APAC CGM Industry Revenue Breakdown (Million, %) by Region 2024 & 2032
- Figure 2: Global APAC CGM Industry Volume Breakdown (K Unit, %) by Region 2024 & 2032
- Figure 3: Asia Pacific APAC CGM Industry Revenue (Million), by Country 2024 & 2032
- Figure 4: Asia Pacific APAC CGM Industry Volume (K Unit), by Country 2024 & 2032
- Figure 5: Asia Pacific APAC CGM Industry Revenue Share (%), by Country 2024 & 2032
- Figure 6: Asia Pacific APAC CGM Industry Volume Share (%), by Country 2024 & 2032
- Figure 7: Australia APAC CGM Industry Revenue (Million), by Component 2024 & 2032
- Figure 8: Australia APAC CGM Industry Volume (K Unit), by Component 2024 & 2032
- Figure 9: Australia APAC CGM Industry Revenue Share (%), by Component 2024 & 2032
- Figure 10: Australia APAC CGM Industry Volume Share (%), by Component 2024 & 2032
- Figure 11: Australia APAC CGM Industry Revenue (Million), by Geography 2024 & 2032
- Figure 12: Australia APAC CGM Industry Volume (K Unit), by Geography 2024 & 2032
- Figure 13: Australia APAC CGM Industry Revenue Share (%), by Geography 2024 & 2032
- Figure 14: Australia APAC CGM Industry Volume Share (%), by Geography 2024 & 2032
- Figure 15: Australia APAC CGM Industry Revenue (Million), by Country 2024 & 2032
- Figure 16: Australia APAC CGM Industry Volume (K Unit), by Country 2024 & 2032
- Figure 17: Australia APAC CGM Industry Revenue Share (%), by Country 2024 & 2032
- Figure 18: Australia APAC CGM Industry Volume Share (%), by Country 2024 & 2032
- Figure 19: China APAC CGM Industry Revenue (Million), by Component 2024 & 2032
- Figure 20: China APAC CGM Industry Volume (K Unit), by Component 2024 & 2032
- Figure 21: China APAC CGM Industry Revenue Share (%), by Component 2024 & 2032
- Figure 22: China APAC CGM Industry Volume Share (%), by Component 2024 & 2032
- Figure 23: China APAC CGM Industry Revenue (Million), by Geography 2024 & 2032
- Figure 24: China APAC CGM Industry Volume (K Unit), by Geography 2024 & 2032
- Figure 25: China APAC CGM Industry Revenue Share (%), by Geography 2024 & 2032
- Figure 26: China APAC CGM Industry Volume Share (%), by Geography 2024 & 2032
- Figure 27: China APAC CGM Industry Revenue (Million), by Country 2024 & 2032
- Figure 28: China APAC CGM Industry Volume (K Unit), by Country 2024 & 2032
- Figure 29: China APAC CGM Industry Revenue Share (%), by Country 2024 & 2032
- Figure 30: China APAC CGM Industry Volume Share (%), by Country 2024 & 2032
- Figure 31: India APAC CGM Industry Revenue (Million), by Component 2024 & 2032
- Figure 32: India APAC CGM Industry Volume (K Unit), by Component 2024 & 2032
- Figure 33: India APAC CGM Industry Revenue Share (%), by Component 2024 & 2032
- Figure 34: India APAC CGM Industry Volume Share (%), by Component 2024 & 2032
- Figure 35: India APAC CGM Industry Revenue (Million), by Geography 2024 & 2032
- Figure 36: India APAC CGM Industry Volume (K Unit), by Geography 2024 & 2032
- Figure 37: India APAC CGM Industry Revenue Share (%), by Geography 2024 & 2032
- Figure 38: India APAC CGM Industry Volume Share (%), by Geography 2024 & 2032
- Figure 39: India APAC CGM Industry Revenue (Million), by Country 2024 & 2032
- Figure 40: India APAC CGM Industry Volume (K Unit), by Country 2024 & 2032
- Figure 41: India APAC CGM Industry Revenue Share (%), by Country 2024 & 2032
- Figure 42: India APAC CGM Industry Volume Share (%), by Country 2024 & 2032
- Figure 43: Indonesia APAC CGM Industry Revenue (Million), by Component 2024 & 2032
- Figure 44: Indonesia APAC CGM Industry Volume (K Unit), by Component 2024 & 2032
- Figure 45: Indonesia APAC CGM Industry Revenue Share (%), by Component 2024 & 2032
- Figure 46: Indonesia APAC CGM Industry Volume Share (%), by Component 2024 & 2032
- Figure 47: Indonesia APAC CGM Industry Revenue (Million), by Geography 2024 & 2032
- Figure 48: Indonesia APAC CGM Industry Volume (K Unit), by Geography 2024 & 2032
- Figure 49: Indonesia APAC CGM Industry Revenue Share (%), by Geography 2024 & 2032
- Figure 50: Indonesia APAC CGM Industry Volume Share (%), by Geography 2024 & 2032
- Figure 51: Indonesia APAC CGM Industry Revenue (Million), by Country 2024 & 2032
- Figure 52: Indonesia APAC CGM Industry Volume (K Unit), by Country 2024 & 2032
- Figure 53: Indonesia APAC CGM Industry Revenue Share (%), by Country 2024 & 2032
- Figure 54: Indonesia APAC CGM Industry Volume Share (%), by Country 2024 & 2032
- Figure 55: Japan APAC CGM Industry Revenue (Million), by Component 2024 & 2032
- Figure 56: Japan APAC CGM Industry Volume (K Unit), by Component 2024 & 2032
- Figure 57: Japan APAC CGM Industry Revenue Share (%), by Component 2024 & 2032
- Figure 58: Japan APAC CGM Industry Volume Share (%), by Component 2024 & 2032
- Figure 59: Japan APAC CGM Industry Revenue (Million), by Geography 2024 & 2032
- Figure 60: Japan APAC CGM Industry Volume (K Unit), by Geography 2024 & 2032
- Figure 61: Japan APAC CGM Industry Revenue Share (%), by Geography 2024 & 2032
- Figure 62: Japan APAC CGM Industry Volume Share (%), by Geography 2024 & 2032
- Figure 63: Japan APAC CGM Industry Revenue (Million), by Country 2024 & 2032
- Figure 64: Japan APAC CGM Industry Volume (K Unit), by Country 2024 & 2032
- Figure 65: Japan APAC CGM Industry Revenue Share (%), by Country 2024 & 2032
- Figure 66: Japan APAC CGM Industry Volume Share (%), by Country 2024 & 2032
- Figure 67: Malaysia APAC CGM Industry Revenue (Million), by Component 2024 & 2032
- Figure 68: Malaysia APAC CGM Industry Volume (K Unit), by Component 2024 & 2032
- Figure 69: Malaysia APAC CGM Industry Revenue Share (%), by Component 2024 & 2032
- Figure 70: Malaysia APAC CGM Industry Volume Share (%), by Component 2024 & 2032
- Figure 71: Malaysia APAC CGM Industry Revenue (Million), by Geography 2024 & 2032
- Figure 72: Malaysia APAC CGM Industry Volume (K Unit), by Geography 2024 & 2032
- Figure 73: Malaysia APAC CGM Industry Revenue Share (%), by Geography 2024 & 2032
- Figure 74: Malaysia APAC CGM Industry Volume Share (%), by Geography 2024 & 2032
- Figure 75: Malaysia APAC CGM Industry Revenue (Million), by Country 2024 & 2032
- Figure 76: Malaysia APAC CGM Industry Volume (K Unit), by Country 2024 & 2032
- Figure 77: Malaysia APAC CGM Industry Revenue Share (%), by Country 2024 & 2032
- Figure 78: Malaysia APAC CGM Industry Volume Share (%), by Country 2024 & 2032
- Figure 79: Philippines APAC CGM Industry Revenue (Million), by Component 2024 & 2032
- Figure 80: Philippines APAC CGM Industry Volume (K Unit), by Component 2024 & 2032
- Figure 81: Philippines APAC CGM Industry Revenue Share (%), by Component 2024 & 2032
- Figure 82: Philippines APAC CGM Industry Volume Share (%), by Component 2024 & 2032
- Figure 83: Philippines APAC CGM Industry Revenue (Million), by Geography 2024 & 2032
- Figure 84: Philippines APAC CGM Industry Volume (K Unit), by Geography 2024 & 2032
- Figure 85: Philippines APAC CGM Industry Revenue Share (%), by Geography 2024 & 2032
- Figure 86: Philippines APAC CGM Industry Volume Share (%), by Geography 2024 & 2032
- Figure 87: Philippines APAC CGM Industry Revenue (Million), by Country 2024 & 2032
- Figure 88: Philippines APAC CGM Industry Volume (K Unit), by Country 2024 & 2032
- Figure 89: Philippines APAC CGM Industry Revenue Share (%), by Country 2024 & 2032
- Figure 90: Philippines APAC CGM Industry Volume Share (%), by Country 2024 & 2032
- Figure 91: South Korea APAC CGM Industry Revenue (Million), by Component 2024 & 2032
- Figure 92: South Korea APAC CGM Industry Volume (K Unit), by Component 2024 & 2032
- Figure 93: South Korea APAC CGM Industry Revenue Share (%), by Component 2024 & 2032
- Figure 94: South Korea APAC CGM Industry Volume Share (%), by Component 2024 & 2032
- Figure 95: South Korea APAC CGM Industry Revenue (Million), by Geography 2024 & 2032
- Figure 96: South Korea APAC CGM Industry Volume (K Unit), by Geography 2024 & 2032
- Figure 97: South Korea APAC CGM Industry Revenue Share (%), by Geography 2024 & 2032
- Figure 98: South Korea APAC CGM Industry Volume Share (%), by Geography 2024 & 2032
- Figure 99: South Korea APAC CGM Industry Revenue (Million), by Country 2024 & 2032
- Figure 100: South Korea APAC CGM Industry Volume (K Unit), by Country 2024 & 2032
- Figure 101: South Korea APAC CGM Industry Revenue Share (%), by Country 2024 & 2032
- Figure 102: South Korea APAC CGM Industry Volume Share (%), by Country 2024 & 2032
- Figure 103: Thailand APAC CGM Industry Revenue (Million), by Component 2024 & 2032
- Figure 104: Thailand APAC CGM Industry Volume (K Unit), by Component 2024 & 2032
- Figure 105: Thailand APAC CGM Industry Revenue Share (%), by Component 2024 & 2032
- Figure 106: Thailand APAC CGM Industry Volume Share (%), by Component 2024 & 2032
- Figure 107: Thailand APAC CGM Industry Revenue (Million), by Geography 2024 & 2032
- Figure 108: Thailand APAC CGM Industry Volume (K Unit), by Geography 2024 & 2032
- Figure 109: Thailand APAC CGM Industry Revenue Share (%), by Geography 2024 & 2032
- Figure 110: Thailand APAC CGM Industry Volume Share (%), by Geography 2024 & 2032
- Figure 111: Thailand APAC CGM Industry Revenue (Million), by Country 2024 & 2032
- Figure 112: Thailand APAC CGM Industry Volume (K Unit), by Country 2024 & 2032
- Figure 113: Thailand APAC CGM Industry Revenue Share (%), by Country 2024 & 2032
- Figure 114: Thailand APAC CGM Industry Volume Share (%), by Country 2024 & 2032
- Figure 115: Vietnam APAC CGM Industry Revenue (Million), by Component 2024 & 2032
- Figure 116: Vietnam APAC CGM Industry Volume (K Unit), by Component 2024 & 2032
- Figure 117: Vietnam APAC CGM Industry Revenue Share (%), by Component 2024 & 2032
- Figure 118: Vietnam APAC CGM Industry Volume Share (%), by Component 2024 & 2032
- Figure 119: Vietnam APAC CGM Industry Revenue (Million), by Geography 2024 & 2032
- Figure 120: Vietnam APAC CGM Industry Volume (K Unit), by Geography 2024 & 2032
- Figure 121: Vietnam APAC CGM Industry Revenue Share (%), by Geography 2024 & 2032
- Figure 122: Vietnam APAC CGM Industry Volume Share (%), by Geography 2024 & 2032
- Figure 123: Vietnam APAC CGM Industry Revenue (Million), by Country 2024 & 2032
- Figure 124: Vietnam APAC CGM Industry Volume (K Unit), by Country 2024 & 2032
- Figure 125: Vietnam APAC CGM Industry Revenue Share (%), by Country 2024 & 2032
- Figure 126: Vietnam APAC CGM Industry Volume Share (%), by Country 2024 & 2032
- Figure 127: Rest of Asia Pacific APAC CGM Industry Revenue (Million), by Component 2024 & 2032
- Figure 128: Rest of Asia Pacific APAC CGM Industry Volume (K Unit), by Component 2024 & 2032
- Figure 129: Rest of Asia Pacific APAC CGM Industry Revenue Share (%), by Component 2024 & 2032
- Figure 130: Rest of Asia Pacific APAC CGM Industry Volume Share (%), by Component 2024 & 2032
- Figure 131: Rest of Asia Pacific APAC CGM Industry Revenue (Million), by Geography 2024 & 2032
- Figure 132: Rest of Asia Pacific APAC CGM Industry Volume (K Unit), by Geography 2024 & 2032
- Figure 133: Rest of Asia Pacific APAC CGM Industry Revenue Share (%), by Geography 2024 & 2032
- Figure 134: Rest of Asia Pacific APAC CGM Industry Volume Share (%), by Geography 2024 & 2032
- Figure 135: Rest of Asia Pacific APAC CGM Industry Revenue (Million), by Country 2024 & 2032
- Figure 136: Rest of Asia Pacific APAC CGM Industry Volume (K Unit), by Country 2024 & 2032
- Figure 137: Rest of Asia Pacific APAC CGM Industry Revenue Share (%), by Country 2024 & 2032
- Figure 138: Rest of Asia Pacific APAC CGM Industry Volume Share (%), by Country 2024 & 2032
List of Tables
- Table 1: Global APAC CGM Industry Revenue Million Forecast, by Region 2019 & 2032
- Table 2: Global APAC CGM Industry Volume K Unit Forecast, by Region 2019 & 2032
- Table 3: Global APAC CGM Industry Revenue Million Forecast, by Component 2019 & 2032
- Table 4: Global APAC CGM Industry Volume K Unit Forecast, by Component 2019 & 2032
- Table 5: Global APAC CGM Industry Revenue Million Forecast, by Geography 2019 & 2032
- Table 6: Global APAC CGM Industry Volume K Unit Forecast, by Geography 2019 & 2032
- Table 7: Global APAC CGM Industry Revenue Million Forecast, by Region 2019 & 2032
- Table 8: Global APAC CGM Industry Volume K Unit Forecast, by Region 2019 & 2032
- Table 9: Global APAC CGM Industry Revenue Million Forecast, by Country 2019 & 2032
- Table 10: Global APAC CGM Industry Volume K Unit Forecast, by Country 2019 & 2032
- Table 11: China APAC CGM Industry Revenue (Million) Forecast, by Application 2019 & 2032
- Table 12: China APAC CGM Industry Volume (K Unit) Forecast, by Application 2019 & 2032
- Table 13: Japan APAC CGM Industry Revenue (Million) Forecast, by Application 2019 & 2032
- Table 14: Japan APAC CGM Industry Volume (K Unit) Forecast, by Application 2019 & 2032
- Table 15: India APAC CGM Industry Revenue (Million) Forecast, by Application 2019 & 2032
- Table 16: India APAC CGM Industry Volume (K Unit) Forecast, by Application 2019 & 2032
- Table 17: South Korea APAC CGM Industry Revenue (Million) Forecast, by Application 2019 & 2032
- Table 18: South Korea APAC CGM Industry Volume (K Unit) Forecast, by Application 2019 & 2032
- Table 19: Taiwan APAC CGM Industry Revenue (Million) Forecast, by Application 2019 & 2032
- Table 20: Taiwan APAC CGM Industry Volume (K Unit) Forecast, by Application 2019 & 2032
- Table 21: Australia APAC CGM Industry Revenue (Million) Forecast, by Application 2019 & 2032
- Table 22: Australia APAC CGM Industry Volume (K Unit) Forecast, by Application 2019 & 2032
- Table 23: Rest of Asia-Pacific APAC CGM Industry Revenue (Million) Forecast, by Application 2019 & 2032
- Table 24: Rest of Asia-Pacific APAC CGM Industry Volume (K Unit) Forecast, by Application 2019 & 2032
- Table 25: Global APAC CGM Industry Revenue Million Forecast, by Component 2019 & 2032
- Table 26: Global APAC CGM Industry Volume K Unit Forecast, by Component 2019 & 2032
- Table 27: Global APAC CGM Industry Revenue Million Forecast, by Geography 2019 & 2032
- Table 28: Global APAC CGM Industry Volume K Unit Forecast, by Geography 2019 & 2032
- Table 29: Global APAC CGM Industry Revenue Million Forecast, by Country 2019 & 2032
- Table 30: Global APAC CGM Industry Volume K Unit Forecast, by Country 2019 & 2032
- Table 31: Global APAC CGM Industry Revenue Million Forecast, by Component 2019 & 2032
- Table 32: Global APAC CGM Industry Volume K Unit Forecast, by Component 2019 & 2032
- Table 33: Global APAC CGM Industry Revenue Million Forecast, by Geography 2019 & 2032
- Table 34: Global APAC CGM Industry Volume K Unit Forecast, by Geography 2019 & 2032
- Table 35: Global APAC CGM Industry Revenue Million Forecast, by Country 2019 & 2032
- Table 36: Global APAC CGM Industry Volume K Unit Forecast, by Country 2019 & 2032
- Table 37: Global APAC CGM Industry Revenue Million Forecast, by Component 2019 & 2032
- Table 38: Global APAC CGM Industry Volume K Unit Forecast, by Component 2019 & 2032
- Table 39: Global APAC CGM Industry Revenue Million Forecast, by Geography 2019 & 2032
- Table 40: Global APAC CGM Industry Volume K Unit Forecast, by Geography 2019 & 2032
- Table 41: Global APAC CGM Industry Revenue Million Forecast, by Country 2019 & 2032
- Table 42: Global APAC CGM Industry Volume K Unit Forecast, by Country 2019 & 2032
- Table 43: Global APAC CGM Industry Revenue Million Forecast, by Component 2019 & 2032
- Table 44: Global APAC CGM Industry Volume K Unit Forecast, by Component 2019 & 2032
- Table 45: Global APAC CGM Industry Revenue Million Forecast, by Geography 2019 & 2032
- Table 46: Global APAC CGM Industry Volume K Unit Forecast, by Geography 2019 & 2032
- Table 47: Global APAC CGM Industry Revenue Million Forecast, by Country 2019 & 2032
- Table 48: Global APAC CGM Industry Volume K Unit Forecast, by Country 2019 & 2032
- Table 49: Global APAC CGM Industry Revenue Million Forecast, by Component 2019 & 2032
- Table 50: Global APAC CGM Industry Volume K Unit Forecast, by Component 2019 & 2032
- Table 51: Global APAC CGM Industry Revenue Million Forecast, by Geography 2019 & 2032
- Table 52: Global APAC CGM Industry Volume K Unit Forecast, by Geography 2019 & 2032
- Table 53: Global APAC CGM Industry Revenue Million Forecast, by Country 2019 & 2032
- Table 54: Global APAC CGM Industry Volume K Unit Forecast, by Country 2019 & 2032
- Table 55: Global APAC CGM Industry Revenue Million Forecast, by Component 2019 & 2032
- Table 56: Global APAC CGM Industry Volume K Unit Forecast, by Component 2019 & 2032
- Table 57: Global APAC CGM Industry Revenue Million Forecast, by Geography 2019 & 2032
- Table 58: Global APAC CGM Industry Volume K Unit Forecast, by Geography 2019 & 2032
- Table 59: Global APAC CGM Industry Revenue Million Forecast, by Country 2019 & 2032
- Table 60: Global APAC CGM Industry Volume K Unit Forecast, by Country 2019 & 2032
- Table 61: Global APAC CGM Industry Revenue Million Forecast, by Component 2019 & 2032
- Table 62: Global APAC CGM Industry Volume K Unit Forecast, by Component 2019 & 2032
- Table 63: Global APAC CGM Industry Revenue Million Forecast, by Geography 2019 & 2032
- Table 64: Global APAC CGM Industry Volume K Unit Forecast, by Geography 2019 & 2032
- Table 65: Global APAC CGM Industry Revenue Million Forecast, by Country 2019 & 2032
- Table 66: Global APAC CGM Industry Volume K Unit Forecast, by Country 2019 & 2032
- Table 67: Global APAC CGM Industry Revenue Million Forecast, by Component 2019 & 2032
- Table 68: Global APAC CGM Industry Volume K Unit Forecast, by Component 2019 & 2032
- Table 69: Global APAC CGM Industry Revenue Million Forecast, by Geography 2019 & 2032
- Table 70: Global APAC CGM Industry Volume K Unit Forecast, by Geography 2019 & 2032
- Table 71: Global APAC CGM Industry Revenue Million Forecast, by Country 2019 & 2032
- Table 72: Global APAC CGM Industry Volume K Unit Forecast, by Country 2019 & 2032
- Table 73: Global APAC CGM Industry Revenue Million Forecast, by Component 2019 & 2032
- Table 74: Global APAC CGM Industry Volume K Unit Forecast, by Component 2019 & 2032
- Table 75: Global APAC CGM Industry Revenue Million Forecast, by Geography 2019 & 2032
- Table 76: Global APAC CGM Industry Volume K Unit Forecast, by Geography 2019 & 2032
- Table 77: Global APAC CGM Industry Revenue Million Forecast, by Country 2019 & 2032
- Table 78: Global APAC CGM Industry Volume K Unit Forecast, by Country 2019 & 2032
- Table 79: Global APAC CGM Industry Revenue Million Forecast, by Component 2019 & 2032
- Table 80: Global APAC CGM Industry Volume K Unit Forecast, by Component 2019 & 2032
- Table 81: Global APAC CGM Industry Revenue Million Forecast, by Geography 2019 & 2032
- Table 82: Global APAC CGM Industry Volume K Unit Forecast, by Geography 2019 & 2032
- Table 83: Global APAC CGM Industry Revenue Million Forecast, by Country 2019 & 2032
- Table 84: Global APAC CGM Industry Volume K Unit Forecast, by Country 2019 & 2032
- Table 85: Global APAC CGM Industry Revenue Million Forecast, by Component 2019 & 2032
- Table 86: Global APAC CGM Industry Volume K Unit Forecast, by Component 2019 & 2032
- Table 87: Global APAC CGM Industry Revenue Million Forecast, by Geography 2019 & 2032
- Table 88: Global APAC CGM Industry Volume K Unit Forecast, by Geography 2019 & 2032
- Table 89: Global APAC CGM Industry Revenue Million Forecast, by Country 2019 & 2032
- Table 90: Global APAC CGM Industry Volume K Unit Forecast, by Country 2019 & 2032
Frequently Asked Questions
1. What is the projected Compound Annual Growth Rate (CAGR) of the APAC CGM Industry?
The projected CAGR is approximately 11.74%.
2. Which companies are prominent players in the APAC CGM Industry?
Key companies in the market include Medtronics, Eversense, Abbott, Ascensia, Dexcom.
3. What are the main segments of the APAC CGM Industry?
The market segments include Component, Geography.
4. Can you provide details about the market size?
The market size is estimated to be USD XX Million as of 2022.
5. What are some drivers contributing to market growth?
Growing Burden of Gastrointestinal Diseases; Rising Preference of Point of Care Test.
6. What are the notable trends driving market growth?
The sensors Segment is having the highest market share in Asia-Pacific Continuous Glucose Monitoring Market..
7. Are there any restraints impacting market growth?
High Cost of Instruments.
8. Can you provide examples of recent developments in the market?
March 2022: Abbott announced that it received expanded reimbursement coverage in Japan for the FreeStyle Libre system. Japan's Ministry of Health, Labor, and Welfare approved the expansion of the continuous glucose monitoring (CGM) system to include all people with diabetes who use insulin at least once per day.
9. What pricing options are available for accessing the report?
Pricing options include single-user, multi-user, and enterprise licenses priced at USD 4750, USD 5250, and USD 8750 respectively.
10. Is the market size provided in terms of value or volume?
The market size is provided in terms of value, measured in Million and volume, measured in K Unit.
11. Are there any specific market keywords associated with the report?
Yes, the market keyword associated with the report is "APAC CGM Industry," which aids in identifying and referencing the specific market segment covered.
12. How do I determine which pricing option suits my needs best?
The pricing options vary based on user requirements and access needs. Individual users may opt for single-user licenses, while businesses requiring broader access may choose multi-user or enterprise licenses for cost-effective access to the report.
13. Are there any additional resources or data provided in the APAC CGM Industry report?
While the report offers comprehensive insights, it's advisable to review the specific contents or supplementary materials provided to ascertain if additional resources or data are available.
14. How can I stay updated on further developments or reports in the APAC CGM Industry?
To stay informed about further developments, trends, and reports in the APAC CGM Industry, consider subscribing to industry newsletters, following relevant companies and organizations, or regularly checking reputable industry news sources and publications.
Methodology
Step 1 - Identification of Relevant Samples Size from Population Database


Step 2 - Approaches for Defining Global Market Size (Value, Volume* & Price*)

Note*: In applicable scenarios
Step 3 - Data Sources
Primary Research
- Web Analytics
- Survey Reports
- Research Institute
- Latest Research Reports
- Opinion Leaders
Secondary Research
- Annual Reports
- White Paper
- Latest Press Release
- Industry Association
- Paid Database
- Investor Presentations

Step 4 - Data Triangulation
Involves using different sources of information in order to increase the validity of a study
These sources are likely to be stakeholders in a program - participants, other researchers, program staff, other community members, and so on.
Then we put all data in single framework & apply various statistical tools to find out the dynamic on the market.
During the analysis stage, feedback from the stakeholder groups would be compared to determine areas of agreement as well as areas of divergence
