

Key Insights
The Asia-Pacific (APAC) commercial vehicle market is experiencing robust growth, driven by expanding e-commerce, infrastructure development, and a burgeoning need for efficient logistics solutions across diverse economies. The market's Compound Annual Growth Rate (CAGR) exceeding 4.00% indicates a consistently upward trajectory, projected to continue through 2033. Key segments driving this expansion include LPG-powered vehicles, which offer a cost-effective and relatively cleaner alternative to traditional fuels, and the burgeoning adoption of hybrid and electric commercial vehicles, reflecting a global shift towards sustainable transportation. The commercial vehicle segment itself is witnessing significant growth, fueled by increased demand for goods transportation and delivery services. Leading players like Toyota, Hyundai, Isuzu, and Tata Motors are strategically positioned to capitalize on this expansion, leveraging their established distribution networks and technological capabilities. While market penetration varies across countries, China, India, and Indonesia represent significant growth opportunities due to their expanding economies and large populations. Challenges include varying regulatory landscapes across the region, the need for substantial investments in charging infrastructure for electric vehicles, and potential supply chain disruptions.
The continued growth in the APAC commercial vehicle market is anticipated to be influenced by government policies promoting sustainable transportation, advancements in vehicle technology (particularly in hybrid and electric vehicles), and the ongoing expansion of e-commerce and related logistics needs. However, factors such as fluctuating fuel prices, economic volatility in certain regions, and potential competition from alternative transportation modes could present challenges. The market's segmentation into LPG, hybrid and electric, and various vehicle types provides detailed insights for manufacturers to tailor their strategies for maximum impact and market penetration. The diverse regional landscape necessitates a localized approach to address specific market demands and regulations within countries like Australia, China, India, Indonesia, Japan, Malaysia, South Korea, and Thailand. Furthermore, the competitive landscape, characterized by both established global players and regional manufacturers, necessitates a focus on innovation, cost efficiency, and robust after-sales service.
APAC Commercial Vehicle Market: A Comprehensive Report (2019-2033)
This in-depth report provides a comprehensive analysis of the Asia-Pacific (APAC) commercial vehicle market, encompassing historical data (2019-2024), current estimates (2025), and future forecasts (2025-2033). It delves into market dynamics, growth trends, regional variations, key players, and emerging opportunities within the diverse landscape of commercial vehicles across the APAC region. The report is crucial for industry professionals, investors, and strategic decision-makers seeking to understand and capitalize on this dynamic sector.

APAC Commercial Vehicle Market Market Dynamics & Structure
This section analyzes the competitive landscape, technological advancements, and regulatory influences shaping the APAC commercial vehicle market. We explore market concentration, examining the dominance of key players and the presence of smaller niche competitors. The report assesses the impact of technological innovations, particularly in propulsion systems (hybrid and electric vehicles) and alternative fuels (LPG). The role of government regulations and evolving emission standards is thoroughly examined, alongside an analysis of competitive product substitutes and their market penetration. Finally, the report investigates end-user demographics (e.g., logistics, construction, transportation) and the influence of mergers and acquisitions (M&A) activities on market consolidation.
- Market Concentration: The market shows a moderately concentrated structure, with xx% market share held by the top 5 players in 2024.
- Technological Innovation: A strong push towards electrification and alternative fuel vehicles is observed, driven by stringent emission regulations and growing environmental awareness.
- Regulatory Frameworks: Varying regulations across different APAC countries create both opportunities and challenges for market players. Stringent emission norms in countries like China and India drive the adoption of cleaner technologies.
- M&A Activity: The number of M&A deals in the APAC commercial vehicle sector has averaged xx deals per year between 2019 and 2024, signaling ongoing consolidation.
APAC Commercial Vehicle Market Growth Trends & Insights
This section presents a detailed analysis of the APAC commercial vehicle market's growth trajectory, leveraging robust data and analytical models. It explores the evolution of market size, focusing on both volume (million units) and value (xx million USD), and identifies key growth drivers and inhibitors. We analyze adoption rates of different vehicle types (e.g., trucks, buses, vans) and propulsion systems (diesel, gasoline, hybrid, electric), considering factors such as technological disruptions and evolving consumer preferences. The report provides a comprehensive picture of the market's growth potential, highlighting key performance indicators (KPIs) such as compound annual growth rate (CAGR) and market penetration rates for different segments and regions.

Dominant Regions, Countries, or Segments in APAC Commercial Vehicle Market
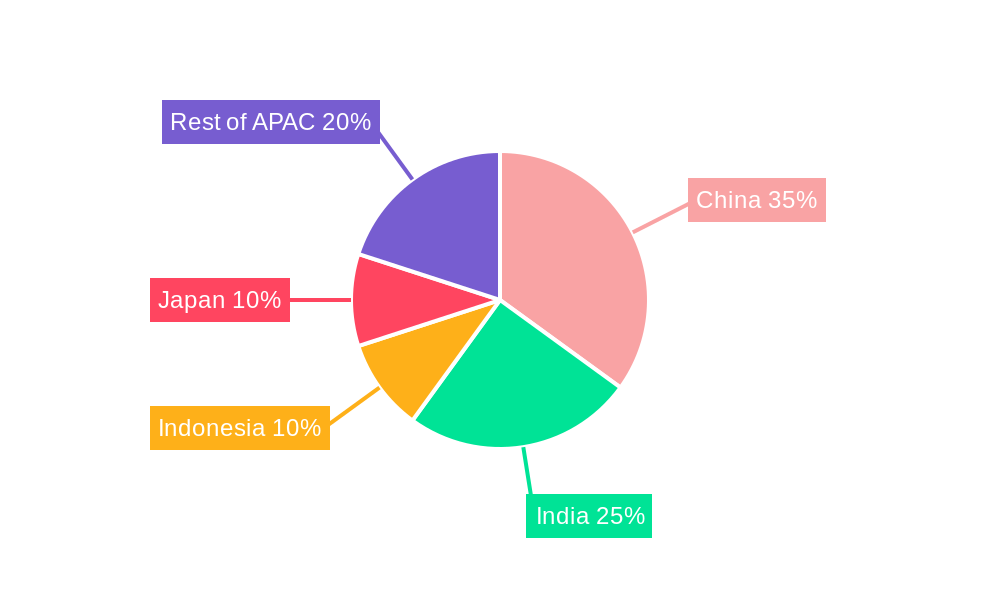
This section identifies the leading regions, countries, and segments within the APAC commercial vehicle market, focusing on their respective growth drivers and dominance factors. China, India, and Japan consistently emerge as the largest national markets, driven by strong economic growth, infrastructure development, and increasing industrialization. The segment analysis reveals the increasing adoption of hybrid and electric commercial vehicles, fueled by government incentives and growing environmental concerns.
- China: Dominant market share, driven by rapid industrialization and strong government support for electric vehicles.
- India: High growth potential due to expanding infrastructure projects and a burgeoning logistics sector.
- Japan: Mature market with significant technological advancements in hybrid and electric commercial vehicle technologies.
- Hybrid and Electric Vehicles: Fastest-growing segment, driven by environmental regulations and technological advancements.
APAC Commercial Vehicle Market Product Landscape
This section provides a concise overview of the product landscape, highlighting key product innovations, applications, and performance metrics within the APAC commercial vehicle market. It showcases the unique selling propositions (USPs) of different vehicle models, focusing on their technological advancements, fuel efficiency, safety features, and overall performance capabilities. The evolution of product design, incorporating features such as advanced driver-assistance systems (ADAS), telematics, and connectivity solutions, is also analyzed.
Key Drivers, Barriers & Challenges in APAC Commercial Vehicle Market
This section identifies the key factors driving market growth and the challenges hindering its expansion. Growth drivers include rising urbanization, infrastructure development, e-commerce growth, and government initiatives promoting sustainable transportation. Challenges include supply chain disruptions, high manufacturing costs, stringent emission standards, and intense competition among established and emerging players.
- Growth Drivers: Government incentives for electric vehicles, growing e-commerce sector, and infrastructure development.
- Challenges: Supply chain disruptions caused by geopolitical events, high raw material costs, and intense competition.
Emerging Opportunities in APAC Commercial Vehicle Market
This section highlights emerging opportunities in the APAC commercial vehicle market. These include the growing demand for electric and alternative fuel vehicles, the increasing adoption of autonomous driving technologies, and the expansion of shared mobility services. The development of niche markets for specialized commercial vehicles (e.g., last-mile delivery vehicles) also presents promising opportunities.
Growth Accelerators in the APAC Commercial Vehicle Market Industry
Technological advancements, strategic collaborations, and market expansion strategies are key catalysts driving long-term growth. Developments in battery technology, charging infrastructure, and autonomous driving systems are significantly impacting the market. Strategic partnerships between OEMs and technology providers accelerate innovation and market penetration. Expansion into new markets and untapped segments contributes to overall growth.
Key Players Shaping the APAC Commercial Vehicle Market Market
- Mazda Motor Corporation
- Subaru Corporation
- Wuling Motors Holdings Limite
- Nissan Motor Co Ltd
- Isuzu Motors Limited
- General Motors Company
- Anhui Ankai Automobile Co Ltd
- Dongfeng Motor Corporation
- Daihatsu Motor Co Ltd
- Tata Motors Limited
- Renault-Nissan-Mitsubishi Alliance
- Hyundai Motor Company
- Kia Corporation
- Toyota Motor Corporation
- Honda Motor Co Ltd
- Great Wall Motor Company Ltd (GWM)
- Mitsubishi Motors Corporation
- Suzuki Motor Corporation
- Ford Motor Company
Notable Milestones in APAC Commercial Vehicle Market Sector
- August 2023: General Motors announces the launch of an all-electric Cadillac Escalade in late 2024. This signals a significant commitment to the electric vehicle market in the APAC region.
- August 2023: General Motors reinforces its commitment to an electric future in the Middle East, indirectly impacting the APAC market through supply chains and technology transfers.
- August 2023: Toyota Kirloskar Motor launches the all-new MPV Vellfire strong hybrid electric vehicle (SHEV) in India, priced between INR 11.99 million and INR 12.99 million. This launch reflects the growing demand for hybrid vehicles in the APAC market.
In-Depth APAC Commercial Vehicle Market Market Outlook
The APAC commercial vehicle market is poised for significant growth in the coming years. Technological innovations, particularly in electric and autonomous vehicle technologies, will be key drivers of this expansion. Strategic partnerships and investments in infrastructure will further accelerate market development. Companies that adapt to evolving consumer preferences and regulatory requirements will be best positioned to capitalize on the substantial growth opportunities presented by this dynamic market. The focus on sustainability and emission reduction will continue to shape the industry landscape, demanding continuous innovation and adaptation from market players.
APAC Commercial Vehicle Market Segmentation
-
1. Vehicle Type
-
1.1. Commercial Vehicles
- 1.1.1. Buses
- 1.1.2. Heavy-duty Commercial Trucks
- 1.1.3. Light Commercial Pick-up Trucks
- 1.1.4. Light Commercial Vans
- 1.1.5. Medium-duty Commercial Trucks
-
1.1. Commercial Vehicles
-
2. Propulsion Type
-
2.1. Hybrid and Electric Vehicles
-
2.1.1. By Fuel Category
- 2.1.1.1. BEV
- 2.1.1.2. FCEV
- 2.1.1.3. HEV
- 2.1.1.4. PHEV
-
2.1.1. By Fuel Category
-
2.2. ICE
- 2.2.1. CNG
- 2.2.2. Diesel
- 2.2.3. Gasoline
- 2.2.4. LPG
-
2.1. Hybrid and Electric Vehicles
APAC Commercial Vehicle Market Segmentation By Geography
-
1. North America
- 1.1. United States
- 1.2. Canada
- 1.3. Mexico
-
2. South America
- 2.1. Brazil
- 2.2. Argentina
- 2.3. Rest of South America
-
3. Europe
- 3.1. United Kingdom
- 3.2. Germany
- 3.3. France
- 3.4. Italy
- 3.5. Spain
- 3.6. Russia
- 3.7. Benelux
- 3.8. Nordics
- 3.9. Rest of Europe
-
4. Middle East & Africa
- 4.1. Turkey
- 4.2. Israel
- 4.3. GCC
- 4.4. North Africa
- 4.5. South Africa
- 4.6. Rest of Middle East & Africa
-
5. Asia Pacific
- 5.1. China
- 5.2. India
- 5.3. Japan
- 5.4. South Korea
- 5.5. ASEAN
- 5.6. Oceania
- 5.7. Rest of Asia Pacific
APAC Commercial Vehicle Market REPORT HIGHLIGHTS
| Aspects | Details |
|---|---|
| Study Period | 2019-2033 |
| Base Year | 2024 |
| Estimated Year | 2025 |
| Forecast Period | 2025-2033 |
| Historical Period | 2019-2024 |
| Growth Rate | CAGR of > 4.00% from 2019-2033 |
| Segmentation |
|
Table of Contents
- 1. Introduction
- 1.1. Research Scope
- 1.2. Market Segmentation
- 1.3. Research Methodology
- 1.4. Definitions and Assumptions
- 2. Executive Summary
- 2.1. Introduction
- 3. Market Dynamics
- 3.1. Introduction
- 3.2. Market Drivers
- 3.2.1. Surge in Trend of Yacht Tourism
- 3.3. Market Restrains
- 3.3.1. Higher Rentals During Peak Season
- 3.4. Market Trends
- 3.4.1. OTHER KEY INDUSTRY TRENDS COVERED IN THE REPORT
- 4. Market Factor Analysis
- 4.1. Porters Five Forces
- 4.2. Supply/Value Chain
- 4.3. PESTEL analysis
- 4.4. Market Entropy
- 4.5. Patent/Trademark Analysis
- 5. Global APAC Commercial Vehicle Market Analysis, Insights and Forecast, 2019-2031
- 5.1. Market Analysis, Insights and Forecast - by Vehicle Type
- 5.1.1. Commercial Vehicles
- 5.1.1.1. Buses
- 5.1.1.2. Heavy-duty Commercial Trucks
- 5.1.1.3. Light Commercial Pick-up Trucks
- 5.1.1.4. Light Commercial Vans
- 5.1.1.5. Medium-duty Commercial Trucks
- 5.1.1. Commercial Vehicles
- 5.2. Market Analysis, Insights and Forecast - by Propulsion Type
- 5.2.1. Hybrid and Electric Vehicles
- 5.2.1.1. By Fuel Category
- 5.2.1.1.1. BEV
- 5.2.1.1.2. FCEV
- 5.2.1.1.3. HEV
- 5.2.1.1.4. PHEV
- 5.2.1.1. By Fuel Category
- 5.2.2. ICE
- 5.2.2.1. CNG
- 5.2.2.2. Diesel
- 5.2.2.3. Gasoline
- 5.2.2.4. LPG
- 5.2.1. Hybrid and Electric Vehicles
- 5.3. Market Analysis, Insights and Forecast - by Region
- 5.3.1. North America
- 5.3.2. South America
- 5.3.3. Europe
- 5.3.4. Middle East & Africa
- 5.3.5. Asia Pacific
- 5.1. Market Analysis, Insights and Forecast - by Vehicle Type
- 6. North America APAC Commercial Vehicle Market Analysis, Insights and Forecast, 2019-2031
- 6.1. Market Analysis, Insights and Forecast - by Vehicle Type
- 6.1.1. Commercial Vehicles
- 6.1.1.1. Buses
- 6.1.1.2. Heavy-duty Commercial Trucks
- 6.1.1.3. Light Commercial Pick-up Trucks
- 6.1.1.4. Light Commercial Vans
- 6.1.1.5. Medium-duty Commercial Trucks
- 6.1.1. Commercial Vehicles
- 6.2. Market Analysis, Insights and Forecast - by Propulsion Type
- 6.2.1. Hybrid and Electric Vehicles
- 6.2.1.1. By Fuel Category
- 6.2.1.1.1. BEV
- 6.2.1.1.2. FCEV
- 6.2.1.1.3. HEV
- 6.2.1.1.4. PHEV
- 6.2.1.1. By Fuel Category
- 6.2.2. ICE
- 6.2.2.1. CNG
- 6.2.2.2. Diesel
- 6.2.2.3. Gasoline
- 6.2.2.4. LPG
- 6.2.1. Hybrid and Electric Vehicles
- 6.1. Market Analysis, Insights and Forecast - by Vehicle Type
- 7. South America APAC Commercial Vehicle Market Analysis, Insights and Forecast, 2019-2031
- 7.1. Market Analysis, Insights and Forecast - by Vehicle Type
- 7.1.1. Commercial Vehicles
- 7.1.1.1. Buses
- 7.1.1.2. Heavy-duty Commercial Trucks
- 7.1.1.3. Light Commercial Pick-up Trucks
- 7.1.1.4. Light Commercial Vans
- 7.1.1.5. Medium-duty Commercial Trucks
- 7.1.1. Commercial Vehicles
- 7.2. Market Analysis, Insights and Forecast - by Propulsion Type
- 7.2.1. Hybrid and Electric Vehicles
- 7.2.1.1. By Fuel Category
- 7.2.1.1.1. BEV
- 7.2.1.1.2. FCEV
- 7.2.1.1.3. HEV
- 7.2.1.1.4. PHEV
- 7.2.1.1. By Fuel Category
- 7.2.2. ICE
- 7.2.2.1. CNG
- 7.2.2.2. Diesel
- 7.2.2.3. Gasoline
- 7.2.2.4. LPG
- 7.2.1. Hybrid and Electric Vehicles
- 7.1. Market Analysis, Insights and Forecast - by Vehicle Type
- 8. Europe APAC Commercial Vehicle Market Analysis, Insights and Forecast, 2019-2031
- 8.1. Market Analysis, Insights and Forecast - by Vehicle Type
- 8.1.1. Commercial Vehicles
- 8.1.1.1. Buses
- 8.1.1.2. Heavy-duty Commercial Trucks
- 8.1.1.3. Light Commercial Pick-up Trucks
- 8.1.1.4. Light Commercial Vans
- 8.1.1.5. Medium-duty Commercial Trucks
- 8.1.1. Commercial Vehicles
- 8.2. Market Analysis, Insights and Forecast - by Propulsion Type
- 8.2.1. Hybrid and Electric Vehicles
- 8.2.1.1. By Fuel Category
- 8.2.1.1.1. BEV
- 8.2.1.1.2. FCEV
- 8.2.1.1.3. HEV
- 8.2.1.1.4. PHEV
- 8.2.1.1. By Fuel Category
- 8.2.2. ICE
- 8.2.2.1. CNG
- 8.2.2.2. Diesel
- 8.2.2.3. Gasoline
- 8.2.2.4. LPG
- 8.2.1. Hybrid and Electric Vehicles
- 8.1. Market Analysis, Insights and Forecast - by Vehicle Type
- 9. Middle East & Africa APAC Commercial Vehicle Market Analysis, Insights and Forecast, 2019-2031
- 9.1. Market Analysis, Insights and Forecast - by Vehicle Type
- 9.1.1. Commercial Vehicles
- 9.1.1.1. Buses
- 9.1.1.2. Heavy-duty Commercial Trucks
- 9.1.1.3. Light Commercial Pick-up Trucks
- 9.1.1.4. Light Commercial Vans
- 9.1.1.5. Medium-duty Commercial Trucks
- 9.1.1. Commercial Vehicles
- 9.2. Market Analysis, Insights and Forecast - by Propulsion Type
- 9.2.1. Hybrid and Electric Vehicles
- 9.2.1.1. By Fuel Category
- 9.2.1.1.1. BEV
- 9.2.1.1.2. FCEV
- 9.2.1.1.3. HEV
- 9.2.1.1.4. PHEV
- 9.2.1.1. By Fuel Category
- 9.2.2. ICE
- 9.2.2.1. CNG
- 9.2.2.2. Diesel
- 9.2.2.3. Gasoline
- 9.2.2.4. LPG
- 9.2.1. Hybrid and Electric Vehicles
- 9.1. Market Analysis, Insights and Forecast - by Vehicle Type
- 10. Asia Pacific APAC Commercial Vehicle Market Analysis, Insights and Forecast, 2019-2031
- 10.1. Market Analysis, Insights and Forecast - by Vehicle Type
- 10.1.1. Commercial Vehicles
- 10.1.1.1. Buses
- 10.1.1.2. Heavy-duty Commercial Trucks
- 10.1.1.3. Light Commercial Pick-up Trucks
- 10.1.1.4. Light Commercial Vans
- 10.1.1.5. Medium-duty Commercial Trucks
- 10.1.1. Commercial Vehicles
- 10.2. Market Analysis, Insights and Forecast - by Propulsion Type
- 10.2.1. Hybrid and Electric Vehicles
- 10.2.1.1. By Fuel Category
- 10.2.1.1.1. BEV
- 10.2.1.1.2. FCEV
- 10.2.1.1.3. HEV
- 10.2.1.1.4. PHEV
- 10.2.1.1. By Fuel Category
- 10.2.2. ICE
- 10.2.2.1. CNG
- 10.2.2.2. Diesel
- 10.2.2.3. Gasoline
- 10.2.2.4. LPG
- 10.2.1. Hybrid and Electric Vehicles
- 10.1. Market Analysis, Insights and Forecast - by Vehicle Type
- 11. Competitive Analysis
- 11.1. Global Market Share Analysis 2024
- 11.2. Company Profiles
- 11.2.1 Mazda Motor Corporation
- 11.2.1.1. Overview
- 11.2.1.2. Products
- 11.2.1.3. SWOT Analysis
- 11.2.1.4. Recent Developments
- 11.2.1.5. Financials (Based on Availability)
- 11.2.2 Subaru Corporation
- 11.2.2.1. Overview
- 11.2.2.2. Products
- 11.2.2.3. SWOT Analysis
- 11.2.2.4. Recent Developments
- 11.2.2.5. Financials (Based on Availability)
- 11.2.3 Wuling Motors Holdings Limite
- 11.2.3.1. Overview
- 11.2.3.2. Products
- 11.2.3.3. SWOT Analysis
- 11.2.3.4. Recent Developments
- 11.2.3.5. Financials (Based on Availability)
- 11.2.4 Nissan Motor Co Ltd
- 11.2.4.1. Overview
- 11.2.4.2. Products
- 11.2.4.3. SWOT Analysis
- 11.2.4.4. Recent Developments
- 11.2.4.5. Financials (Based on Availability)
- 11.2.5 Isuzu Motors Limited
- 11.2.5.1. Overview
- 11.2.5.2. Products
- 11.2.5.3. SWOT Analysis
- 11.2.5.4. Recent Developments
- 11.2.5.5. Financials (Based on Availability)
- 11.2.6 General Motors Company
- 11.2.6.1. Overview
- 11.2.6.2. Products
- 11.2.6.3. SWOT Analysis
- 11.2.6.4. Recent Developments
- 11.2.6.5. Financials (Based on Availability)
- 11.2.7 Anhui Ankai Automobile Co Ltd
- 11.2.7.1. Overview
- 11.2.7.2. Products
- 11.2.7.3. SWOT Analysis
- 11.2.7.4. Recent Developments
- 11.2.7.5. Financials (Based on Availability)
- 11.2.8 Dongfeng Motor Corporation
- 11.2.8.1. Overview
- 11.2.8.2. Products
- 11.2.8.3. SWOT Analysis
- 11.2.8.4. Recent Developments
- 11.2.8.5. Financials (Based on Availability)
- 11.2.9 Daihatsu Motor Co Ltd
- 11.2.9.1. Overview
- 11.2.9.2. Products
- 11.2.9.3. SWOT Analysis
- 11.2.9.4. Recent Developments
- 11.2.9.5. Financials (Based on Availability)
- 11.2.10 Tata Motors Limited
- 11.2.10.1. Overview
- 11.2.10.2. Products
- 11.2.10.3. SWOT Analysis
- 11.2.10.4. Recent Developments
- 11.2.10.5. Financials (Based on Availability)
- 11.2.11 Renault-Nissan-Mitsubishi Alliance
- 11.2.11.1. Overview
- 11.2.11.2. Products
- 11.2.11.3. SWOT Analysis
- 11.2.11.4. Recent Developments
- 11.2.11.5. Financials (Based on Availability)
- 11.2.12 Hyundai Motor Company
- 11.2.12.1. Overview
- 11.2.12.2. Products
- 11.2.12.3. SWOT Analysis
- 11.2.12.4. Recent Developments
- 11.2.12.5. Financials (Based on Availability)
- 11.2.13 Kia Corporation
- 11.2.13.1. Overview
- 11.2.13.2. Products
- 11.2.13.3. SWOT Analysis
- 11.2.13.4. Recent Developments
- 11.2.13.5. Financials (Based on Availability)
- 11.2.14 Toyota Motor Corporation
- 11.2.14.1. Overview
- 11.2.14.2. Products
- 11.2.14.3. SWOT Analysis
- 11.2.14.4. Recent Developments
- 11.2.14.5. Financials (Based on Availability)
- 11.2.15 Honda Motor Co Ltd
- 11.2.15.1. Overview
- 11.2.15.2. Products
- 11.2.15.3. SWOT Analysis
- 11.2.15.4. Recent Developments
- 11.2.15.5. Financials (Based on Availability)
- 11.2.16 Great Wall Motor Company Ltd (GWM)
- 11.2.16.1. Overview
- 11.2.16.2. Products
- 11.2.16.3. SWOT Analysis
- 11.2.16.4. Recent Developments
- 11.2.16.5. Financials (Based on Availability)
- 11.2.17 Mitsubishi Motors Corporation
- 11.2.17.1. Overview
- 11.2.17.2. Products
- 11.2.17.3. SWOT Analysis
- 11.2.17.4. Recent Developments
- 11.2.17.5. Financials (Based on Availability)
- 11.2.18 Suzuki Motor Corporation
- 11.2.18.1. Overview
- 11.2.18.2. Products
- 11.2.18.3. SWOT Analysis
- 11.2.18.4. Recent Developments
- 11.2.18.5. Financials (Based on Availability)
- 11.2.19 Ford Motor Company
- 11.2.19.1. Overview
- 11.2.19.2. Products
- 11.2.19.3. SWOT Analysis
- 11.2.19.4. Recent Developments
- 11.2.19.5. Financials (Based on Availability)
- 11.2.1 Mazda Motor Corporation
List of Figures
- Figure 1: Global APAC Commercial Vehicle Market Revenue Breakdown (Million, %) by Region 2024 & 2032
- Figure 2: North America APAC Commercial Vehicle Market Revenue (Million), by Vehicle Type 2024 & 2032
- Figure 3: North America APAC Commercial Vehicle Market Revenue Share (%), by Vehicle Type 2024 & 2032
- Figure 4: North America APAC Commercial Vehicle Market Revenue (Million), by Propulsion Type 2024 & 2032
- Figure 5: North America APAC Commercial Vehicle Market Revenue Share (%), by Propulsion Type 2024 & 2032
- Figure 6: North America APAC Commercial Vehicle Market Revenue (Million), by Country 2024 & 2032
- Figure 7: North America APAC Commercial Vehicle Market Revenue Share (%), by Country 2024 & 2032
- Figure 8: South America APAC Commercial Vehicle Market Revenue (Million), by Vehicle Type 2024 & 2032
- Figure 9: South America APAC Commercial Vehicle Market Revenue Share (%), by Vehicle Type 2024 & 2032
- Figure 10: South America APAC Commercial Vehicle Market Revenue (Million), by Propulsion Type 2024 & 2032
- Figure 11: South America APAC Commercial Vehicle Market Revenue Share (%), by Propulsion Type 2024 & 2032
- Figure 12: South America APAC Commercial Vehicle Market Revenue (Million), by Country 2024 & 2032
- Figure 13: South America APAC Commercial Vehicle Market Revenue Share (%), by Country 2024 & 2032
- Figure 14: Europe APAC Commercial Vehicle Market Revenue (Million), by Vehicle Type 2024 & 2032
- Figure 15: Europe APAC Commercial Vehicle Market Revenue Share (%), by Vehicle Type 2024 & 2032
- Figure 16: Europe APAC Commercial Vehicle Market Revenue (Million), by Propulsion Type 2024 & 2032
- Figure 17: Europe APAC Commercial Vehicle Market Revenue Share (%), by Propulsion Type 2024 & 2032
- Figure 18: Europe APAC Commercial Vehicle Market Revenue (Million), by Country 2024 & 2032
- Figure 19: Europe APAC Commercial Vehicle Market Revenue Share (%), by Country 2024 & 2032
- Figure 20: Middle East & Africa APAC Commercial Vehicle Market Revenue (Million), by Vehicle Type 2024 & 2032
- Figure 21: Middle East & Africa APAC Commercial Vehicle Market Revenue Share (%), by Vehicle Type 2024 & 2032
- Figure 22: Middle East & Africa APAC Commercial Vehicle Market Revenue (Million), by Propulsion Type 2024 & 2032
- Figure 23: Middle East & Africa APAC Commercial Vehicle Market Revenue Share (%), by Propulsion Type 2024 & 2032
- Figure 24: Middle East & Africa APAC Commercial Vehicle Market Revenue (Million), by Country 2024 & 2032
- Figure 25: Middle East & Africa APAC Commercial Vehicle Market Revenue Share (%), by Country 2024 & 2032
- Figure 26: Asia Pacific APAC Commercial Vehicle Market Revenue (Million), by Vehicle Type 2024 & 2032
- Figure 27: Asia Pacific APAC Commercial Vehicle Market Revenue Share (%), by Vehicle Type 2024 & 2032
- Figure 28: Asia Pacific APAC Commercial Vehicle Market Revenue (Million), by Propulsion Type 2024 & 2032
- Figure 29: Asia Pacific APAC Commercial Vehicle Market Revenue Share (%), by Propulsion Type 2024 & 2032
- Figure 30: Asia Pacific APAC Commercial Vehicle Market Revenue (Million), by Country 2024 & 2032
- Figure 31: Asia Pacific APAC Commercial Vehicle Market Revenue Share (%), by Country 2024 & 2032
List of Tables
- Table 1: Global APAC Commercial Vehicle Market Revenue Million Forecast, by Region 2019 & 2032
- Table 2: Global APAC Commercial Vehicle Market Revenue Million Forecast, by Vehicle Type 2019 & 2032
- Table 3: Global APAC Commercial Vehicle Market Revenue Million Forecast, by Propulsion Type 2019 & 2032
- Table 4: Global APAC Commercial Vehicle Market Revenue Million Forecast, by Region 2019 & 2032
- Table 5: Global APAC Commercial Vehicle Market Revenue Million Forecast, by Vehicle Type 2019 & 2032
- Table 6: Global APAC Commercial Vehicle Market Revenue Million Forecast, by Propulsion Type 2019 & 2032
- Table 7: Global APAC Commercial Vehicle Market Revenue Million Forecast, by Country 2019 & 2032
- Table 8: United States APAC Commercial Vehicle Market Revenue (Million) Forecast, by Application 2019 & 2032
- Table 9: Canada APAC Commercial Vehicle Market Revenue (Million) Forecast, by Application 2019 & 2032
- Table 10: Mexico APAC Commercial Vehicle Market Revenue (Million) Forecast, by Application 2019 & 2032
- Table 11: Global APAC Commercial Vehicle Market Revenue Million Forecast, by Vehicle Type 2019 & 2032
- Table 12: Global APAC Commercial Vehicle Market Revenue Million Forecast, by Propulsion Type 2019 & 2032
- Table 13: Global APAC Commercial Vehicle Market Revenue Million Forecast, by Country 2019 & 2032
- Table 14: Brazil APAC Commercial Vehicle Market Revenue (Million) Forecast, by Application 2019 & 2032
- Table 15: Argentina APAC Commercial Vehicle Market Revenue (Million) Forecast, by Application 2019 & 2032
- Table 16: Rest of South America APAC Commercial Vehicle Market Revenue (Million) Forecast, by Application 2019 & 2032
- Table 17: Global APAC Commercial Vehicle Market Revenue Million Forecast, by Vehicle Type 2019 & 2032
- Table 18: Global APAC Commercial Vehicle Market Revenue Million Forecast, by Propulsion Type 2019 & 2032
- Table 19: Global APAC Commercial Vehicle Market Revenue Million Forecast, by Country 2019 & 2032
- Table 20: United Kingdom APAC Commercial Vehicle Market Revenue (Million) Forecast, by Application 2019 & 2032
- Table 21: Germany APAC Commercial Vehicle Market Revenue (Million) Forecast, by Application 2019 & 2032
- Table 22: France APAC Commercial Vehicle Market Revenue (Million) Forecast, by Application 2019 & 2032
- Table 23: Italy APAC Commercial Vehicle Market Revenue (Million) Forecast, by Application 2019 & 2032
- Table 24: Spain APAC Commercial Vehicle Market Revenue (Million) Forecast, by Application 2019 & 2032
- Table 25: Russia APAC Commercial Vehicle Market Revenue (Million) Forecast, by Application 2019 & 2032
- Table 26: Benelux APAC Commercial Vehicle Market Revenue (Million) Forecast, by Application 2019 & 2032
- Table 27: Nordics APAC Commercial Vehicle Market Revenue (Million) Forecast, by Application 2019 & 2032
- Table 28: Rest of Europe APAC Commercial Vehicle Market Revenue (Million) Forecast, by Application 2019 & 2032
- Table 29: Global APAC Commercial Vehicle Market Revenue Million Forecast, by Vehicle Type 2019 & 2032
- Table 30: Global APAC Commercial Vehicle Market Revenue Million Forecast, by Propulsion Type 2019 & 2032
- Table 31: Global APAC Commercial Vehicle Market Revenue Million Forecast, by Country 2019 & 2032
- Table 32: Turkey APAC Commercial Vehicle Market Revenue (Million) Forecast, by Application 2019 & 2032
- Table 33: Israel APAC Commercial Vehicle Market Revenue (Million) Forecast, by Application 2019 & 2032
- Table 34: GCC APAC Commercial Vehicle Market Revenue (Million) Forecast, by Application 2019 & 2032
- Table 35: North Africa APAC Commercial Vehicle Market Revenue (Million) Forecast, by Application 2019 & 2032
- Table 36: South Africa APAC Commercial Vehicle Market Revenue (Million) Forecast, by Application 2019 & 2032
- Table 37: Rest of Middle East & Africa APAC Commercial Vehicle Market Revenue (Million) Forecast, by Application 2019 & 2032
- Table 38: Global APAC Commercial Vehicle Market Revenue Million Forecast, by Vehicle Type 2019 & 2032
- Table 39: Global APAC Commercial Vehicle Market Revenue Million Forecast, by Propulsion Type 2019 & 2032
- Table 40: Global APAC Commercial Vehicle Market Revenue Million Forecast, by Country 2019 & 2032
- Table 41: China APAC Commercial Vehicle Market Revenue (Million) Forecast, by Application 2019 & 2032
- Table 42: India APAC Commercial Vehicle Market Revenue (Million) Forecast, by Application 2019 & 2032
- Table 43: Japan APAC Commercial Vehicle Market Revenue (Million) Forecast, by Application 2019 & 2032
- Table 44: South Korea APAC Commercial Vehicle Market Revenue (Million) Forecast, by Application 2019 & 2032
- Table 45: ASEAN APAC Commercial Vehicle Market Revenue (Million) Forecast, by Application 2019 & 2032
- Table 46: Oceania APAC Commercial Vehicle Market Revenue (Million) Forecast, by Application 2019 & 2032
- Table 47: Rest of Asia Pacific APAC Commercial Vehicle Market Revenue (Million) Forecast, by Application 2019 & 2032
Frequently Asked Questions
1. What is the projected Compound Annual Growth Rate (CAGR) of the APAC Commercial Vehicle Market?
The projected CAGR is approximately > 4.00%.
2. Which companies are prominent players in the APAC Commercial Vehicle Market?
Key companies in the market include Mazda Motor Corporation, Subaru Corporation, Wuling Motors Holdings Limite, Nissan Motor Co Ltd, Isuzu Motors Limited, General Motors Company, Anhui Ankai Automobile Co Ltd, Dongfeng Motor Corporation, Daihatsu Motor Co Ltd, Tata Motors Limited, Renault-Nissan-Mitsubishi Alliance, Hyundai Motor Company, Kia Corporation, Toyota Motor Corporation, Honda Motor Co Ltd, Great Wall Motor Company Ltd (GWM), Mitsubishi Motors Corporation, Suzuki Motor Corporation, Ford Motor Company.
3. What are the main segments of the APAC Commercial Vehicle Market?
The market segments include Vehicle Type, Propulsion Type.
4. Can you provide details about the market size?
The market size is estimated to be USD XX Million as of 2022.
5. What are some drivers contributing to market growth?
Surge in Trend of Yacht Tourism.
6. What are the notable trends driving market growth?
OTHER KEY INDUSTRY TRENDS COVERED IN THE REPORT.
7. Are there any restraints impacting market growth?
Higher Rentals During Peak Season.
8. Can you provide examples of recent developments in the market?
August 2023: General Motors will launch an all-electric Cadillac Escalade in late 2024August 2023: General Motors doubles down on plans for an electric future in the Middle East.August 2023: Toyota Kirloskar Motor launched the all-new MPV Vellfire strong hybrid electric vehicle (SHEV) for a starting price of INR 11.99 million and going to INR 12.99 million.
9. What pricing options are available for accessing the report?
Pricing options include single-user, multi-user, and enterprise licenses priced at USD 3800, USD 4500, and USD 5800 respectively.
10. Is the market size provided in terms of value or volume?
The market size is provided in terms of value, measured in Million.
11. Are there any specific market keywords associated with the report?
Yes, the market keyword associated with the report is "APAC Commercial Vehicle Market," which aids in identifying and referencing the specific market segment covered.
12. How do I determine which pricing option suits my needs best?
The pricing options vary based on user requirements and access needs. Individual users may opt for single-user licenses, while businesses requiring broader access may choose multi-user or enterprise licenses for cost-effective access to the report.
13. Are there any additional resources or data provided in the APAC Commercial Vehicle Market report?
While the report offers comprehensive insights, it's advisable to review the specific contents or supplementary materials provided to ascertain if additional resources or data are available.
14. How can I stay updated on further developments or reports in the APAC Commercial Vehicle Market?
To stay informed about further developments, trends, and reports in the APAC Commercial Vehicle Market, consider subscribing to industry newsletters, following relevant companies and organizations, or regularly checking reputable industry news sources and publications.
Methodology
Step 1 - Identification of Relevant Samples Size from Population Database


Step 2 - Approaches for Defining Global Market Size (Value, Volume* & Price*)

Note*: In applicable scenarios
Step 3 - Data Sources
Primary Research
- Web Analytics
- Survey Reports
- Research Institute
- Latest Research Reports
- Opinion Leaders
Secondary Research
- Annual Reports
- White Paper
- Latest Press Release
- Industry Association
- Paid Database
- Investor Presentations

Step 4 - Data Triangulation
Involves using different sources of information in order to increase the validity of a study
These sources are likely to be stakeholders in a program - participants, other researchers, program staff, other community members, and so on.
Then we put all data in single framework & apply various statistical tools to find out the dynamic on the market.
During the analysis stage, feedback from the stakeholder groups would be compared to determine areas of agreement as well as areas of divergence
