

Key Insights
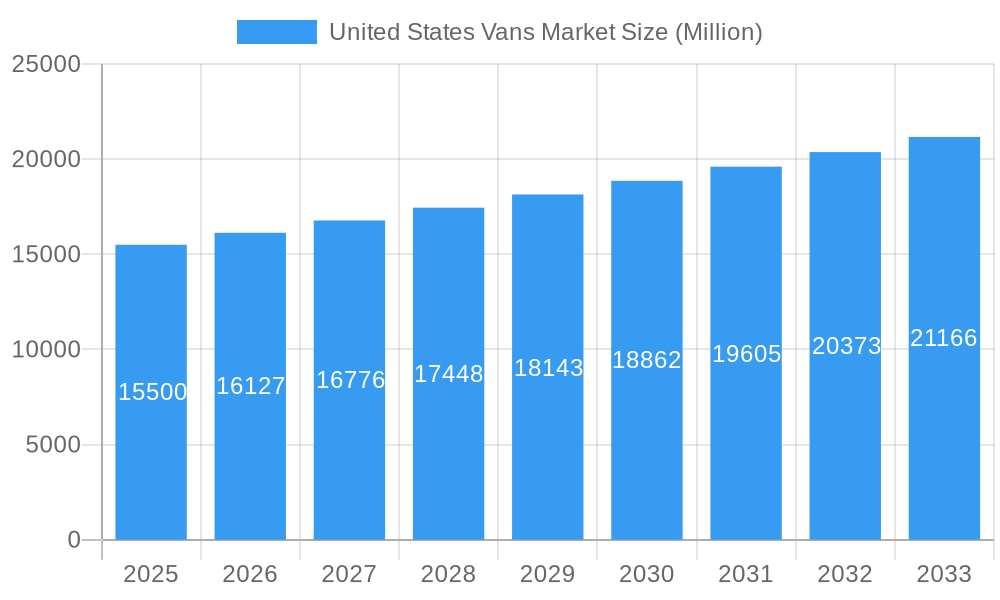
The United States vans market is poised for significant growth, projecting a Compound Annual Growth Rate (CAGR) of 5.73%. With a current market size of approximately 11.79 billion in the base year of 2025, the market demonstrates robust expansion potential. Key drivers fueling this growth include the surge in e-commerce demanding efficient last-mile delivery solutions, the increasing need for versatile commercial vehicles across sectors like construction and logistics, and a discernible shift towards more fuel-efficient hybrid and electric van alternatives. Emerging trends such as fleet electrification, the integration of Advanced Driver-Assistance Systems (ADAS), and the proliferation of connected vehicle technologies are actively shaping market dynamics. Despite these positive indicators, the market faces challenges including volatile fuel prices, persistent supply chain disruptions, and the ongoing semiconductor shortage. The market is segmented by propulsion, with a notable anticipated increase in the electric van segment, bolstered by government incentives and growing environmental consciousness. Leading manufacturers such as Ford, GM, Ram, and Nissan are engaged in intense competition, prioritizing innovation, a diverse product portfolio, and strong after-sales support to secure market share. The North American region, with the United States at its forefront, commands a dominant position owing to its extensive logistics infrastructure and a strong economic foundation.
United States Vans Market Market Size (In Billion)
The forecast period from 2025 to 2033 anticipates continued market expansion, propelled by sustained e-commerce growth, infrastructure investments, and the accelerating adoption of electric vans. The competitive environment will remain dynamic, characterized by substantial research and development investments aimed at enhancing vehicle performance, efficiency, and technological integration. Government policies encouraging cleaner transportation and stringent emission standards will also play a crucial role in shaping market trajectories. While obstacles persist, the long-term outlook for the US vans market remains optimistic, presenting considerable growth opportunities for both established and emerging players. A detailed analysis of regional trends within the US offers valuable granular insights for strategic planning, enabling a focus on high-growth areas and a keen understanding of local regulatory frameworks.
United States Vans Market Company Market Share
United States Vans Market: A Comprehensive Forecast & Analysis (2019-2033)
This comprehensive report delivers an in-depth analysis of the United States vans market, providing crucial insights for industry professionals, investors, and strategic decision-makers. Covering the period 2019-2033, with a base year of 2025 and a forecast period of 2025-2033, this report dissects market dynamics, growth trends, and key players, offering a granular view of this dynamic sector. The report segments the market by propulsion type (Gasoline, Hybrid and Electric Vehicles), providing a nuanced understanding of evolving consumer preferences and technological advancements. The market size is presented in million units.
United States Vans Market Market Dynamics & Structure
This section analyzes the competitive landscape, technological advancements, regulatory influences, and market trends within the US vans market. We explore market concentration, examining the market share held by key players and identifying any emerging trends in mergers and acquisitions (M&A). The analysis also addresses the impact of substitute products, end-user demographics, and the overall market structure.
- Market Concentration: The US vans market exhibits a (xx)% concentration ratio, with the top 5 players controlling approximately (xx)% of the market share in 2024. This indicates a (moderately concentrated/highly competitive/oligopolistic) market structure.
- Technological Innovation: The sector is experiencing rapid technological advancements, driven primarily by the increasing adoption of electric and hybrid vehicles, and the integration of advanced driver-assistance systems (ADAS). Innovation barriers include high R&D costs and the need for robust charging infrastructure.
- Regulatory Framework: Stringent emission regulations and safety standards play a significant role in shaping the market, influencing product development and adoption rates.
- Competitive Substitutes: The vans market faces competition from other transportation solutions, such as trucks and cargo delivery services. The competitive intensity is (high/moderate/low), influenced by factors such as price competition and service differentiation.
- End-User Demographics: The primary end-users are commercial fleets, businesses, and individual consumers. The changing needs of these user segments are driving market evolution.
- M&A Trends: In the past five years, there have been approximately xx M&A deals in the US vans market, indicating (high/moderate/low) levels of consolidation.
United States Vans Market Growth Trends & Insights
This section provides a detailed analysis of the US vans market's growth trajectory, leveraging historical data and forecasting models to project future market size and penetration rates. We analyze factors such as technological disruptions, shifting consumer preferences, and economic conditions influencing market growth.
The US vans market exhibited a CAGR of (xx)% during the historical period (2019-2024), reaching a market size of (xx) million units in 2024. This growth is anticipated to continue, with a projected CAGR of (xx)% during the forecast period (2025-2033), reaching (xx) million units by 2033. The increasing demand for last-mile delivery services, coupled with the rising popularity of electric vehicles, is a major driver. Market penetration rates for electric vans are expected to increase significantly, from (xx)% in 2024 to (xx)% by 2033. Changes in consumer behavior, such as a preference for eco-friendly vehicles and the adoption of subscription models, are also significantly impacting the market.
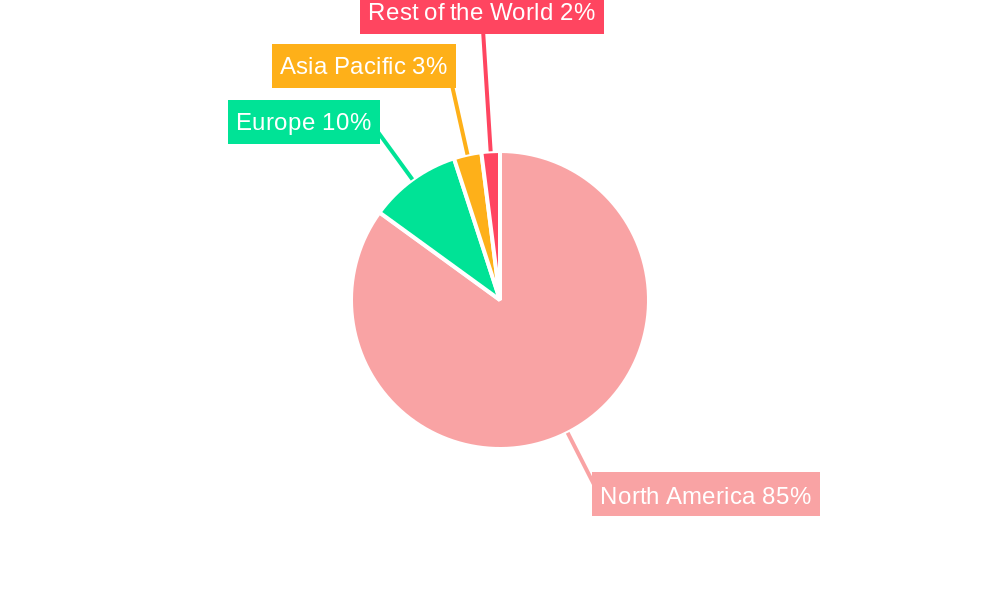
Dominant Regions, Countries, or Segments in United States Vans Market
This section identifies the leading regions, states, or market segments within the US vans market based on market share and growth potential. The analysis considers factors such as economic conditions, infrastructure development, and government policies.
The (California/Texas/Florida) region is currently the dominant market segment for vans in the US, driven by a large commercial fleet presence, robust infrastructure for logistics, and a strong economy. However, other regions are expected to experience significant growth in the coming years.
- Key Drivers:
- Strong economic growth in key regions
- Increased investment in logistics and transportation infrastructure
- Favorable government policies supporting the adoption of commercial vehicles
- Gasoline vs. Electric/Hybrid: While the gasoline segment currently dominates, significant growth is expected within the hybrid and electric vehicle segment, driven by environmental concerns and government incentives. This shift will likely reshape the regional dominance landscape over the forecast period.
United States Vans Market Product Landscape
The US vans market offers a diverse range of products, from traditional gasoline-powered vans to modern electric and hybrid options. Manufacturers are constantly innovating, incorporating advanced technologies such as ADAS, improved fuel efficiency features, and enhanced cargo capacity. Unique selling propositions (USPs) often center around fuel efficiency, safety features, and technological advancements such as telematics integration for fleet management.
Key Drivers, Barriers & Challenges in United States Vans Market
Key Drivers:
- Growth in e-commerce and last-mile delivery services
- Increased demand for efficient and sustainable transportation solutions
- Government incentives and regulations promoting electric vehicle adoption
Key Challenges:
- Supply chain disruptions impacting component availability and vehicle production. This is estimated to have impacted production by (xx)% in 2022.
- High initial costs associated with electric vans, hindering widespread adoption.
- Competition from established players and new entrants into the market.
Emerging Opportunities in United States Vans Market
Emerging opportunities exist in the areas of autonomous driving technology integration, specialized van applications (e.g., refrigerated vans, mobile repair units), and the development of innovative subscription models for fleet management. Untapped markets in rural areas and the expansion of charging infrastructure will also create significant opportunities.
Growth Accelerators in the United States Vans Market Industry
Technological breakthroughs in battery technology, advancements in autonomous driving capabilities, and strategic partnerships between manufacturers and technology companies are major catalysts for long-term growth. Expansion into new markets and the development of innovative financing options will also accelerate market expansion.
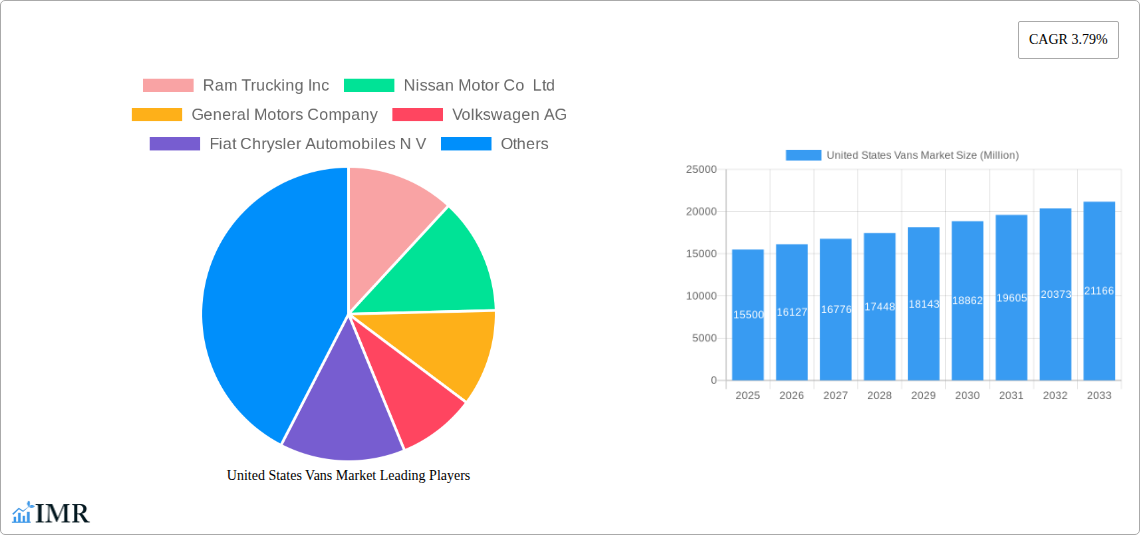
Key Players Shaping the United States Vans Market Market
- Ram Trucking Inc
- Nissan Motor Co Ltd
- General Motors Company
- Volkswagen AG
- Fiat Chrysler Automobiles N V
- Daimler AG (Mercedes-Benz AG)
- Workhorse Group Inc
- IVECO S p A
- GM Motor (Chevrolet)
- Ford Motor Company
Notable Milestones in United States Vans Market Sector
- June 2023: FORD NEXT launched a new pilot program offering flexible electric vehicle leasing options for Uber drivers in select US markets.
- June 2023: Stellantis secured a deal with Merchants Fleet for 12,500 Ram ProMaster EV units over the next several years.
- June 2023: Mercedes-Benz expanded the availability of its DRIVE PILOT Level 3 autonomous driving system to California.
In-Depth United States Vans Market Market Outlook
The US vans market is poised for significant growth in the coming years, driven by technological advancements, evolving consumer preferences, and supportive government policies. Strategic partnerships, innovative product development, and expansion into new market segments will be key factors in shaping the future of this dynamic sector. The continued integration of electric and autonomous technologies presents substantial opportunities for market expansion and increased efficiency.
United States Vans Market Segmentation
-
1. Propulsion Type
-
1.1. Hybrid and Electric Vehicles
-
1.1.1. By Fuel Category
- 1.1.1.1. BEV
- 1.1.1.2. HEV
-
1.1.1. By Fuel Category
-
1.2. ICE
- 1.2.1. Diesel
- 1.2.2. Gasoline
-
1.1. Hybrid and Electric Vehicles
United States Vans Market Segmentation By Geography
- 1. United States
United States Vans Market Regional Market Share
Geographic Coverage of United States Vans Market
United States Vans Market REPORT HIGHLIGHTS
| Aspects | Details |
|---|---|
| Study Period | 2020-2034 |
| Base Year | 2025 |
| Estimated Year | 2026 |
| Forecast Period | 2026-2034 |
| Historical Period | 2020-2025 |
| Growth Rate | CAGR of 5.73% from 2020-2034 |
| Segmentation |
|
Table of Contents
- 1. Introduction
- 1.1. Research Scope
- 1.2. Market Segmentation
- 1.3. Research Objective
- 1.4. Definitions and Assumptions
- 2. Executive Summary
- 2.1. Market Snapshot
- 3. Market Dynamics
- 3.1. Market Drivers
- 3.2. Market Restrains
- 3.3. Market Trends
- 3.4. Market Opportunities
- 4. Market Factor Analysis
- 4.1. Porters Five Forces
- 4.1.1. Bargaining Power of Suppliers
- 4.1.2. Bargaining Power of Buyers
- 4.1.3. Threat of New Entrants
- 4.1.4. Threat of Substitutes
- 4.1.5. Competitive Rivalry
- 4.2. PESTEL analysis
- 4.3. BCG Analysis
- 4.3.1. Stars (High Growth, High Market Share)
- 4.3.2. Cash Cows (Low Growth, High Market Share)
- 4.3.3. Question Mark (High Growth, Low Market Share)
- 4.3.4. Dogs (Low Growth, Low Market Share)
- 4.4. Ansoff Matrix Analysis
- 4.5. Supply Chain Analysis
- 4.6. Regulatory Landscape
- 4.7. Current Market Potential and Opportunity Assessment (TAM–SAM–SOM Framework)
- 4.8. IMR Analyst Note
- 4.1. Porters Five Forces
- 5. Market Analysis, Insights and Forecast 2021-2033
- 5.1. Market Analysis, Insights and Forecast - by Propulsion Type
- 5.1.1. Hybrid and Electric Vehicles
- 5.1.1.1. By Fuel Category
- 5.1.1.1.1. BEV
- 5.1.1.1.2. HEV
- 5.1.1.1. By Fuel Category
- 5.1.2. ICE
- 5.1.2.1. Diesel
- 5.1.2.2. Gasoline
- 5.1.1. Hybrid and Electric Vehicles
- 5.2. Market Analysis, Insights and Forecast - by Region
- 5.2.1. United States
- 5.1. Market Analysis, Insights and Forecast - by Propulsion Type
- 6. United States Vans Market Analysis, Insights and Forecast, 2021-2033
- 6.1. Market Analysis, Insights and Forecast - by Propulsion Type
- 6.1.1. Hybrid and Electric Vehicles
- 6.1.1.1. By Fuel Category
- 6.1.1.1.1. BEV
- 6.1.1.1.2. HEV
- 6.1.1.1. By Fuel Category
- 6.1.2. ICE
- 6.1.2.1. Diesel
- 6.1.2.2. Gasoline
- 6.1.1. Hybrid and Electric Vehicles
- 6.1. Market Analysis, Insights and Forecast - by Propulsion Type
- 7. Competitive Analysis
- 7.1. Company Profiles
- 7.1.1 Ram Trucking Inc
- 7.1.1.1. Company Overview
- 7.1.1.2. Products
- 7.1.1.3. Company Financials
- 7.1.1.4. SWOT Analysis
- 7.1.2 Nissan Motor Co Ltd
- 7.1.2.1. Company Overview
- 7.1.2.2. Products
- 7.1.2.3. Company Financials
- 7.1.2.4. SWOT Analysis
- 7.1.3 General Motors Company
- 7.1.3.1. Company Overview
- 7.1.3.2. Products
- 7.1.3.3. Company Financials
- 7.1.3.4. SWOT Analysis
- 7.1.4 Volkswagen AG
- 7.1.4.1. Company Overview
- 7.1.4.2. Products
- 7.1.4.3. Company Financials
- 7.1.4.4. SWOT Analysis
- 7.1.5 Fiat Chrysler Automobiles N V
- 7.1.5.1. Company Overview
- 7.1.5.2. Products
- 7.1.5.3. Company Financials
- 7.1.5.4. SWOT Analysis
- 7.1.6 Daimler AG (Mercedes-Benz AG)
- 7.1.6.1. Company Overview
- 7.1.6.2. Products
- 7.1.6.3. Company Financials
- 7.1.6.4. SWOT Analysis
- 7.1.7 Workhorse Group Inc
- 7.1.7.1. Company Overview
- 7.1.7.2. Products
- 7.1.7.3. Company Financials
- 7.1.7.4. SWOT Analysis
- 7.1.8 IVECO S p A
- 7.1.8.1. Company Overview
- 7.1.8.2. Products
- 7.1.8.3. Company Financials
- 7.1.8.4. SWOT Analysis
- 7.1.9 GM Motor (Chevrolet)
- 7.1.9.1. Company Overview
- 7.1.9.2. Products
- 7.1.9.3. Company Financials
- 7.1.9.4. SWOT Analysis
- 7.1.10 Ford Motor Company
- 7.1.10.1. Company Overview
- 7.1.10.2. Products
- 7.1.10.3. Company Financials
- 7.1.10.4. SWOT Analysis
- 7.1.1 Ram Trucking Inc
- 7.2. Market Entropy
- 7.2.1 Company's Key Areas Served
- 7.2.2 Recent Developments
- 7.3. Company Market Share Analysis 2025
- 7.3.1 Top 5 Companies Market Share Analysis
- 7.3.2 Top 3 Companies Market Share Analysis
- 7.4. List of Potential Customers
- 8. Research Methodology
List of Figures
- Figure 1: United States Vans Market Revenue Breakdown (billion, %) by Product 2025 & 2033
- Figure 2: United States Vans Market Share (%) by Company 2025
List of Tables
- Table 1: United States Vans Market Revenue billion Forecast, by Propulsion Type 2020 & 2033
- Table 2: United States Vans Market Revenue billion Forecast, by Region 2020 & 2033
- Table 3: United States Vans Market Revenue billion Forecast, by Propulsion Type 2020 & 2033
- Table 4: United States Vans Market Revenue billion Forecast, by Country 2020 & 2033
Frequently Asked Questions
1. What is the projected Compound Annual Growth Rate (CAGR) of the United States Vans Market?
The projected CAGR is approximately 5.73%.
2. Which companies are prominent players in the United States Vans Market?
Key companies in the market include Ram Trucking Inc, Nissan Motor Co Ltd, General Motors Company, Volkswagen AG, Fiat Chrysler Automobiles N V, Daimler AG (Mercedes-Benz AG), Workhorse Group Inc, IVECO S p A, GM Motor (Chevrolet), Ford Motor Company.
3. What are the main segments of the United States Vans Market?
The market segments include Propulsion Type.
4. Can you provide details about the market size?
The market size is estimated to be USD 11.79 billion as of 2022.
5. What are some drivers contributing to market growth?
Rising Demand for Small Boats; Expanding Recreational Boating Opportunities.
6. What are the notable trends driving market growth?
OTHER KEY INDUSTRY TRENDS COVERED IN THE REPORT.
7. Are there any restraints impacting market growth?
Strict Emission Norms for Recreation Boats Likely to Have Negative Impact.
8. Can you provide examples of recent developments in the market?
June 2023: FORD NEXT launches New pilot program creates flexible electric solutions for drivers who use the Uber platform in select U.S. markets, allowing them to lease a vehicle for more customized time periods.June 2023: Stellantis adds Merchants Fleet as latest Ram ProMaster EV commercial customer and that agreement calls for 12,500 Ram ProMaster EV units over the next several years.June 2023: Mercedes-Benz DRIVE PILOT expands U.S. availability to California and introduce a SAE Level 3 system in a standard-production vehicle for use on public freeways in the most populous state in the U.S.
9. What pricing options are available for accessing the report?
Pricing options include single-user, multi-user, and enterprise licenses priced at USD 3800, USD 4500, and USD 5800 respectively.
10. Is the market size provided in terms of value or volume?
The market size is provided in terms of value, measured in billion.
11. Are there any specific market keywords associated with the report?
Yes, the market keyword associated with the report is "United States Vans Market," which aids in identifying and referencing the specific market segment covered.
12. How do I determine which pricing option suits my needs best?
The pricing options vary based on user requirements and access needs. Individual users may opt for single-user licenses, while businesses requiring broader access may choose multi-user or enterprise licenses for cost-effective access to the report.
13. Are there any additional resources or data provided in the United States Vans Market report?
While the report offers comprehensive insights, it's advisable to review the specific contents or supplementary materials provided to ascertain if additional resources or data are available.
14. How can I stay updated on further developments or reports in the United States Vans Market?
To stay informed about further developments, trends, and reports in the United States Vans Market, consider subscribing to industry newsletters, following relevant companies and organizations, or regularly checking reputable industry news sources and publications.
Methodology
Step 1 - Identification of Relevant Samples Size from Population Database


Step 2 - Approaches for Defining Global Market Size (Value, Volume* & Price*)

Note*: In applicable scenarios
Step 3 - Data Sources
Primary Research
- Web Analytics
- Survey Reports
- Research Institute
- Latest Research Reports
- Opinion Leaders
Secondary Research
- Annual Reports
- White Paper
- Latest Press Release
- Industry Association
- Paid Database
- Investor Presentations

Step 4 - Data Triangulation
Involves using different sources of information in order to increase the validity of a study
These sources are likely to be stakeholders in a program - participants, other researchers, program staff, other community members, and so on.
Then we put all data in single framework & apply various statistical tools to find out the dynamic on the market.
During the analysis stage, feedback from the stakeholder groups would be compared to determine areas of agreement as well as areas of divergence