

Key Insights
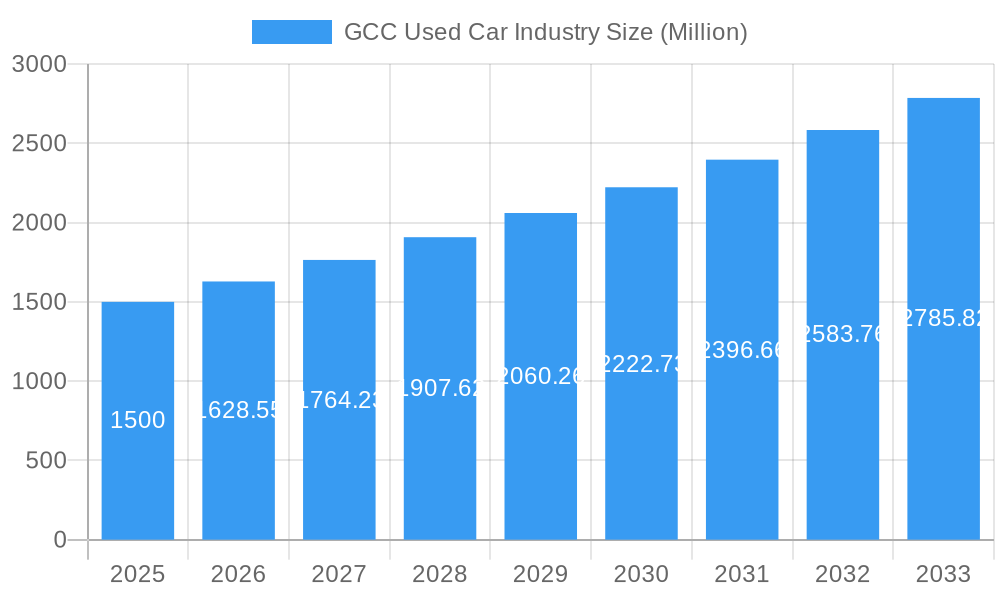
The GCC used car market, valued at approximately $XX million in 2025, is experiencing robust growth, projected to maintain a compound annual growth rate (CAGR) of 8.58% from 2025 to 2033. This expansion is fueled by several key factors. Increasing vehicle ownership in the region, coupled with a preference for more affordable used vehicles over new cars, particularly among younger demographics, significantly boosts market demand. The rise of online marketplaces like Yalla Motors and Dubizzle Motors LLC, offering enhanced convenience and transparency, streamlines the buying process and attracts a wider customer base. Furthermore, a growing number of organized dealerships alongside established players like Abdul Latif Jameel Motors and Al-Futtaim Group are improving market infrastructure and consumer trust, contributing to the market's positive trajectory. The segment breakdown reveals a dynamic landscape with SUVs and MUVs driving substantial growth due to their popularity among families. Online sales channels are also gaining momentum, reflecting a broader shift towards digital commerce. However, challenges such as fluctuating fuel prices, stringent vehicle inspection regulations, and the potential impact of economic volatility on consumer spending pose some restraints to overall growth. The market's segmentation across vendor type (organized vs. unorganized), vehicle type (hatchback, sedan, SUV, MUV), and sales channel (online vs. offline) presents opportunities for targeted market penetration and strategic expansion. Future growth will be heavily reliant on adapting to evolving consumer preferences, leveraging technological advancements, and navigating regulatory changes effectively.
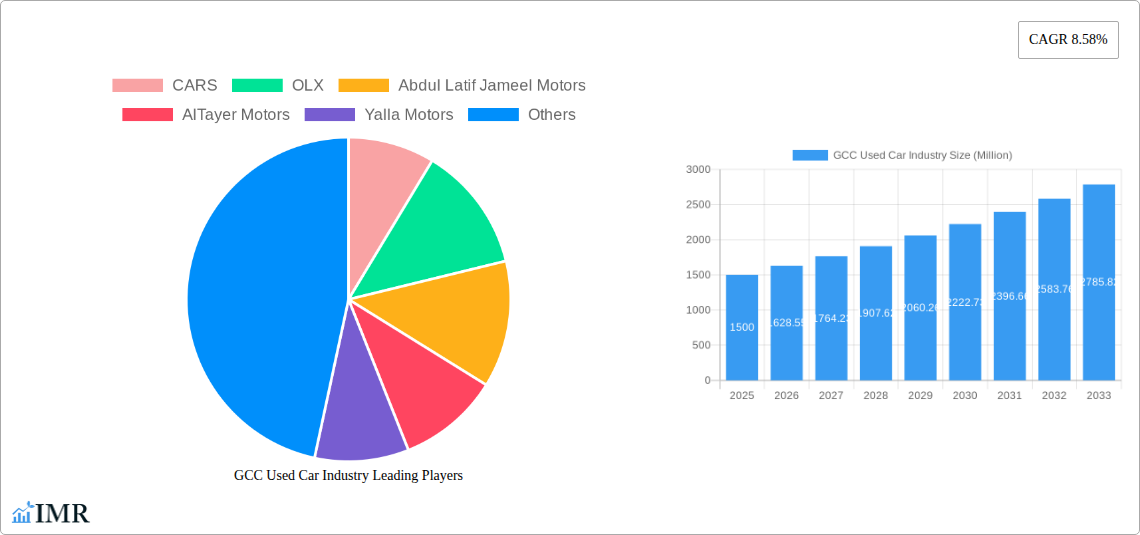
GCC Used Car Industry Market Size (In Billion)
The competitive landscape features both established automotive groups and online platforms vying for market share. Companies like CARS, OLX, and Al Nabooda Automobiles LLC are strategically positioned to capitalize on the continued growth. Geographic distribution across the GCC indicates a strong performance in the UAE and Saudi Arabia, with potential for further expansion into other nations within the region. Analyzing market trends, particularly consumer behaviour and technological integration within the automotive sector, is crucial for stakeholders seeking to maximize their return on investment in this dynamic and promising market. Differentiation through superior customer service, innovative financing options, and a commitment to transparent pricing will play a pivotal role in determining market leadership in the years to come.
GCC Used Car Industry Company Market Share
GCC Used Car Industry: A Comprehensive Market Report (2019-2033)
This in-depth report provides a comprehensive analysis of the GCC used car industry, covering market dynamics, growth trends, key players, and future outlook. The study period spans from 2019 to 2033, with 2025 serving as the base and estimated year. The report leverages extensive data analysis and industry expertise to offer actionable insights for businesses and investors. We analyze the parent market of the automotive industry and its child market, the used car sector, within the GCC region.
GCC Used Car Industry Market Dynamics & Structure
This section analyzes the GCC used car market's structure, detailing market concentration, technological advancements, regulatory environments, competitive landscape, consumer demographics, and merger & acquisition (M&A) activity. The market is segmented by vendor type (organized vs. unorganized), vehicle type (hatchback, sedan, SUV, MUV), and sales channel (online vs. offline).
- Market Concentration: The GCC used car market exhibits a moderately concentrated structure, with a few large players holding significant market share. The organized sector is increasingly consolidating, while the unorganized sector remains fragmented. Organized players hold an estimated xx% market share in 2025, projected to increase to xx% by 2033.
- Technological Innovation: Online platforms and digital tools are transforming the used car market, improving transparency and efficiency. However, adoption varies across the region, with some areas lagging behind in digitalization. Innovation barriers include the lack of standardized vehicle history reports and trust issues among buyers.
- Regulatory Framework: Government regulations regarding vehicle inspections, emissions, and licensing vary across GCC countries, impacting market operations. Changes in these regulations can significantly impact industry growth.
- Competitive Product Substitutes: The main substitutes are new cars, especially with attractive financing options and increasing affordability. This competition significantly affects used car pricing and sales volume.
- End-User Demographics: The primary demographic for used cars is young professionals and families seeking cost-effective transportation options. Changing demographics and income levels influence market demand.
- M&A Trends: The organized sector has witnessed several M&A activities in recent years, driven by the need for consolidation and expansion. The number of M&A deals is estimated to average xx per year during the forecast period.
The overall market size in 2025 is estimated at xx Million units.
GCC Used Car Industry Growth Trends & Insights
This section examines the historical and projected growth of the GCC used car market. We analyze factors driving market expansion, including increasing vehicle ownership, changing consumer preferences, and the impact of technological disruptions. The analysis incorporates key metrics such as CAGR (Compound Annual Growth Rate) and market penetration rate.
The GCC used car market experienced significant growth during the historical period (2019-2024), with an estimated CAGR of xx%. Factors such as rising disposable income, increasing urbanization, and a preference for personal mobility contributed to this growth. The market is expected to continue its expansion during the forecast period (2025-2033), driven by the increasing popularity of online sales channels, the rising demand for used SUVs and MUVs, and favorable government policies in some GCC countries. The CAGR for the forecast period is projected at xx%. Market penetration is estimated at xx% in 2025, projected to reach xx% by 2033. Technological disruptions, including the rise of online marketplaces and innovative financing options, are accelerating growth. Shifting consumer behavior, with a preference for convenience and transparency, further fuels this expansion. The total market size is expected to reach xx Million units by 2033.
Dominant Regions, Countries, or Segments in GCC Used Car Industry
This section identifies the leading regions, countries, and segments within the GCC used car market. The analysis focuses on factors contributing to their dominance, including market size, growth potential, economic policies, and infrastructure development.
- Vendor Type: The organized sector is expected to experience faster growth due to its ability to leverage technology and provide better consumer services.
- Vehicle Type: SUVs and MUVs are gaining popularity, driving strong growth in this segment.
- Sales Channel: Online sales channels are rapidly expanding, offering convenience and reach to a wider customer base. Offline channels, however, still dominate overall sales.
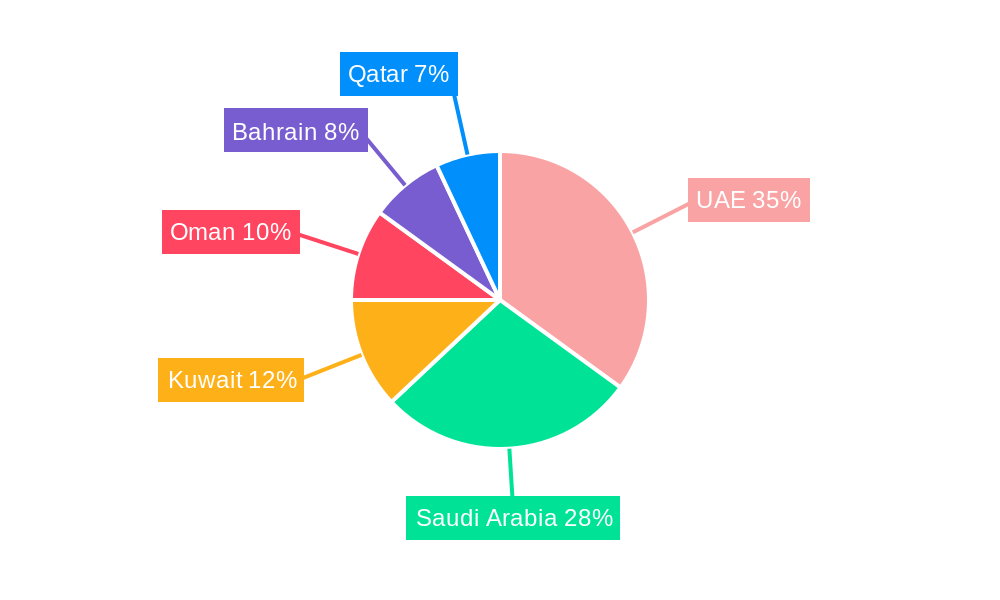
- Country Dominance: The UAE and Saudi Arabia are the largest markets in the GCC, accounting for a significant share of total sales. This is driven by higher vehicle ownership rates and robust economic activity in these countries.
The UAE holds the largest market share due to its robust infrastructure and a large expatriate population. Saudi Arabia is a close second, driven by its expanding economy and growing middle class.
GCC Used Car Industry Product Landscape
The GCC used car market offers a diverse range of vehicles, catering to varied consumer preferences and budgets. Technological advancements, such as vehicle history reports and online valuation tools, are enhancing transparency and building consumer trust. Key innovations include the integration of online marketplaces with financing options and warranty programs, aiming to improve the overall customer experience. The increasing availability of certified pre-owned vehicles is also shaping the market.
Key Drivers, Barriers & Challenges in GCC Used Car Industry
Key Drivers:
- Rising disposable incomes: Improved economic conditions are increasing affordability of used cars.
- Growing urbanization: Increased population density boosts demand for personal transport.
- Technological advancements: Online marketplaces and digital tools improve accessibility and transparency.
- Favorable government policies (in select countries): Incentives and regulations facilitate the used car market’s growth.
Key Challenges & Restraints:
- Lack of standardized vehicle history reports: This creates uncertainty and trust issues.
- Regulatory hurdles: Variations in vehicle inspection and licensing procedures across GCC countries.
- Supply chain disruptions: Geopolitical events and global economic conditions can affect used car availability and pricing. These disruptions, for example, saw a xx% increase in prices in 2022.
- Competition from new car financing options: Attractive deals on new cars put pressure on used car pricing.
Emerging Opportunities in GCC Used Car Industry
- Growth of the online used car market: Expansion into less-penetrated regions and the integration of innovative financing options are key opportunities.
- Specialized used car marketplaces: Focusing on specific vehicle types (e.g., luxury cars, electric vehicles) presents niche opportunities.
- Value-added services: Offering extended warranties, maintenance packages, and other services can increase customer loyalty and revenue.
Growth Accelerators in the GCC Used Car Industry
Long-term growth will be driven by technological advancements, especially AI-powered valuation tools and online platforms. Strategic partnerships between online marketplaces and financing companies will streamline the purchasing process. Expansion into untapped markets, particularly in smaller GCC countries, will fuel further growth.
Notable Milestones in GCC Used Car Industry Sector
- 2020-Q4: Launch of a major online used car marketplace in Saudi Arabia.
- 2022-Q1: Introduction of stricter vehicle inspection standards in the UAE.
- 2023-Q2: A significant M&A deal between two major used car dealerships in the UAE.
In-Depth GCC Used Car Industry Market Outlook
The GCC used car market presents considerable growth potential, driven by sustained economic growth and evolving consumer preferences. Strategic investments in technology, expansion into untapped markets, and the development of innovative financing options will be critical for long-term success. The market's future growth hinges on addressing current challenges, such as standardization of vehicle history reports and streamlining regulatory frameworks. A focus on enhancing the overall customer experience, including better transparency and convenience, will play a key role in attracting and retaining customers. The anticipated market size by 2033 represents a significant opportunity for businesses to capitalize on.
GCC Used Car Industry Segmentation
-
1. Vehicle Type
- 1.1. Hatchback
- 1.2. Sedan
- 1.3. SUV and MUV
-
2. Sales Channel
- 2.1. Online
- 2.2. Offline
-
3. Vendor Type
- 3.1. Organized
- 3.2. Unorganized
GCC Used Car Industry Segmentation By Geography
-
1. North America
- 1.1. United States
- 1.2. Canada
- 1.3. Mexico
-
2. South America
- 2.1. Brazil
- 2.2. Argentina
- 2.3. Rest of South America
-
3. Europe
- 3.1. United Kingdom
- 3.2. Germany
- 3.3. France
- 3.4. Italy
- 3.5. Spain
- 3.6. Russia
- 3.7. Benelux
- 3.8. Nordics
- 3.9. Rest of Europe
-
4. Middle East & Africa
- 4.1. Turkey
- 4.2. Israel
- 4.3. GCC
- 4.4. North Africa
- 4.5. South Africa
- 4.6. Rest of Middle East & Africa
-
5. Asia Pacific
- 5.1. China
- 5.2. India
- 5.3. Japan
- 5.4. South Korea
- 5.5. ASEAN
- 5.6. Oceania
- 5.7. Rest of Asia Pacific
GCC Used Car Industry Regional Market Share
Geographic Coverage of GCC Used Car Industry
GCC Used Car Industry REPORT HIGHLIGHTS
| Aspects | Details |
|---|---|
| Study Period | 2020-2034 |
| Base Year | 2025 |
| Estimated Year | 2026 |
| Forecast Period | 2026-2034 |
| Historical Period | 2020-2025 |
| Growth Rate | CAGR of 8.05% from 2020-2034 |
| Segmentation |
|
Table of Contents
- 1. Introduction
- 1.1. Research Scope
- 1.2. Market Segmentation
- 1.3. Research Objective
- 1.4. Definitions and Assumptions
- 2. Executive Summary
- 2.1. Market Snapshot
- 3. Market Dynamics
- 3.1. Market Drivers
- 3.2. Market Restrains
- 3.3. Market Trends
- 3.4. Market Opportunities
- 4. Market Factor Analysis
- 4.1. Porters Five Forces
- 4.1.1. Bargaining Power of Suppliers
- 4.1.2. Bargaining Power of Buyers
- 4.1.3. Threat of New Entrants
- 4.1.4. Threat of Substitutes
- 4.1.5. Competitive Rivalry
- 4.2. PESTEL analysis
- 4.3. BCG Analysis
- 4.3.1. Stars (High Growth, High Market Share)
- 4.3.2. Cash Cows (Low Growth, High Market Share)
- 4.3.3. Question Mark (High Growth, Low Market Share)
- 4.3.4. Dogs (Low Growth, Low Market Share)
- 4.4. Ansoff Matrix Analysis
- 4.5. Supply Chain Analysis
- 4.6. Regulatory Landscape
- 4.7. Current Market Potential and Opportunity Assessment (TAM–SAM–SOM Framework)
- 4.8. IMR Analyst Note
- 4.1. Porters Five Forces
- 5. Market Analysis, Insights and Forecast 2021-2033
- 5.1. Market Analysis, Insights and Forecast - by Vehicle Type
- 5.1.1. Hatchback
- 5.1.2. Sedan
- 5.1.3. SUV and MUV
- 5.2. Market Analysis, Insights and Forecast - by Sales Channel
- 5.2.1. Online
- 5.2.2. Offline
- 5.3. Market Analysis, Insights and Forecast - by Vendor Type
- 5.3.1. Organized
- 5.3.2. Unorganized
- 5.4. Market Analysis, Insights and Forecast - by Region
- 5.4.1. North America
- 5.4.2. South America
- 5.4.3. Europe
- 5.4.4. Middle East & Africa
- 5.4.5. Asia Pacific
- 5.1. Market Analysis, Insights and Forecast - by Vehicle Type
- 6. Global GCC Used Car Industry Analysis, Insights and Forecast, 2021-2033
- 6.1. Market Analysis, Insights and Forecast - by Vehicle Type
- 6.1.1. Hatchback
- 6.1.2. Sedan
- 6.1.3. SUV and MUV
- 6.2. Market Analysis, Insights and Forecast - by Sales Channel
- 6.2.1. Online
- 6.2.2. Offline
- 6.3. Market Analysis, Insights and Forecast - by Vendor Type
- 6.3.1. Organized
- 6.3.2. Unorganized
- 6.1. Market Analysis, Insights and Forecast - by Vehicle Type
- 7. North America GCC Used Car Industry Analysis, Insights and Forecast, 2020-2032
- 7.1. Market Analysis, Insights and Forecast - by Vehicle Type
- 7.1.1. Hatchback
- 7.1.2. Sedan
- 7.1.3. SUV and MUV
- 7.2. Market Analysis, Insights and Forecast - by Sales Channel
- 7.2.1. Online
- 7.2.2. Offline
- 7.3. Market Analysis, Insights and Forecast - by Vendor Type
- 7.3.1. Organized
- 7.3.2. Unorganized
- 7.1. Market Analysis, Insights and Forecast - by Vehicle Type
- 8. South America GCC Used Car Industry Analysis, Insights and Forecast, 2020-2032
- 8.1. Market Analysis, Insights and Forecast - by Vehicle Type
- 8.1.1. Hatchback
- 8.1.2. Sedan
- 8.1.3. SUV and MUV
- 8.2. Market Analysis, Insights and Forecast - by Sales Channel
- 8.2.1. Online
- 8.2.2. Offline
- 8.3. Market Analysis, Insights and Forecast - by Vendor Type
- 8.3.1. Organized
- 8.3.2. Unorganized
- 8.1. Market Analysis, Insights and Forecast - by Vehicle Type
- 9. Europe GCC Used Car Industry Analysis, Insights and Forecast, 2020-2032
- 9.1. Market Analysis, Insights and Forecast - by Vehicle Type
- 9.1.1. Hatchback
- 9.1.2. Sedan
- 9.1.3. SUV and MUV
- 9.2. Market Analysis, Insights and Forecast - by Sales Channel
- 9.2.1. Online
- 9.2.2. Offline
- 9.3. Market Analysis, Insights and Forecast - by Vendor Type
- 9.3.1. Organized
- 9.3.2. Unorganized
- 9.1. Market Analysis, Insights and Forecast - by Vehicle Type
- 10. Middle East & Africa GCC Used Car Industry Analysis, Insights and Forecast, 2020-2032
- 10.1. Market Analysis, Insights and Forecast - by Vehicle Type
- 10.1.1. Hatchback
- 10.1.2. Sedan
- 10.1.3. SUV and MUV
- 10.2. Market Analysis, Insights and Forecast - by Sales Channel
- 10.2.1. Online
- 10.2.2. Offline
- 10.3. Market Analysis, Insights and Forecast - by Vendor Type
- 10.3.1. Organized
- 10.3.2. Unorganized
- 10.1. Market Analysis, Insights and Forecast - by Vehicle Type
- 11. Asia Pacific GCC Used Car Industry Analysis, Insights and Forecast, 2020-2032
- 11.1. Market Analysis, Insights and Forecast - by Vehicle Type
- 11.1.1. Hatchback
- 11.1.2. Sedan
- 11.1.3. SUV and MUV
- 11.2. Market Analysis, Insights and Forecast - by Sales Channel
- 11.2.1. Online
- 11.2.2. Offline
- 11.3. Market Analysis, Insights and Forecast - by Vendor Type
- 11.3.1. Organized
- 11.3.2. Unorganized
- 11.1. Market Analysis, Insights and Forecast - by Vehicle Type
- 12. Competitive Analysis
- 12.1. Company Profiles
- 12.1.1 CARS
- 12.1.1.1. Company Overview
- 12.1.1.2. Products
- 12.1.1.3. Company Financials
- 12.1.1.4. SWOT Analysis
- 12.1.2 OLX
- 12.1.2.1. Company Overview
- 12.1.2.2. Products
- 12.1.2.3. Company Financials
- 12.1.2.4. SWOT Analysis
- 12.1.3 Abdul Latif Jameel Motors
- 12.1.3.1. Company Overview
- 12.1.3.2. Products
- 12.1.3.3. Company Financials
- 12.1.3.4. SWOT Analysis
- 12.1.4 AlTayer Motors
- 12.1.4.1. Company Overview
- 12.1.4.2. Products
- 12.1.4.3. Company Financials
- 12.1.4.4. SWOT Analysis
- 12.1.5 Yalla Motors
- 12.1.5.1. Company Overview
- 12.1.5.2. Products
- 12.1.5.3. Company Financials
- 12.1.5.4. SWOT Analysis
- 12.1.6 Dubizzle Motors LLC
- 12.1.6.1. Company Overview
- 12.1.6.2. Products
- 12.1.6.3. Company Financials
- 12.1.6.4. SWOT Analysis
- 12.1.7 Al-Futtaim Group
- 12.1.7.1. Company Overview
- 12.1.7.2. Products
- 12.1.7.3. Company Financials
- 12.1.7.4. SWOT Analysis
- 12.1.8 Arabian Auto Agency*List Not Exhaustive
- 12.1.8.1. Company Overview
- 12.1.8.2. Products
- 12.1.8.3. Company Financials
- 12.1.8.4. SWOT Analysis
- 12.1.9 Al Nabooda Automobiles LLC
- 12.1.9.1. Company Overview
- 12.1.9.2. Products
- 12.1.9.3. Company Financials
- 12.1.9.4. SWOT Analysis
- 12.1.1 CARS
- 12.2. Market Entropy
- 12.2.1 Company's Key Areas Served
- 12.2.2 Recent Developments
- 12.3. Company Market Share Analysis 2025
- 12.3.1 Top 5 Companies Market Share Analysis
- 12.3.2 Top 3 Companies Market Share Analysis
- 12.4. List of Potential Customers
- 13. Research Methodology
List of Figures
- Figure 1: Global GCC Used Car Industry Revenue Breakdown (billion, %) by Region 2025 & 2033
- Figure 2: North America GCC Used Car Industry Revenue (billion), by Vehicle Type 2025 & 2033
- Figure 3: North America GCC Used Car Industry Revenue Share (%), by Vehicle Type 2025 & 2033
- Figure 4: North America GCC Used Car Industry Revenue (billion), by Sales Channel 2025 & 2033
- Figure 5: North America GCC Used Car Industry Revenue Share (%), by Sales Channel 2025 & 2033
- Figure 6: North America GCC Used Car Industry Revenue (billion), by Vendor Type 2025 & 2033
- Figure 7: North America GCC Used Car Industry Revenue Share (%), by Vendor Type 2025 & 2033
- Figure 8: North America GCC Used Car Industry Revenue (billion), by Country 2025 & 2033
- Figure 9: North America GCC Used Car Industry Revenue Share (%), by Country 2025 & 2033
- Figure 10: South America GCC Used Car Industry Revenue (billion), by Vehicle Type 2025 & 2033
- Figure 11: South America GCC Used Car Industry Revenue Share (%), by Vehicle Type 2025 & 2033
- Figure 12: South America GCC Used Car Industry Revenue (billion), by Sales Channel 2025 & 2033
- Figure 13: South America GCC Used Car Industry Revenue Share (%), by Sales Channel 2025 & 2033
- Figure 14: South America GCC Used Car Industry Revenue (billion), by Vendor Type 2025 & 2033
- Figure 15: South America GCC Used Car Industry Revenue Share (%), by Vendor Type 2025 & 2033
- Figure 16: South America GCC Used Car Industry Revenue (billion), by Country 2025 & 2033
- Figure 17: South America GCC Used Car Industry Revenue Share (%), by Country 2025 & 2033
- Figure 18: Europe GCC Used Car Industry Revenue (billion), by Vehicle Type 2025 & 2033
- Figure 19: Europe GCC Used Car Industry Revenue Share (%), by Vehicle Type 2025 & 2033
- Figure 20: Europe GCC Used Car Industry Revenue (billion), by Sales Channel 2025 & 2033
- Figure 21: Europe GCC Used Car Industry Revenue Share (%), by Sales Channel 2025 & 2033
- Figure 22: Europe GCC Used Car Industry Revenue (billion), by Vendor Type 2025 & 2033
- Figure 23: Europe GCC Used Car Industry Revenue Share (%), by Vendor Type 2025 & 2033
- Figure 24: Europe GCC Used Car Industry Revenue (billion), by Country 2025 & 2033
- Figure 25: Europe GCC Used Car Industry Revenue Share (%), by Country 2025 & 2033
- Figure 26: Middle East & Africa GCC Used Car Industry Revenue (billion), by Vehicle Type 2025 & 2033
- Figure 27: Middle East & Africa GCC Used Car Industry Revenue Share (%), by Vehicle Type 2025 & 2033
- Figure 28: Middle East & Africa GCC Used Car Industry Revenue (billion), by Sales Channel 2025 & 2033
- Figure 29: Middle East & Africa GCC Used Car Industry Revenue Share (%), by Sales Channel 2025 & 2033
- Figure 30: Middle East & Africa GCC Used Car Industry Revenue (billion), by Vendor Type 2025 & 2033
- Figure 31: Middle East & Africa GCC Used Car Industry Revenue Share (%), by Vendor Type 2025 & 2033
- Figure 32: Middle East & Africa GCC Used Car Industry Revenue (billion), by Country 2025 & 2033
- Figure 33: Middle East & Africa GCC Used Car Industry Revenue Share (%), by Country 2025 & 2033
- Figure 34: Asia Pacific GCC Used Car Industry Revenue (billion), by Vehicle Type 2025 & 2033
- Figure 35: Asia Pacific GCC Used Car Industry Revenue Share (%), by Vehicle Type 2025 & 2033
- Figure 36: Asia Pacific GCC Used Car Industry Revenue (billion), by Sales Channel 2025 & 2033
- Figure 37: Asia Pacific GCC Used Car Industry Revenue Share (%), by Sales Channel 2025 & 2033
- Figure 38: Asia Pacific GCC Used Car Industry Revenue (billion), by Vendor Type 2025 & 2033
- Figure 39: Asia Pacific GCC Used Car Industry Revenue Share (%), by Vendor Type 2025 & 2033
- Figure 40: Asia Pacific GCC Used Car Industry Revenue (billion), by Country 2025 & 2033
- Figure 41: Asia Pacific GCC Used Car Industry Revenue Share (%), by Country 2025 & 2033
List of Tables
- Table 1: Global GCC Used Car Industry Revenue billion Forecast, by Vehicle Type 2020 & 2033
- Table 2: Global GCC Used Car Industry Revenue billion Forecast, by Sales Channel 2020 & 2033
- Table 3: Global GCC Used Car Industry Revenue billion Forecast, by Vendor Type 2020 & 2033
- Table 4: Global GCC Used Car Industry Revenue billion Forecast, by Region 2020 & 2033
- Table 5: Global GCC Used Car Industry Revenue billion Forecast, by Vehicle Type 2020 & 2033
- Table 6: Global GCC Used Car Industry Revenue billion Forecast, by Sales Channel 2020 & 2033
- Table 7: Global GCC Used Car Industry Revenue billion Forecast, by Vendor Type 2020 & 2033
- Table 8: Global GCC Used Car Industry Revenue billion Forecast, by Country 2020 & 2033
- Table 9: United States GCC Used Car Industry Revenue (billion) Forecast, by Application 2020 & 2033
- Table 10: Canada GCC Used Car Industry Revenue (billion) Forecast, by Application 2020 & 2033
- Table 11: Mexico GCC Used Car Industry Revenue (billion) Forecast, by Application 2020 & 2033
- Table 12: Global GCC Used Car Industry Revenue billion Forecast, by Vehicle Type 2020 & 2033
- Table 13: Global GCC Used Car Industry Revenue billion Forecast, by Sales Channel 2020 & 2033
- Table 14: Global GCC Used Car Industry Revenue billion Forecast, by Vendor Type 2020 & 2033
- Table 15: Global GCC Used Car Industry Revenue billion Forecast, by Country 2020 & 2033
- Table 16: Brazil GCC Used Car Industry Revenue (billion) Forecast, by Application 2020 & 2033
- Table 17: Argentina GCC Used Car Industry Revenue (billion) Forecast, by Application 2020 & 2033
- Table 18: Rest of South America GCC Used Car Industry Revenue (billion) Forecast, by Application 2020 & 2033
- Table 19: Global GCC Used Car Industry Revenue billion Forecast, by Vehicle Type 2020 & 2033
- Table 20: Global GCC Used Car Industry Revenue billion Forecast, by Sales Channel 2020 & 2033
- Table 21: Global GCC Used Car Industry Revenue billion Forecast, by Vendor Type 2020 & 2033
- Table 22: Global GCC Used Car Industry Revenue billion Forecast, by Country 2020 & 2033
- Table 23: United Kingdom GCC Used Car Industry Revenue (billion) Forecast, by Application 2020 & 2033
- Table 24: Germany GCC Used Car Industry Revenue (billion) Forecast, by Application 2020 & 2033
- Table 25: France GCC Used Car Industry Revenue (billion) Forecast, by Application 2020 & 2033
- Table 26: Italy GCC Used Car Industry Revenue (billion) Forecast, by Application 2020 & 2033
- Table 27: Spain GCC Used Car Industry Revenue (billion) Forecast, by Application 2020 & 2033
- Table 28: Russia GCC Used Car Industry Revenue (billion) Forecast, by Application 2020 & 2033
- Table 29: Benelux GCC Used Car Industry Revenue (billion) Forecast, by Application 2020 & 2033
- Table 30: Nordics GCC Used Car Industry Revenue (billion) Forecast, by Application 2020 & 2033
- Table 31: Rest of Europe GCC Used Car Industry Revenue (billion) Forecast, by Application 2020 & 2033
- Table 32: Global GCC Used Car Industry Revenue billion Forecast, by Vehicle Type 2020 & 2033
- Table 33: Global GCC Used Car Industry Revenue billion Forecast, by Sales Channel 2020 & 2033
- Table 34: Global GCC Used Car Industry Revenue billion Forecast, by Vendor Type 2020 & 2033
- Table 35: Global GCC Used Car Industry Revenue billion Forecast, by Country 2020 & 2033
- Table 36: Turkey GCC Used Car Industry Revenue (billion) Forecast, by Application 2020 & 2033
- Table 37: Israel GCC Used Car Industry Revenue (billion) Forecast, by Application 2020 & 2033
- Table 38: GCC GCC Used Car Industry Revenue (billion) Forecast, by Application 2020 & 2033
- Table 39: North Africa GCC Used Car Industry Revenue (billion) Forecast, by Application 2020 & 2033
- Table 40: South Africa GCC Used Car Industry Revenue (billion) Forecast, by Application 2020 & 2033
- Table 41: Rest of Middle East & Africa GCC Used Car Industry Revenue (billion) Forecast, by Application 2020 & 2033
- Table 42: Global GCC Used Car Industry Revenue billion Forecast, by Vehicle Type 2020 & 2033
- Table 43: Global GCC Used Car Industry Revenue billion Forecast, by Sales Channel 2020 & 2033
- Table 44: Global GCC Used Car Industry Revenue billion Forecast, by Vendor Type 2020 & 2033
- Table 45: Global GCC Used Car Industry Revenue billion Forecast, by Country 2020 & 2033
- Table 46: China GCC Used Car Industry Revenue (billion) Forecast, by Application 2020 & 2033
- Table 47: India GCC Used Car Industry Revenue (billion) Forecast, by Application 2020 & 2033
- Table 48: Japan GCC Used Car Industry Revenue (billion) Forecast, by Application 2020 & 2033
- Table 49: South Korea GCC Used Car Industry Revenue (billion) Forecast, by Application 2020 & 2033
- Table 50: ASEAN GCC Used Car Industry Revenue (billion) Forecast, by Application 2020 & 2033
- Table 51: Oceania GCC Used Car Industry Revenue (billion) Forecast, by Application 2020 & 2033
- Table 52: Rest of Asia Pacific GCC Used Car Industry Revenue (billion) Forecast, by Application 2020 & 2033
Frequently Asked Questions
1. What is the projected Compound Annual Growth Rate (CAGR) of the GCC Used Car Industry?
The projected CAGR is approximately 8.05%.
2. Which companies are prominent players in the GCC Used Car Industry?
Key companies in the market include CARS, OLX, Abdul Latif Jameel Motors, AlTayer Motors, Yalla Motors, Dubizzle Motors LLC, Al-Futtaim Group, Arabian Auto Agency*List Not Exhaustive, Al Nabooda Automobiles LLC.
3. What are the main segments of the GCC Used Car Industry?
The market segments include Vehicle Type, Sales Channel, Vendor Type.
4. Can you provide details about the market size?
The market size is estimated to be USD 24.5 billion as of 2022.
5. What are some drivers contributing to market growth?
The Increasing Demand for Luxury Cars is Anticipated to Boost the Market.
6. What are the notable trends driving market growth?
Hatchback Segment is Expected to Gain Traction.
7. Are there any restraints impacting market growth?
Comparatively Limited Market Transparency May Hinder the Market.
8. Can you provide examples of recent developments in the market?
N/A
9. What pricing options are available for accessing the report?
Pricing options include single-user, multi-user, and enterprise licenses priced at USD 3800, USD 4500, and USD 5800 respectively.
10. Is the market size provided in terms of value or volume?
The market size is provided in terms of value, measured in billion.
11. Are there any specific market keywords associated with the report?
Yes, the market keyword associated with the report is "GCC Used Car Industry," which aids in identifying and referencing the specific market segment covered.
12. How do I determine which pricing option suits my needs best?
The pricing options vary based on user requirements and access needs. Individual users may opt for single-user licenses, while businesses requiring broader access may choose multi-user or enterprise licenses for cost-effective access to the report.
13. Are there any additional resources or data provided in the GCC Used Car Industry report?
While the report offers comprehensive insights, it's advisable to review the specific contents or supplementary materials provided to ascertain if additional resources or data are available.
14. How can I stay updated on further developments or reports in the GCC Used Car Industry?
To stay informed about further developments, trends, and reports in the GCC Used Car Industry, consider subscribing to industry newsletters, following relevant companies and organizations, or regularly checking reputable industry news sources and publications.
Methodology
Step 1 - Identification of Relevant Samples Size from Population Database


Step 2 - Approaches for Defining Global Market Size (Value, Volume* & Price*)

Note*: In applicable scenarios
Step 3 - Data Sources
Primary Research
- Web Analytics
- Survey Reports
- Research Institute
- Latest Research Reports
- Opinion Leaders
Secondary Research
- Annual Reports
- White Paper
- Latest Press Release
- Industry Association
- Paid Database
- Investor Presentations

Step 4 - Data Triangulation
Involves using different sources of information in order to increase the validity of a study
These sources are likely to be stakeholders in a program - participants, other researchers, program staff, other community members, and so on.
Then we put all data in single framework & apply various statistical tools to find out the dynamic on the market.
During the analysis stage, feedback from the stakeholder groups would be compared to determine areas of agreement as well as areas of divergence