

Key Insights
The Asia-Pacific (APAC) water automation and instrumentation market is experiencing robust growth, driven by increasing urbanization, industrialization, and the rising demand for efficient water management solutions. The region's expanding population and economic development necessitate advanced technologies for water treatment, distribution, and conservation. Factors like stringent government regulations on water quality and increasing water scarcity are further propelling market expansion. The market is segmented into water automation solutions (DCS, SCADA, PLC, HMI, and other solutions) and water instrumentation solutions (pressure, level, temperature transmitters; liquid and gas analyzers; leakage detection systems; flow sensors/transmitters; and other solutions). Within these segments, demand for advanced technologies like SCADA and intelligent sensors is particularly high, driven by the need for real-time monitoring and control of water systems. The adoption of smart water management solutions is creating opportunities for market players. While the initial investment in these technologies can be high, the long-term benefits in terms of operational efficiency, reduced water loss, and improved water quality are driving adoption.
Key players in the APAC water automation and instrumentation market include established international companies like Siemens, ABB, and Emerson Electric, alongside regional players specializing in water management solutions. Competition is intensifying, with companies focusing on innovation, strategic partnerships, and geographic expansion to gain market share. Although challenges remain, such as the high cost of advanced technologies and the need for skilled personnel, the overall market outlook for APAC remains positive. The market is projected to maintain a healthy growth trajectory throughout the forecast period (2025-2033), fueled by continued infrastructure development, rising environmental awareness, and a focus on sustainable water management practices. Countries like China and India, with their large populations and rapidly developing economies, represent key growth markets.
APAC Water Automation and Instrumentation Market: A Comprehensive Report (2019-2033)
This comprehensive report provides an in-depth analysis of the Asia-Pacific (APAC) water automation and instrumentation market, offering invaluable insights for industry professionals, investors, and strategists. With a focus on market dynamics, growth trends, and key players, this report covers the period from 2019 to 2033, using 2025 as the base year. The report segments the market by water automation solutions (DCS, SCADA, PLC, HMI, Others), water instrumentation solutions (Pressure Transmitter, Level Transmitter, Temperature Transmitter, Liquid Analyzers, Gas Analyzers, Leakage Detection Systems, Flow Sensors/Transmitters, Others), and end-user industries (Chemical, Manufacturing, Food and Beverages), across key APAC countries: Australia, China, Japan, India, and the Rest of Asia Pacific. The total market size is predicted to reach xx Million units by 2033.
APAC Water Automation and Instrumentation Market Dynamics & Structure
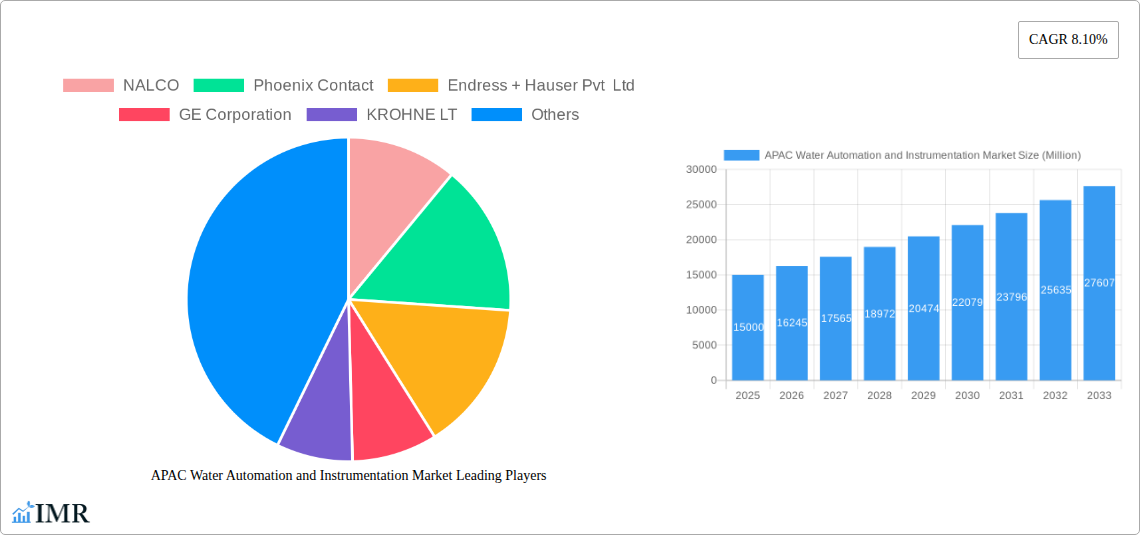
The APAC water automation and instrumentation market is characterized by moderate concentration, with key players like NALCO, Phoenix Contact, Endress + Hauser Pvt Ltd, GE Corporation, KROHNE LT, MJK Automation, Siemens AG, Schneider Electric SE, Emerson Electric, ABB Group, Rockwell Automation Inc, Yokogawa Electric Corporation, Mitsubishi Motors Corporation, and Eurotek India vying for market share. Market concentration is estimated at xx% in 2025, expected to slightly decrease to xx% by 2033 due to new entrants and increased competition.
- Technological Innovation: The market is driven by advancements in IoT, AI, and cloud-based solutions for improved water management and efficiency. However, challenges include high initial investment costs and integration complexities.
- Regulatory Landscape: Stringent government regulations on water conservation and pollution control are creating opportunities for automation and instrumentation solutions.
- Competitive Landscape: Intense competition among established players and emerging startups drives innovation and price competitiveness. M&A activity is moderate, with approximately xx deals recorded between 2019 and 2024, indicating a consolidating market.
- End-User Demographics: The growing industrialization and urbanization across APAC are major drivers, especially in China and India, boosting demand for advanced water management systems.
APAC Water Automation and Instrumentation Market Growth Trends & Insights
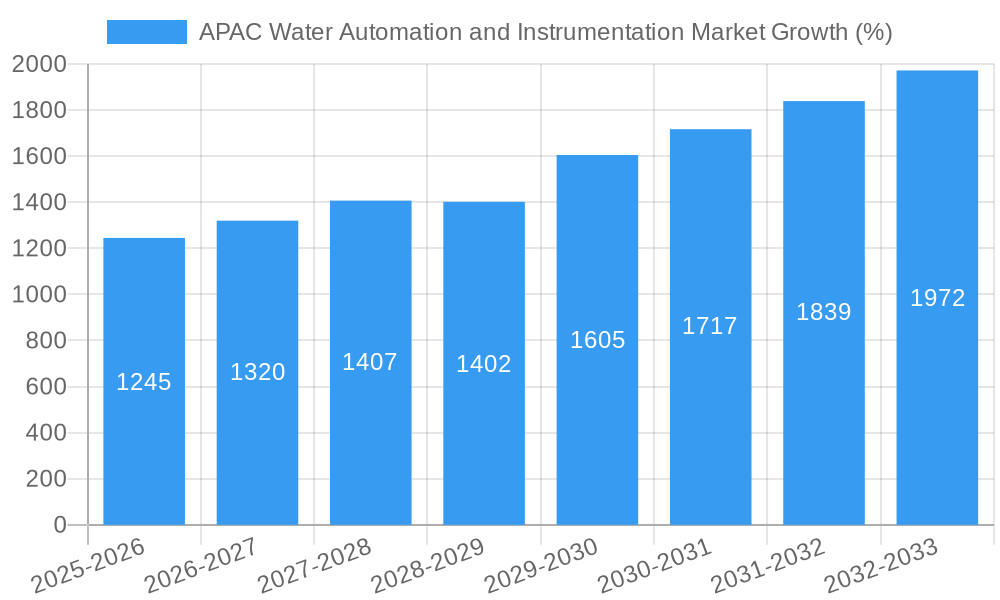
The APAC water automation and instrumentation market experienced substantial growth during the historical period (2019-2024), driven primarily by increasing water scarcity, stringent environmental regulations, and the expanding industrial sector. The market size grew from xx Million units in 2019 to xx Million units in 2024, exhibiting a Compound Annual Growth Rate (CAGR) of xx%. This upward trend is projected to continue throughout the forecast period (2025-2033), with a projected CAGR of xx%, reaching xx Million units by 2033. Market penetration is currently at xx% in key segments and is expected to reach xx% by 2033. Technological disruptions, such as the adoption of advanced sensors and analytics, are significantly influencing consumer behavior, pushing toward smarter and more efficient water management solutions. Government initiatives promoting smart cities and digitalization are further bolstering market growth.
Dominant Regions, Countries, or Segments in APAC Water Automation and Instrumentation Market
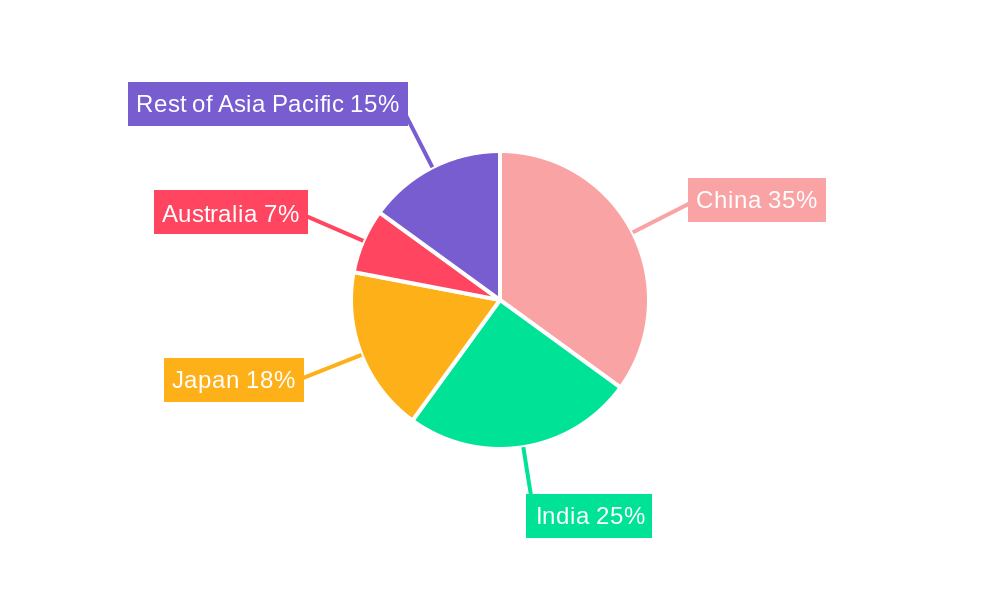
China and India are the dominant markets within APAC, accounting for xx% and xx% of the total market share in 2025, respectively. This dominance is attributed to their rapidly expanding industrial sectors, increasing urbanization, and substantial government investments in water infrastructure projects. Japan follows with a significant market share, driven by its technologically advanced water management systems and strong focus on efficiency.
Key Drivers:
- Rapid Industrialization and Urbanization: Driving demand for efficient water management in both industrial and municipal settings.
- Government Investments: Significant investments in water infrastructure projects across the region.
- Stringent Environmental Regulations: Encouraging adoption of advanced technologies for water conservation and pollution control.
Dominant Segments: SCADA and PLC systems dominate the water automation solutions segment, while pressure and level transmitters are the leading segments within water instrumentation solutions. The chemical and manufacturing sectors constitute the largest end-user industries, accounting for approximately xx% of the total market.
APAC Water Automation and Instrumentation Market Product Landscape
The APAC water automation and instrumentation market showcases continuous product innovation, with a focus on enhancing efficiency, accuracy, and reliability. The integration of advanced technologies such as artificial intelligence (AI), machine learning (ML), and the Internet of Things (IoT) is transforming the product landscape. Products are increasingly featuring cloud connectivity for remote monitoring and data analytics, resulting in improved decision-making and predictive maintenance capabilities. Unique selling propositions (USPs) include enhanced accuracy, reduced maintenance needs, and improved energy efficiency.
Key Drivers, Barriers & Challenges in APAC Water Automation and Instrumentation Market
Key Drivers: The increasing demand for efficient water management, driven by rapid urbanization and industrialization in APAC, is a major driver. Stricter environmental regulations and government initiatives promoting smart cities are also contributing to market growth. Technological advancements such as AI and IoT enable more efficient water usage and reduce water loss.
Challenges: High initial investment costs associated with implementing automation systems are a significant barrier, particularly for smaller businesses. Lack of skilled workforce and integration challenges hinder wider adoption. Supply chain disruptions and geopolitical uncertainties can also impact market growth negatively. Competitive pressures and price wars among vendors pose a challenge for profitability.
Emerging Opportunities in APAC Water Automation and Instrumentation Market
Untapped opportunities exist in rural areas with limited access to advanced water management systems. The growing focus on water reuse and recycling creates demand for innovative treatment and monitoring solutions. The increasing adoption of smart irrigation systems in agriculture presents a significant growth area. Furthermore, the rising awareness about water conservation and sustainability opens doors for energy-efficient automation and instrumentation solutions.
Growth Accelerators in the APAC Water Automation and Instrumentation Market Industry
Technological advancements, strategic partnerships between technology providers and water management companies, and government support for smart city initiatives are key growth accelerators. Expansion into untapped markets, particularly in rural areas, also presents a significant opportunity.
Key Players Shaping the APAC Water Automation and Instrumentation Market Market
- NALCO
- Phoenix Contact
- Endress + Hauser Pvt Ltd
- GE Corporation
- KROHNE LT
- MJK Automation
- Siemens AG
- Schneider Electric SE
- Emerson Electric
- ABB Group
- Rockwell Automation Inc
- Yokogawa Electric Corporation
- Mitsubishi Motors Corporation
- Eurotek India
Notable Milestones in APAC Water Automation and Instrumentation Market Sector
- August 2020: Wellin Tech launched a SCADA system solution for a large water conservancy pumping station, showcasing advancements in real-time monitoring and control.
- March 2021: A collaborative effort by Hokkaido University, Robotic Biology Institute Inc., iLAC Co., Ltd, and Shionogi & Co., Ltd. to develop an automated system for coronavirus analysis in wastewater highlighted the potential of automation in public health. This demonstrated the adaptability of water automation technologies beyond traditional applications.
In-Depth APAC Water Automation and Instrumentation Market Market Outlook
The APAC water automation and instrumentation market holds significant promise for long-term growth. Continued urbanization, industrial expansion, and stricter environmental regulations will drive demand for advanced water management solutions. Strategic partnerships, technological advancements, and government support will further fuel market expansion. The focus on sustainable water management and the adoption of innovative technologies will create lucrative opportunities for industry players in the coming years.
APAC Water Automation and Instrumentation Market Segmentation
-
1. Water Automation Solution
- 1.1. DCS
- 1.2. SCADA
- 1.3. PLC
- 1.4. HMI
- 1.5. Other Water Automation Solutions
-
2. Water Instrumentation Solution
- 2.1. Pressure Transmitter
- 2.2. Level Transmitter
- 2.3. Temperature Transmitter
- 2.4. Liquid Analyzers
- 2.5. Gas Analyzers
- 2.6. Leakage Detection Systems
- 2.7. Flow Sensors/Transmitters
- 2.8. Other Water Instrumentation Solutions
-
3. End-User Industry (Qualitative Analysis)
- 3.1. Chemical
- 3.2. Manufacturing
- 3.3. Food and Beverages
APAC Water Automation and Instrumentation Market Segmentation By Geography
-
1. North America
- 1.1. United States
- 1.2. Canada
- 1.3. Mexico
-
2. South America
- 2.1. Brazil
- 2.2. Argentina
- 2.3. Rest of South America
-
3. Europe
- 3.1. United Kingdom
- 3.2. Germany
- 3.3. France
- 3.4. Italy
- 3.5. Spain
- 3.6. Russia
- 3.7. Benelux
- 3.8. Nordics
- 3.9. Rest of Europe
-
4. Middle East & Africa
- 4.1. Turkey
- 4.2. Israel
- 4.3. GCC
- 4.4. North Africa
- 4.5. South Africa
- 4.6. Rest of Middle East & Africa
-
5. Asia Pacific
- 5.1. China
- 5.2. India
- 5.3. Japan
- 5.4. South Korea
- 5.5. ASEAN
- 5.6. Oceania
- 5.7. Rest of Asia Pacific
APAC Water Automation and Instrumentation Market REPORT HIGHLIGHTS
| Aspects | Details |
|---|---|
| Study Period | 2019-2033 |
| Base Year | 2024 |
| Estimated Year | 2025 |
| Forecast Period | 2025-2033 |
| Historical Period | 2019-2024 |
| Growth Rate | CAGR of 8.10% from 2019-2033 |
| Segmentation |
|
Table of Contents
- 1. Introduction
- 1.1. Research Scope
- 1.2. Market Segmentation
- 1.3. Research Methodology
- 1.4. Definitions and Assumptions
- 2. Executive Summary
- 2.1. Introduction
- 3. Market Dynamics
- 3.1. Introduction
- 3.2. Market Drivers
- 3.2.1. Government Regulation to Save Water Resources and Energy; Increase in Adoption of Smart Water Technologies
- 3.3. Market Restrains
- 3.3.1. Data Privacy; The Complex Structure of Cloud Storage
- 3.4. Market Trends
- 3.4.1. Demand from Food and Beverage Industry to Witness a Significant Growth Rate
- 4. Market Factor Analysis
- 4.1. Porters Five Forces
- 4.2. Supply/Value Chain
- 4.3. PESTEL analysis
- 4.4. Market Entropy
- 4.5. Patent/Trademark Analysis
- 5. Global APAC Water Automation and Instrumentation Market Analysis, Insights and Forecast, 2019-2031
- 5.1. Market Analysis, Insights and Forecast - by Water Automation Solution
- 5.1.1. DCS
- 5.1.2. SCADA
- 5.1.3. PLC
- 5.1.4. HMI
- 5.1.5. Other Water Automation Solutions
- 5.2. Market Analysis, Insights and Forecast - by Water Instrumentation Solution
- 5.2.1. Pressure Transmitter
- 5.2.2. Level Transmitter
- 5.2.3. Temperature Transmitter
- 5.2.4. Liquid Analyzers
- 5.2.5. Gas Analyzers
- 5.2.6. Leakage Detection Systems
- 5.2.7. Flow Sensors/Transmitters
- 5.2.8. Other Water Instrumentation Solutions
- 5.3. Market Analysis, Insights and Forecast - by End-User Industry (Qualitative Analysis)
- 5.3.1. Chemical
- 5.3.2. Manufacturing
- 5.3.3. Food and Beverages
- 5.4. Market Analysis, Insights and Forecast - by Region
- 5.4.1. North America
- 5.4.2. South America
- 5.4.3. Europe
- 5.4.4. Middle East & Africa
- 5.4.5. Asia Pacific
- 5.1. Market Analysis, Insights and Forecast - by Water Automation Solution
- 6. North America APAC Water Automation and Instrumentation Market Analysis, Insights and Forecast, 2019-2031
- 6.1. Market Analysis, Insights and Forecast - by Water Automation Solution
- 6.1.1. DCS
- 6.1.2. SCADA
- 6.1.3. PLC
- 6.1.4. HMI
- 6.1.5. Other Water Automation Solutions
- 6.2. Market Analysis, Insights and Forecast - by Water Instrumentation Solution
- 6.2.1. Pressure Transmitter
- 6.2.2. Level Transmitter
- 6.2.3. Temperature Transmitter
- 6.2.4. Liquid Analyzers
- 6.2.5. Gas Analyzers
- 6.2.6. Leakage Detection Systems
- 6.2.7. Flow Sensors/Transmitters
- 6.2.8. Other Water Instrumentation Solutions
- 6.3. Market Analysis, Insights and Forecast - by End-User Industry (Qualitative Analysis)
- 6.3.1. Chemical
- 6.3.2. Manufacturing
- 6.3.3. Food and Beverages
- 6.1. Market Analysis, Insights and Forecast - by Water Automation Solution
- 7. South America APAC Water Automation and Instrumentation Market Analysis, Insights and Forecast, 2019-2031
- 7.1. Market Analysis, Insights and Forecast - by Water Automation Solution
- 7.1.1. DCS
- 7.1.2. SCADA
- 7.1.3. PLC
- 7.1.4. HMI
- 7.1.5. Other Water Automation Solutions
- 7.2. Market Analysis, Insights and Forecast - by Water Instrumentation Solution
- 7.2.1. Pressure Transmitter
- 7.2.2. Level Transmitter
- 7.2.3. Temperature Transmitter
- 7.2.4. Liquid Analyzers
- 7.2.5. Gas Analyzers
- 7.2.6. Leakage Detection Systems
- 7.2.7. Flow Sensors/Transmitters
- 7.2.8. Other Water Instrumentation Solutions
- 7.3. Market Analysis, Insights and Forecast - by End-User Industry (Qualitative Analysis)
- 7.3.1. Chemical
- 7.3.2. Manufacturing
- 7.3.3. Food and Beverages
- 7.1. Market Analysis, Insights and Forecast - by Water Automation Solution
- 8. Europe APAC Water Automation and Instrumentation Market Analysis, Insights and Forecast, 2019-2031
- 8.1. Market Analysis, Insights and Forecast - by Water Automation Solution
- 8.1.1. DCS
- 8.1.2. SCADA
- 8.1.3. PLC
- 8.1.4. HMI
- 8.1.5. Other Water Automation Solutions
- 8.2. Market Analysis, Insights and Forecast - by Water Instrumentation Solution
- 8.2.1. Pressure Transmitter
- 8.2.2. Level Transmitter
- 8.2.3. Temperature Transmitter
- 8.2.4. Liquid Analyzers
- 8.2.5. Gas Analyzers
- 8.2.6. Leakage Detection Systems
- 8.2.7. Flow Sensors/Transmitters
- 8.2.8. Other Water Instrumentation Solutions
- 8.3. Market Analysis, Insights and Forecast - by End-User Industry (Qualitative Analysis)
- 8.3.1. Chemical
- 8.3.2. Manufacturing
- 8.3.3. Food and Beverages
- 8.1. Market Analysis, Insights and Forecast - by Water Automation Solution
- 9. Middle East & Africa APAC Water Automation and Instrumentation Market Analysis, Insights and Forecast, 2019-2031
- 9.1. Market Analysis, Insights and Forecast - by Water Automation Solution
- 9.1.1. DCS
- 9.1.2. SCADA
- 9.1.3. PLC
- 9.1.4. HMI
- 9.1.5. Other Water Automation Solutions
- 9.2. Market Analysis, Insights and Forecast - by Water Instrumentation Solution
- 9.2.1. Pressure Transmitter
- 9.2.2. Level Transmitter
- 9.2.3. Temperature Transmitter
- 9.2.4. Liquid Analyzers
- 9.2.5. Gas Analyzers
- 9.2.6. Leakage Detection Systems
- 9.2.7. Flow Sensors/Transmitters
- 9.2.8. Other Water Instrumentation Solutions
- 9.3. Market Analysis, Insights and Forecast - by End-User Industry (Qualitative Analysis)
- 9.3.1. Chemical
- 9.3.2. Manufacturing
- 9.3.3. Food and Beverages
- 9.1. Market Analysis, Insights and Forecast - by Water Automation Solution
- 10. Asia Pacific APAC Water Automation and Instrumentation Market Analysis, Insights and Forecast, 2019-2031
- 10.1. Market Analysis, Insights and Forecast - by Water Automation Solution
- 10.1.1. DCS
- 10.1.2. SCADA
- 10.1.3. PLC
- 10.1.4. HMI
- 10.1.5. Other Water Automation Solutions
- 10.2. Market Analysis, Insights and Forecast - by Water Instrumentation Solution
- 10.2.1. Pressure Transmitter
- 10.2.2. Level Transmitter
- 10.2.3. Temperature Transmitter
- 10.2.4. Liquid Analyzers
- 10.2.5. Gas Analyzers
- 10.2.6. Leakage Detection Systems
- 10.2.7. Flow Sensors/Transmitters
- 10.2.8. Other Water Instrumentation Solutions
- 10.3. Market Analysis, Insights and Forecast - by End-User Industry (Qualitative Analysis)
- 10.3.1. Chemical
- 10.3.2. Manufacturing
- 10.3.3. Food and Beverages
- 10.1. Market Analysis, Insights and Forecast - by Water Automation Solution
- 11. China APAC Water Automation and Instrumentation Market Analysis, Insights and Forecast, 2019-2031
- 12. India APAC Water Automation and Instrumentation Market Analysis, Insights and Forecast, 2019-2031
- 13. Japan APAC Water Automation and Instrumentation Market Analysis, Insights and Forecast, 2019-2031
- 14. Australia New Zealand APAC Water Automation and Instrumentation Market Analysis, Insights and Forecast, 2019-2031
- 15. Rest of Asia Pacific APAC Water Automation and Instrumentation Market Analysis, Insights and Forecast, 2019-2031
- 16. Competitive Analysis
- 16.1. Global Market Share Analysis 2024
- 16.2. Company Profiles
- 16.2.1 NALCO
- 16.2.1.1. Overview
- 16.2.1.2. Products
- 16.2.1.3. SWOT Analysis
- 16.2.1.4. Recent Developments
- 16.2.1.5. Financials (Based on Availability)
- 16.2.2 Phoenix Contact
- 16.2.2.1. Overview
- 16.2.2.2. Products
- 16.2.2.3. SWOT Analysis
- 16.2.2.4. Recent Developments
- 16.2.2.5. Financials (Based on Availability)
- 16.2.3 Endress + Hauser Pvt Ltd
- 16.2.3.1. Overview
- 16.2.3.2. Products
- 16.2.3.3. SWOT Analysis
- 16.2.3.4. Recent Developments
- 16.2.3.5. Financials (Based on Availability)
- 16.2.4 GE Corporation
- 16.2.4.1. Overview
- 16.2.4.2. Products
- 16.2.4.3. SWOT Analysis
- 16.2.4.4. Recent Developments
- 16.2.4.5. Financials (Based on Availability)
- 16.2.5 KROHNE LT
- 16.2.5.1. Overview
- 16.2.5.2. Products
- 16.2.5.3. SWOT Analysis
- 16.2.5.4. Recent Developments
- 16.2.5.5. Financials (Based on Availability)
- 16.2.6 MJK Automation
- 16.2.6.1. Overview
- 16.2.6.2. Products
- 16.2.6.3. SWOT Analysis
- 16.2.6.4. Recent Developments
- 16.2.6.5. Financials (Based on Availability)
- 16.2.7 Siemens AG
- 16.2.7.1. Overview
- 16.2.7.2. Products
- 16.2.7.3. SWOT Analysis
- 16.2.7.4. Recent Developments
- 16.2.7.5. Financials (Based on Availability)
- 16.2.8 Schneider Electric SE
- 16.2.8.1. Overview
- 16.2.8.2. Products
- 16.2.8.3. SWOT Analysis
- 16.2.8.4. Recent Developments
- 16.2.8.5. Financials (Based on Availability)
- 16.2.9 Emerson Electric
- 16.2.9.1. Overview
- 16.2.9.2. Products
- 16.2.9.3. SWOT Analysis
- 16.2.9.4. Recent Developments
- 16.2.9.5. Financials (Based on Availability)
- 16.2.10 ABB Group
- 16.2.10.1. Overview
- 16.2.10.2. Products
- 16.2.10.3. SWOT Analysis
- 16.2.10.4. Recent Developments
- 16.2.10.5. Financials (Based on Availability)
- 16.2.11 Rockwell Automation Inc
- 16.2.11.1. Overview
- 16.2.11.2. Products
- 16.2.11.3. SWOT Analysis
- 16.2.11.4. Recent Developments
- 16.2.11.5. Financials (Based on Availability)
- 16.2.12 Yokogawa Electric Corporation
- 16.2.12.1. Overview
- 16.2.12.2. Products
- 16.2.12.3. SWOT Analysis
- 16.2.12.4. Recent Developments
- 16.2.12.5. Financials (Based on Availability)
- 16.2.13 Mitsubishi Motors Corporation
- 16.2.13.1. Overview
- 16.2.13.2. Products
- 16.2.13.3. SWOT Analysis
- 16.2.13.4. Recent Developments
- 16.2.13.5. Financials (Based on Availability)
- 16.2.14 Eurotek India
- 16.2.14.1. Overview
- 16.2.14.2. Products
- 16.2.14.3. SWOT Analysis
- 16.2.14.4. Recent Developments
- 16.2.14.5. Financials (Based on Availability)
- 16.2.1 NALCO
List of Figures
- Figure 1: Global APAC Water Automation and Instrumentation Market Revenue Breakdown (Million, %) by Region 2024 & 2032
- Figure 2: Asia Pacific APAC Water Automation and Instrumentation Market Revenue (Million), by Country 2024 & 2032
- Figure 3: Asia Pacific APAC Water Automation and Instrumentation Market Revenue Share (%), by Country 2024 & 2032
- Figure 4: North America APAC Water Automation and Instrumentation Market Revenue (Million), by Water Automation Solution 2024 & 2032
- Figure 5: North America APAC Water Automation and Instrumentation Market Revenue Share (%), by Water Automation Solution 2024 & 2032
- Figure 6: North America APAC Water Automation and Instrumentation Market Revenue (Million), by Water Instrumentation Solution 2024 & 2032
- Figure 7: North America APAC Water Automation and Instrumentation Market Revenue Share (%), by Water Instrumentation Solution 2024 & 2032
- Figure 8: North America APAC Water Automation and Instrumentation Market Revenue (Million), by End-User Industry (Qualitative Analysis) 2024 & 2032
- Figure 9: North America APAC Water Automation and Instrumentation Market Revenue Share (%), by End-User Industry (Qualitative Analysis) 2024 & 2032
- Figure 10: North America APAC Water Automation and Instrumentation Market Revenue (Million), by Country 2024 & 2032
- Figure 11: North America APAC Water Automation and Instrumentation Market Revenue Share (%), by Country 2024 & 2032
- Figure 12: South America APAC Water Automation and Instrumentation Market Revenue (Million), by Water Automation Solution 2024 & 2032
- Figure 13: South America APAC Water Automation and Instrumentation Market Revenue Share (%), by Water Automation Solution 2024 & 2032
- Figure 14: South America APAC Water Automation and Instrumentation Market Revenue (Million), by Water Instrumentation Solution 2024 & 2032
- Figure 15: South America APAC Water Automation and Instrumentation Market Revenue Share (%), by Water Instrumentation Solution 2024 & 2032
- Figure 16: South America APAC Water Automation and Instrumentation Market Revenue (Million), by End-User Industry (Qualitative Analysis) 2024 & 2032
- Figure 17: South America APAC Water Automation and Instrumentation Market Revenue Share (%), by End-User Industry (Qualitative Analysis) 2024 & 2032
- Figure 18: South America APAC Water Automation and Instrumentation Market Revenue (Million), by Country 2024 & 2032
- Figure 19: South America APAC Water Automation and Instrumentation Market Revenue Share (%), by Country 2024 & 2032
- Figure 20: Europe APAC Water Automation and Instrumentation Market Revenue (Million), by Water Automation Solution 2024 & 2032
- Figure 21: Europe APAC Water Automation and Instrumentation Market Revenue Share (%), by Water Automation Solution 2024 & 2032
- Figure 22: Europe APAC Water Automation and Instrumentation Market Revenue (Million), by Water Instrumentation Solution 2024 & 2032
- Figure 23: Europe APAC Water Automation and Instrumentation Market Revenue Share (%), by Water Instrumentation Solution 2024 & 2032
- Figure 24: Europe APAC Water Automation and Instrumentation Market Revenue (Million), by End-User Industry (Qualitative Analysis) 2024 & 2032
- Figure 25: Europe APAC Water Automation and Instrumentation Market Revenue Share (%), by End-User Industry (Qualitative Analysis) 2024 & 2032
- Figure 26: Europe APAC Water Automation and Instrumentation Market Revenue (Million), by Country 2024 & 2032
- Figure 27: Europe APAC Water Automation and Instrumentation Market Revenue Share (%), by Country 2024 & 2032
- Figure 28: Middle East & Africa APAC Water Automation and Instrumentation Market Revenue (Million), by Water Automation Solution 2024 & 2032
- Figure 29: Middle East & Africa APAC Water Automation and Instrumentation Market Revenue Share (%), by Water Automation Solution 2024 & 2032
- Figure 30: Middle East & Africa APAC Water Automation and Instrumentation Market Revenue (Million), by Water Instrumentation Solution 2024 & 2032
- Figure 31: Middle East & Africa APAC Water Automation and Instrumentation Market Revenue Share (%), by Water Instrumentation Solution 2024 & 2032
- Figure 32: Middle East & Africa APAC Water Automation and Instrumentation Market Revenue (Million), by End-User Industry (Qualitative Analysis) 2024 & 2032
- Figure 33: Middle East & Africa APAC Water Automation and Instrumentation Market Revenue Share (%), by End-User Industry (Qualitative Analysis) 2024 & 2032
- Figure 34: Middle East & Africa APAC Water Automation and Instrumentation Market Revenue (Million), by Country 2024 & 2032
- Figure 35: Middle East & Africa APAC Water Automation and Instrumentation Market Revenue Share (%), by Country 2024 & 2032
- Figure 36: Asia Pacific APAC Water Automation and Instrumentation Market Revenue (Million), by Water Automation Solution 2024 & 2032
- Figure 37: Asia Pacific APAC Water Automation and Instrumentation Market Revenue Share (%), by Water Automation Solution 2024 & 2032
- Figure 38: Asia Pacific APAC Water Automation and Instrumentation Market Revenue (Million), by Water Instrumentation Solution 2024 & 2032
- Figure 39: Asia Pacific APAC Water Automation and Instrumentation Market Revenue Share (%), by Water Instrumentation Solution 2024 & 2032
- Figure 40: Asia Pacific APAC Water Automation and Instrumentation Market Revenue (Million), by End-User Industry (Qualitative Analysis) 2024 & 2032
- Figure 41: Asia Pacific APAC Water Automation and Instrumentation Market Revenue Share (%), by End-User Industry (Qualitative Analysis) 2024 & 2032
- Figure 42: Asia Pacific APAC Water Automation and Instrumentation Market Revenue (Million), by Country 2024 & 2032
- Figure 43: Asia Pacific APAC Water Automation and Instrumentation Market Revenue Share (%), by Country 2024 & 2032
List of Tables
- Table 1: Global APAC Water Automation and Instrumentation Market Revenue Million Forecast, by Region 2019 & 2032
- Table 2: Global APAC Water Automation and Instrumentation Market Revenue Million Forecast, by Water Automation Solution 2019 & 2032
- Table 3: Global APAC Water Automation and Instrumentation Market Revenue Million Forecast, by Water Instrumentation Solution 2019 & 2032
- Table 4: Global APAC Water Automation and Instrumentation Market Revenue Million Forecast, by End-User Industry (Qualitative Analysis) 2019 & 2032
- Table 5: Global APAC Water Automation and Instrumentation Market Revenue Million Forecast, by Region 2019 & 2032
- Table 6: Global APAC Water Automation and Instrumentation Market Revenue Million Forecast, by Country 2019 & 2032
- Table 7: China APAC Water Automation and Instrumentation Market Revenue (Million) Forecast, by Application 2019 & 2032
- Table 8: India APAC Water Automation and Instrumentation Market Revenue (Million) Forecast, by Application 2019 & 2032
- Table 9: Japan APAC Water Automation and Instrumentation Market Revenue (Million) Forecast, by Application 2019 & 2032
- Table 10: Australia New Zealand APAC Water Automation and Instrumentation Market Revenue (Million) Forecast, by Application 2019 & 2032
- Table 11: Rest of Asia Pacific APAC Water Automation and Instrumentation Market Revenue (Million) Forecast, by Application 2019 & 2032
- Table 12: Global APAC Water Automation and Instrumentation Market Revenue Million Forecast, by Water Automation Solution 2019 & 2032
- Table 13: Global APAC Water Automation and Instrumentation Market Revenue Million Forecast, by Water Instrumentation Solution 2019 & 2032
- Table 14: Global APAC Water Automation and Instrumentation Market Revenue Million Forecast, by End-User Industry (Qualitative Analysis) 2019 & 2032
- Table 15: Global APAC Water Automation and Instrumentation Market Revenue Million Forecast, by Country 2019 & 2032
- Table 16: United States APAC Water Automation and Instrumentation Market Revenue (Million) Forecast, by Application 2019 & 2032
- Table 17: Canada APAC Water Automation and Instrumentation Market Revenue (Million) Forecast, by Application 2019 & 2032
- Table 18: Mexico APAC Water Automation and Instrumentation Market Revenue (Million) Forecast, by Application 2019 & 2032
- Table 19: Global APAC Water Automation and Instrumentation Market Revenue Million Forecast, by Water Automation Solution 2019 & 2032
- Table 20: Global APAC Water Automation and Instrumentation Market Revenue Million Forecast, by Water Instrumentation Solution 2019 & 2032
- Table 21: Global APAC Water Automation and Instrumentation Market Revenue Million Forecast, by End-User Industry (Qualitative Analysis) 2019 & 2032
- Table 22: Global APAC Water Automation and Instrumentation Market Revenue Million Forecast, by Country 2019 & 2032
- Table 23: Brazil APAC Water Automation and Instrumentation Market Revenue (Million) Forecast, by Application 2019 & 2032
- Table 24: Argentina APAC Water Automation and Instrumentation Market Revenue (Million) Forecast, by Application 2019 & 2032
- Table 25: Rest of South America APAC Water Automation and Instrumentation Market Revenue (Million) Forecast, by Application 2019 & 2032
- Table 26: Global APAC Water Automation and Instrumentation Market Revenue Million Forecast, by Water Automation Solution 2019 & 2032
- Table 27: Global APAC Water Automation and Instrumentation Market Revenue Million Forecast, by Water Instrumentation Solution 2019 & 2032
- Table 28: Global APAC Water Automation and Instrumentation Market Revenue Million Forecast, by End-User Industry (Qualitative Analysis) 2019 & 2032
- Table 29: Global APAC Water Automation and Instrumentation Market Revenue Million Forecast, by Country 2019 & 2032
- Table 30: United Kingdom APAC Water Automation and Instrumentation Market Revenue (Million) Forecast, by Application 2019 & 2032
- Table 31: Germany APAC Water Automation and Instrumentation Market Revenue (Million) Forecast, by Application 2019 & 2032
- Table 32: France APAC Water Automation and Instrumentation Market Revenue (Million) Forecast, by Application 2019 & 2032
- Table 33: Italy APAC Water Automation and Instrumentation Market Revenue (Million) Forecast, by Application 2019 & 2032
- Table 34: Spain APAC Water Automation and Instrumentation Market Revenue (Million) Forecast, by Application 2019 & 2032
- Table 35: Russia APAC Water Automation and Instrumentation Market Revenue (Million) Forecast, by Application 2019 & 2032
- Table 36: Benelux APAC Water Automation and Instrumentation Market Revenue (Million) Forecast, by Application 2019 & 2032
- Table 37: Nordics APAC Water Automation and Instrumentation Market Revenue (Million) Forecast, by Application 2019 & 2032
- Table 38: Rest of Europe APAC Water Automation and Instrumentation Market Revenue (Million) Forecast, by Application 2019 & 2032
- Table 39: Global APAC Water Automation and Instrumentation Market Revenue Million Forecast, by Water Automation Solution 2019 & 2032
- Table 40: Global APAC Water Automation and Instrumentation Market Revenue Million Forecast, by Water Instrumentation Solution 2019 & 2032
- Table 41: Global APAC Water Automation and Instrumentation Market Revenue Million Forecast, by End-User Industry (Qualitative Analysis) 2019 & 2032
- Table 42: Global APAC Water Automation and Instrumentation Market Revenue Million Forecast, by Country 2019 & 2032
- Table 43: Turkey APAC Water Automation and Instrumentation Market Revenue (Million) Forecast, by Application 2019 & 2032
- Table 44: Israel APAC Water Automation and Instrumentation Market Revenue (Million) Forecast, by Application 2019 & 2032
- Table 45: GCC APAC Water Automation and Instrumentation Market Revenue (Million) Forecast, by Application 2019 & 2032
- Table 46: North Africa APAC Water Automation and Instrumentation Market Revenue (Million) Forecast, by Application 2019 & 2032
- Table 47: South Africa APAC Water Automation and Instrumentation Market Revenue (Million) Forecast, by Application 2019 & 2032
- Table 48: Rest of Middle East & Africa APAC Water Automation and Instrumentation Market Revenue (Million) Forecast, by Application 2019 & 2032
- Table 49: Global APAC Water Automation and Instrumentation Market Revenue Million Forecast, by Water Automation Solution 2019 & 2032
- Table 50: Global APAC Water Automation and Instrumentation Market Revenue Million Forecast, by Water Instrumentation Solution 2019 & 2032
- Table 51: Global APAC Water Automation and Instrumentation Market Revenue Million Forecast, by End-User Industry (Qualitative Analysis) 2019 & 2032
- Table 52: Global APAC Water Automation and Instrumentation Market Revenue Million Forecast, by Country 2019 & 2032
- Table 53: China APAC Water Automation and Instrumentation Market Revenue (Million) Forecast, by Application 2019 & 2032
- Table 54: India APAC Water Automation and Instrumentation Market Revenue (Million) Forecast, by Application 2019 & 2032
- Table 55: Japan APAC Water Automation and Instrumentation Market Revenue (Million) Forecast, by Application 2019 & 2032
- Table 56: South Korea APAC Water Automation and Instrumentation Market Revenue (Million) Forecast, by Application 2019 & 2032
- Table 57: ASEAN APAC Water Automation and Instrumentation Market Revenue (Million) Forecast, by Application 2019 & 2032
- Table 58: Oceania APAC Water Automation and Instrumentation Market Revenue (Million) Forecast, by Application 2019 & 2032
- Table 59: Rest of Asia Pacific APAC Water Automation and Instrumentation Market Revenue (Million) Forecast, by Application 2019 & 2032
Frequently Asked Questions
1. What is the projected Compound Annual Growth Rate (CAGR) of the APAC Water Automation and Instrumentation Market?
The projected CAGR is approximately 8.10%.
2. Which companies are prominent players in the APAC Water Automation and Instrumentation Market?
Key companies in the market include NALCO, Phoenix Contact, Endress + Hauser Pvt Ltd, GE Corporation, KROHNE LT, MJK Automation, Siemens AG, Schneider Electric SE, Emerson Electric, ABB Group, Rockwell Automation Inc, Yokogawa Electric Corporation, Mitsubishi Motors Corporation, Eurotek India.
3. What are the main segments of the APAC Water Automation and Instrumentation Market?
The market segments include Water Automation Solution, Water Instrumentation Solution, End-User Industry (Qualitative Analysis).
4. Can you provide details about the market size?
The market size is estimated to be USD XX Million as of 2022.
5. What are some drivers contributing to market growth?
Government Regulation to Save Water Resources and Energy; Increase in Adoption of Smart Water Technologies.
6. What are the notable trends driving market growth?
Demand from Food and Beverage Industry to Witness a Significant Growth Rate.
7. Are there any restraints impacting market growth?
Data Privacy; The Complex Structure of Cloud Storage.
8. Can you provide examples of recent developments in the market?
March 2021 - In response to the COVID-19 pandemic, Hokkaido University, Robotic Biology Institute Inc., iLAC Co., Ltd, and Shionogi & Co., Ltd entered a memorandum of understanding toward the establishment of an automated system for the analysis of the novel coronavirus in wastewater.
9. What pricing options are available for accessing the report?
Pricing options include single-user, multi-user, and enterprise licenses priced at USD 4750, USD 4950, and USD 6800 respectively.
10. Is the market size provided in terms of value or volume?
The market size is provided in terms of value, measured in Million.
11. Are there any specific market keywords associated with the report?
Yes, the market keyword associated with the report is "APAC Water Automation and Instrumentation Market," which aids in identifying and referencing the specific market segment covered.
12. How do I determine which pricing option suits my needs best?
The pricing options vary based on user requirements and access needs. Individual users may opt for single-user licenses, while businesses requiring broader access may choose multi-user or enterprise licenses for cost-effective access to the report.
13. Are there any additional resources or data provided in the APAC Water Automation and Instrumentation Market report?
While the report offers comprehensive insights, it's advisable to review the specific contents or supplementary materials provided to ascertain if additional resources or data are available.
14. How can I stay updated on further developments or reports in the APAC Water Automation and Instrumentation Market?
To stay informed about further developments, trends, and reports in the APAC Water Automation and Instrumentation Market, consider subscribing to industry newsletters, following relevant companies and organizations, or regularly checking reputable industry news sources and publications.
Methodology
Step 1 - Identification of Relevant Samples Size from Population Database


Step 2 - Approaches for Defining Global Market Size (Value, Volume* & Price*)

Note*: In applicable scenarios
Step 3 - Data Sources
Primary Research
- Web Analytics
- Survey Reports
- Research Institute
- Latest Research Reports
- Opinion Leaders
Secondary Research
- Annual Reports
- White Paper
- Latest Press Release
- Industry Association
- Paid Database
- Investor Presentations

Step 4 - Data Triangulation
Involves using different sources of information in order to increase the validity of a study
These sources are likely to be stakeholders in a program - participants, other researchers, program staff, other community members, and so on.
Then we put all data in single framework & apply various statistical tools to find out the dynamic on the market.
During the analysis stage, feedback from the stakeholder groups would be compared to determine areas of agreement as well as areas of divergence
