

Key Insights
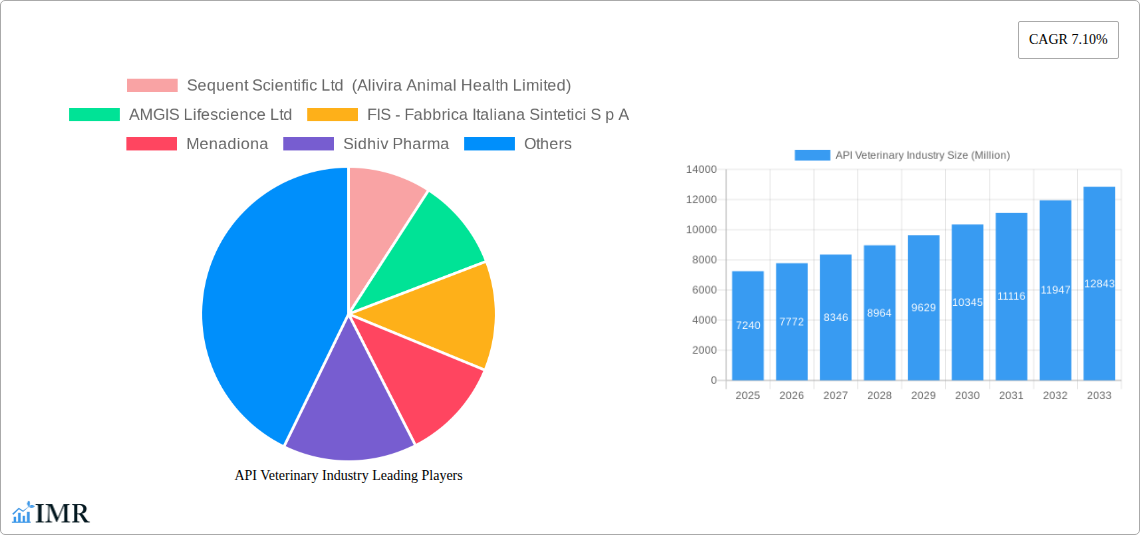
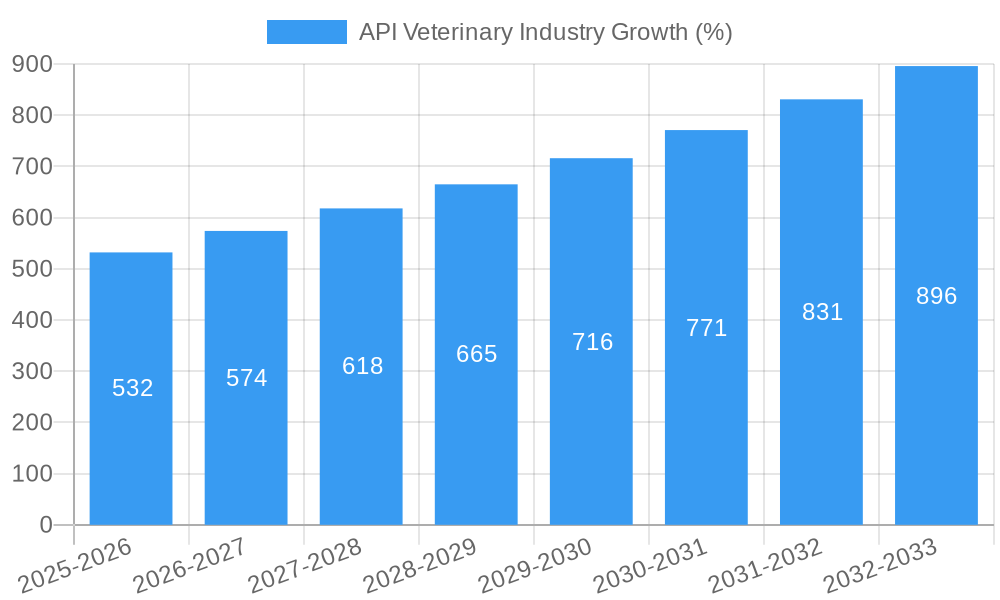
The global API Veterinary market, valued at $7.24 billion in 2025, is projected to experience robust growth, driven by a Compound Annual Growth Rate (CAGR) of 7.10% from 2025 to 2033. This expansion is fueled by several key factors. Firstly, the increasing prevalence of animal diseases necessitates the development and use of advanced veterinary pharmaceuticals, boosting demand for Active Pharmaceutical Ingredients (APIs). Secondly, the rising pet ownership globally, particularly in emerging economies, significantly contributes to market growth as pet owners increasingly prioritize their animals' health. Thirdly, the ongoing research and development efforts focused on innovative APIs, such as those targeting emerging zoonotic diseases and antimicrobial resistance, are further accelerating market expansion. Finally, the growing adoption of contract outsourcing services by veterinary pharmaceutical companies, seeking cost-effectiveness and expertise, is a notable market driver. The market segments are diverse, with antiparasitic, anti-infective, and vaccine APIs holding significant shares. Chemical-based APIs currently dominate the synthesis type segment, but biological APIs are expected to witness substantial growth owing to their enhanced efficacy and reduced side effects.
However, the market's growth is not without challenges. Regulatory hurdles in different regions, particularly concerning the approval and licensing of new veterinary APIs, pose a significant restraint. The high cost of R&D and manufacturing, especially for highly potent APIs (HPAPIs), also restricts market expansion. Furthermore, price fluctuations in raw materials and the stringent quality control requirements for veterinary APIs can impact profitability. Despite these constraints, the long-term outlook for the API Veterinary market remains positive, with substantial opportunities for growth in emerging markets and through technological advancements in API development and production. The competitive landscape is marked by a mix of established players and emerging companies, both focusing on innovation and strategic partnerships to secure a larger market share. Geographic expansion, particularly in Asia-Pacific and other developing regions, presents significant potential for market growth.
This comprehensive report provides a detailed analysis of the API Veterinary Industry market, encompassing market dynamics, growth trends, regional dominance, product landscape, challenges, opportunities, and key players. The study period spans from 2019 to 2033, with 2025 serving as the base and estimated year. The report leverages extensive data and industry expertise to offer actionable insights for stakeholders across the parent market (Veterinary Pharmaceuticals) and child market (Veterinary APIs). Market values are presented in millions of units.
API Veterinary Industry Market Dynamics & Structure
The global API Veterinary Industry market is characterized by moderate concentration, with a few large players and numerous smaller companies. Technological innovation, particularly in biological APIs and HPAPIs, is a key driver, alongside increasing demand for effective and safer animal health products. Stringent regulatory frameworks, including those governed by agencies like the FDA and EMA, significantly impact market operations. Competitive pressures from generic APIs and the emergence of biosimilars are notable. End-user demographics are influenced by the evolving needs of livestock farming and companion animal care. The M&A landscape is relatively active, with strategic acquisitions aimed at expanding product portfolios and market reach. The Sequent Scientific’s acquisition of Tineta Pharma in 2022 exemplifies this trend.
- Market Concentration: Moderately concentrated, with a Herfindahl-Hirschman Index (HHI) of xx.
- Technological Innovation: Focus on biological APIs, HPAPIs, and improved delivery systems.
- Regulatory Landscape: Stringent regulations governing API manufacturing and approval processes.
- Competitive Landscape: Intense competition, with pressure from generic APIs and biosimilars.
- M&A Activity: Significant M&A activity driven by expansion and diversification strategies. (e.g., Sequent Scientific's acquisition of Tineta Pharma). Deal volume: xx Million in 2024.
API Veterinary Industry Growth Trends & Insights
The API Veterinary Industry market witnessed robust growth during the historical period (2019-2024), driven by factors like rising animal population, increasing pet ownership, growing awareness of animal health, and technological advancements. The market is projected to maintain a healthy CAGR of xx% during the forecast period (2025-2033), reaching a market size of xx Million by 2033. Market penetration of novel APIs, particularly in emerging markets, remains a key growth opportunity. Technological disruptions, such as the rise of personalized medicine in veterinary care, are shaping future market trajectories. Consumer behavior is shifting towards greater demand for high-quality, safe, and effective veterinary APIs. Adoption of advanced analytical techniques for API development and quality control is also fueling growth.
Dominant Regions, Countries, or Segments in API Veterinary Industry
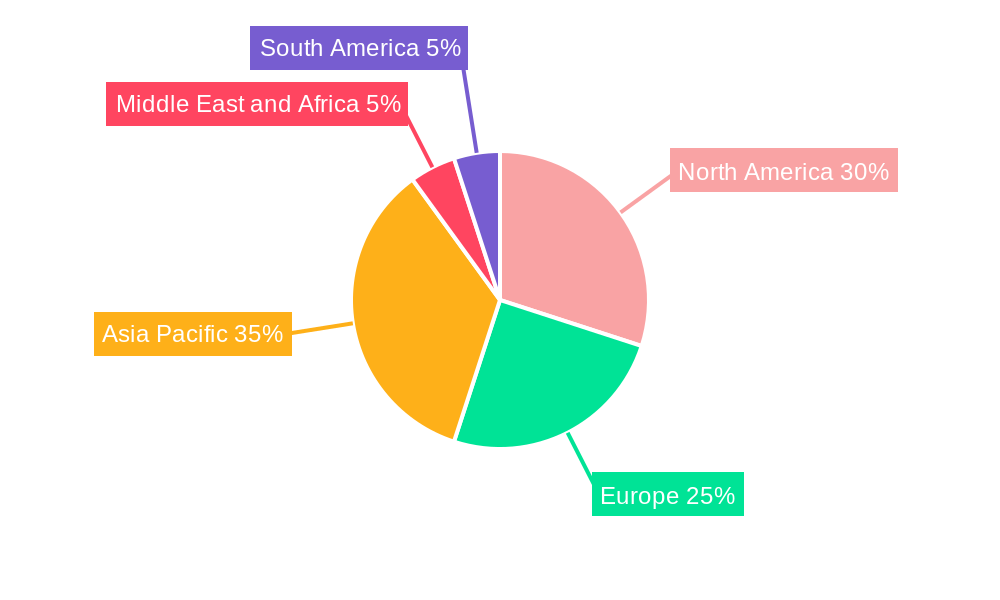
North America and Europe currently dominate the API Veterinary Industry market, owing to robust regulatory frameworks, established infrastructure, and high animal healthcare expenditure. However, Asia-Pacific is emerging as a significant growth region, driven by expanding livestock farming and rising pet ownership. Within product segments, Antiparasitics and Anti-infectives hold the largest market share. The Contract Outsourcing segment is gaining traction, driven by the increasing need for specialized expertise and cost optimization. Chemical-based APIs maintain a significant market share, although the demand for Biological APIs and HPAPIs is steadily increasing.
- Leading Region: North America (Market share: xx%)
- Fastest-growing Region: Asia-Pacific (CAGR: xx%)
- Dominant Product Segment: Antiparasitics and Anti-infectives (Combined market share: xx%)
- Fastest-growing Product Segment: Biological APIs (CAGR: xx%)
- Dominant Service Type: Contract Outsourcing (Market share: xx%)
API Veterinary Industry Product Landscape
The API Veterinary Industry offers a diverse range of products, encompassing antiparasitics, anti-infectives, vaccines, NSAIDs, and other therapeutic agents. Significant innovations focus on improving efficacy, reducing side effects, and enhancing delivery systems. The emergence of novel drug targets and advanced formulation technologies is driving the development of next-generation veterinary APIs. Unique selling propositions are built around efficacy, safety profiles, ease of administration, and cost-effectiveness.
Key Drivers, Barriers & Challenges in API Veterinary Industry
Key Drivers:
- Growing animal population and pet ownership
- Increased awareness of animal health and welfare
- Advancements in veterinary diagnostics and therapeutics
- Stringent government regulations promoting animal health
- Growing demand for safe and effective veterinary medications.
Challenges:
- Stringent regulatory requirements leading to high R&D costs and longer approval times.
- Potential supply chain disruptions impacting API availability and pricing.
- Intense competition from generic drug manufacturers.
- Rising raw material costs. (Estimated impact on market growth: xx% reduction)
Emerging Opportunities in API Veterinary Industry
- Expansion into emerging markets with increasing animal health spending.
- Development of novel APIs targeting unmet medical needs in veterinary medicine.
- Increased focus on personalized medicine and targeted therapies for animals.
- Growing demand for biosimilars and generic APIs.
Growth Accelerators in the API Veterinary Industry Industry
Technological breakthroughs, particularly in genomics and proteomics, are paving the way for more targeted and effective veterinary APIs. Strategic partnerships between API manufacturers and veterinary pharmaceutical companies are driving innovation and market expansion. Efforts to improve supply chain resilience and reduce reliance on single-source suppliers will enhance market stability and growth.
Key Players Shaping the API Veterinary Industry Market
- Sequent Scientific Ltd (Alivira Animal Health Limited)
- AMGIS Lifescience Ltd
- FIS - Fabbrica Italiana Sintetici S p A
- Menadiona
- Sidhiv Pharma
- NGL Fine-Chem Ltd
- Grupo Indukern S L
- Chempro Pharma Private Limited
- SUANFARMA
- Stanley Black & Decker (Excel Industries Limited)
- Ofichem Group
Notable Milestones in API Veterinary Industry Sector
- November 2022: Sequent Scientific Limited acquires 100% stake in Tineta Pharma Private Limited.
- January 2022: Sequent Scientific Limited achieves EU CEP for Diclazuril API.
In-Depth API Veterinary Industry Market Outlook
The API Veterinary Industry is poised for continued growth, driven by a confluence of factors including technological advancements, increasing animal healthcare spending, and the expansion of the veterinary pharmaceutical market. Strategic acquisitions, collaborations, and the development of novel APIs will further fuel market expansion. The market presents significant opportunities for companies that can effectively navigate the regulatory landscape and leverage technological innovations to meet the evolving needs of the veterinary industry.
API Veterinary Industry Segmentation
-
1. Product
- 1.1. Antiparasitic
- 1.2. Anti-infectives
- 1.3. Vaccines
- 1.4. NSAIDs
-
2. Synthesis Type
- 2.1. Chemical Based API
- 2.2. Biological API
- 2.3. Highly Potent API (HPAPI)
-
3. Service Type
- 3.1. In House
-
3.2. Contract Outsourcing
- 3.2.1. Contract Development
- 3.2.2. Contract Manufacturing
API Veterinary Industry Segmentation By Geography
-
1. North America
- 1.1. United States
- 1.2. Canada
- 1.3. Mexico
-
2. Europe
- 2.1. Germany
- 2.2. United Kingdom
- 2.3. France
- 2.4. Italy
- 2.5. Spain
- 2.6. Rest of Europe
-
3. Asia Pacific
- 3.1. China
- 3.2. Japan
- 3.3. India
- 3.4. Australia
- 3.5. South Korea
- 3.6. Rest of Asia Pacific
-
4. Middle East and Africa
- 4.1. GCC
- 4.2. South Africa
- 4.3. Rest of Middle East and Africa
-
5. South America
- 5.1. Brazil
- 5.2. Argentina
- 5.3. Rest of South America
API Veterinary Industry REPORT HIGHLIGHTS
| Aspects | Details |
|---|---|
| Study Period | 2019-2033 |
| Base Year | 2024 |
| Estimated Year | 2025 |
| Forecast Period | 2025-2033 |
| Historical Period | 2019-2024 |
| Growth Rate | CAGR of 7.10% from 2019-2033 |
| Segmentation |
|
Table of Contents
- 1. Introduction
- 1.1. Research Scope
- 1.2. Market Segmentation
- 1.3. Research Methodology
- 1.4. Definitions and Assumptions
- 2. Executive Summary
- 2.1. Introduction
- 3. Market Dynamics
- 3.1. Introduction
- 3.2. Market Drivers
- 3.2.1. Increasing Prevalence of Zoonotic Diseases; Increasing Animal Population And Pet Ownership; Rising Number of Veterinarians and Veterinary Visits
- 3.3. Market Restrains
- 3.3.1. Lack of Awareness and High Cost of Animal Care; Stringent Government Regulations
- 3.4. Market Trends
- 3.4.1. The Vaccines Segment is Expected to Hold a Significant Market Share in the Veterinary Active Pharmaceutical Ingredients Manufacturing Market
- 4. Market Factor Analysis
- 4.1. Porters Five Forces
- 4.2. Supply/Value Chain
- 4.3. PESTEL analysis
- 4.4. Market Entropy
- 4.5. Patent/Trademark Analysis
- 5. Global API Veterinary Industry Analysis, Insights and Forecast, 2019-2031
- 5.1. Market Analysis, Insights and Forecast - by Product
- 5.1.1. Antiparasitic
- 5.1.2. Anti-infectives
- 5.1.3. Vaccines
- 5.1.4. NSAIDs
- 5.2. Market Analysis, Insights and Forecast - by Synthesis Type
- 5.2.1. Chemical Based API
- 5.2.2. Biological API
- 5.2.3. Highly Potent API (HPAPI)
- 5.3. Market Analysis, Insights and Forecast - by Service Type
- 5.3.1. In House
- 5.3.2. Contract Outsourcing
- 5.3.2.1. Contract Development
- 5.3.2.2. Contract Manufacturing
- 5.4. Market Analysis, Insights and Forecast - by Region
- 5.4.1. North America
- 5.4.2. Europe
- 5.4.3. Asia Pacific
- 5.4.4. Middle East and Africa
- 5.4.5. South America
- 5.1. Market Analysis, Insights and Forecast - by Product
- 6. North America API Veterinary Industry Analysis, Insights and Forecast, 2019-2031
- 6.1. Market Analysis, Insights and Forecast - by Product
- 6.1.1. Antiparasitic
- 6.1.2. Anti-infectives
- 6.1.3. Vaccines
- 6.1.4. NSAIDs
- 6.2. Market Analysis, Insights and Forecast - by Synthesis Type
- 6.2.1. Chemical Based API
- 6.2.2. Biological API
- 6.2.3. Highly Potent API (HPAPI)
- 6.3. Market Analysis, Insights and Forecast - by Service Type
- 6.3.1. In House
- 6.3.2. Contract Outsourcing
- 6.3.2.1. Contract Development
- 6.3.2.2. Contract Manufacturing
- 6.1. Market Analysis, Insights and Forecast - by Product
- 7. Europe API Veterinary Industry Analysis, Insights and Forecast, 2019-2031
- 7.1. Market Analysis, Insights and Forecast - by Product
- 7.1.1. Antiparasitic
- 7.1.2. Anti-infectives
- 7.1.3. Vaccines
- 7.1.4. NSAIDs
- 7.2. Market Analysis, Insights and Forecast - by Synthesis Type
- 7.2.1. Chemical Based API
- 7.2.2. Biological API
- 7.2.3. Highly Potent API (HPAPI)
- 7.3. Market Analysis, Insights and Forecast - by Service Type
- 7.3.1. In House
- 7.3.2. Contract Outsourcing
- 7.3.2.1. Contract Development
- 7.3.2.2. Contract Manufacturing
- 7.1. Market Analysis, Insights and Forecast - by Product
- 8. Asia Pacific API Veterinary Industry Analysis, Insights and Forecast, 2019-2031
- 8.1. Market Analysis, Insights and Forecast - by Product
- 8.1.1. Antiparasitic
- 8.1.2. Anti-infectives
- 8.1.3. Vaccines
- 8.1.4. NSAIDs
- 8.2. Market Analysis, Insights and Forecast - by Synthesis Type
- 8.2.1. Chemical Based API
- 8.2.2. Biological API
- 8.2.3. Highly Potent API (HPAPI)
- 8.3. Market Analysis, Insights and Forecast - by Service Type
- 8.3.1. In House
- 8.3.2. Contract Outsourcing
- 8.3.2.1. Contract Development
- 8.3.2.2. Contract Manufacturing
- 8.1. Market Analysis, Insights and Forecast - by Product
- 9. Middle East and Africa API Veterinary Industry Analysis, Insights and Forecast, 2019-2031
- 9.1. Market Analysis, Insights and Forecast - by Product
- 9.1.1. Antiparasitic
- 9.1.2. Anti-infectives
- 9.1.3. Vaccines
- 9.1.4. NSAIDs
- 9.2. Market Analysis, Insights and Forecast - by Synthesis Type
- 9.2.1. Chemical Based API
- 9.2.2. Biological API
- 9.2.3. Highly Potent API (HPAPI)
- 9.3. Market Analysis, Insights and Forecast - by Service Type
- 9.3.1. In House
- 9.3.2. Contract Outsourcing
- 9.3.2.1. Contract Development
- 9.3.2.2. Contract Manufacturing
- 9.1. Market Analysis, Insights and Forecast - by Product
- 10. South America API Veterinary Industry Analysis, Insights and Forecast, 2019-2031
- 10.1. Market Analysis, Insights and Forecast - by Product
- 10.1.1. Antiparasitic
- 10.1.2. Anti-infectives
- 10.1.3. Vaccines
- 10.1.4. NSAIDs
- 10.2. Market Analysis, Insights and Forecast - by Synthesis Type
- 10.2.1. Chemical Based API
- 10.2.2. Biological API
- 10.2.3. Highly Potent API (HPAPI)
- 10.3. Market Analysis, Insights and Forecast - by Service Type
- 10.3.1. In House
- 10.3.2. Contract Outsourcing
- 10.3.2.1. Contract Development
- 10.3.2.2. Contract Manufacturing
- 10.1. Market Analysis, Insights and Forecast - by Product
- 11. North America API Veterinary Industry Analysis, Insights and Forecast, 2019-2031
- 11.1. Market Analysis, Insights and Forecast - By Country/Sub-region
- 11.1.1 United States
- 11.1.2 Canada
- 11.1.3 Mexico
- 12. Europe API Veterinary Industry Analysis, Insights and Forecast, 2019-2031
- 12.1. Market Analysis, Insights and Forecast - By Country/Sub-region
- 12.1.1 Germany
- 12.1.2 United Kingdom
- 12.1.3 France
- 12.1.4 Italy
- 12.1.5 Spain
- 12.1.6 Rest of Europe
- 13. Asia Pacific API Veterinary Industry Analysis, Insights and Forecast, 2019-2031
- 13.1. Market Analysis, Insights and Forecast - By Country/Sub-region
- 13.1.1 China
- 13.1.2 Japan
- 13.1.3 India
- 13.1.4 Australia
- 13.1.5 South Korea
- 13.1.6 Rest of Asia Pacific
- 14. Middle East and Africa API Veterinary Industry Analysis, Insights and Forecast, 2019-2031
- 14.1. Market Analysis, Insights and Forecast - By Country/Sub-region
- 14.1.1 GCC
- 14.1.2 South Africa
- 14.1.3 Rest of Middle East and Africa
- 15. South America API Veterinary Industry Analysis, Insights and Forecast, 2019-2031
- 15.1. Market Analysis, Insights and Forecast - By Country/Sub-region
- 15.1.1 Brazil
- 15.1.2 Argentina
- 15.1.3 Rest of South America
- 16. Competitive Analysis
- 16.1. Global Market Share Analysis 2024
- 16.2. Company Profiles
- 16.2.1 Sequent Scientific Ltd (Alivira Animal Health Limited)
- 16.2.1.1. Overview
- 16.2.1.2. Products
- 16.2.1.3. SWOT Analysis
- 16.2.1.4. Recent Developments
- 16.2.1.5. Financials (Based on Availability)
- 16.2.2 AMGIS Lifescience Ltd
- 16.2.2.1. Overview
- 16.2.2.2. Products
- 16.2.2.3. SWOT Analysis
- 16.2.2.4. Recent Developments
- 16.2.2.5. Financials (Based on Availability)
- 16.2.3 FIS - Fabbrica Italiana Sintetici S p A
- 16.2.3.1. Overview
- 16.2.3.2. Products
- 16.2.3.3. SWOT Analysis
- 16.2.3.4. Recent Developments
- 16.2.3.5. Financials (Based on Availability)
- 16.2.4 Menadiona
- 16.2.4.1. Overview
- 16.2.4.2. Products
- 16.2.4.3. SWOT Analysis
- 16.2.4.4. Recent Developments
- 16.2.4.5. Financials (Based on Availability)
- 16.2.5 Sidhiv Pharma
- 16.2.5.1. Overview
- 16.2.5.2. Products
- 16.2.5.3. SWOT Analysis
- 16.2.5.4. Recent Developments
- 16.2.5.5. Financials (Based on Availability)
- 16.2.6 NGL Fine-Chem Ltd
- 16.2.6.1. Overview
- 16.2.6.2. Products
- 16.2.6.3. SWOT Analysis
- 16.2.6.4. Recent Developments
- 16.2.6.5. Financials (Based on Availability)
- 16.2.7 Grupo Indukern S L
- 16.2.7.1. Overview
- 16.2.7.2. Products
- 16.2.7.3. SWOT Analysis
- 16.2.7.4. Recent Developments
- 16.2.7.5. Financials (Based on Availability)
- 16.2.8 Chempro Pharma Private Limited
- 16.2.8.1. Overview
- 16.2.8.2. Products
- 16.2.8.3. SWOT Analysis
- 16.2.8.4. Recent Developments
- 16.2.8.5. Financials (Based on Availability)
- 16.2.9 SUANFARMA
- 16.2.9.1. Overview
- 16.2.9.2. Products
- 16.2.9.3. SWOT Analysis
- 16.2.9.4. Recent Developments
- 16.2.9.5. Financials (Based on Availability)
- 16.2.10 Stanley Black & Decker (Excel Industries Limited)
- 16.2.10.1. Overview
- 16.2.10.2. Products
- 16.2.10.3. SWOT Analysis
- 16.2.10.4. Recent Developments
- 16.2.10.5. Financials (Based on Availability)
- 16.2.11 Ofichem Group
- 16.2.11.1. Overview
- 16.2.11.2. Products
- 16.2.11.3. SWOT Analysis
- 16.2.11.4. Recent Developments
- 16.2.11.5. Financials (Based on Availability)
- 16.2.1 Sequent Scientific Ltd (Alivira Animal Health Limited)
List of Figures
- Figure 1: Global API Veterinary Industry Revenue Breakdown (Million, %) by Region 2024 & 2032
- Figure 2: North America API Veterinary Industry Revenue (Million), by Country 2024 & 2032
- Figure 3: North America API Veterinary Industry Revenue Share (%), by Country 2024 & 2032
- Figure 4: Europe API Veterinary Industry Revenue (Million), by Country 2024 & 2032
- Figure 5: Europe API Veterinary Industry Revenue Share (%), by Country 2024 & 2032
- Figure 6: Asia Pacific API Veterinary Industry Revenue (Million), by Country 2024 & 2032
- Figure 7: Asia Pacific API Veterinary Industry Revenue Share (%), by Country 2024 & 2032
- Figure 8: Middle East and Africa API Veterinary Industry Revenue (Million), by Country 2024 & 2032
- Figure 9: Middle East and Africa API Veterinary Industry Revenue Share (%), by Country 2024 & 2032
- Figure 10: South America API Veterinary Industry Revenue (Million), by Country 2024 & 2032
- Figure 11: South America API Veterinary Industry Revenue Share (%), by Country 2024 & 2032
- Figure 12: North America API Veterinary Industry Revenue (Million), by Product 2024 & 2032
- Figure 13: North America API Veterinary Industry Revenue Share (%), by Product 2024 & 2032
- Figure 14: North America API Veterinary Industry Revenue (Million), by Synthesis Type 2024 & 2032
- Figure 15: North America API Veterinary Industry Revenue Share (%), by Synthesis Type 2024 & 2032
- Figure 16: North America API Veterinary Industry Revenue (Million), by Service Type 2024 & 2032
- Figure 17: North America API Veterinary Industry Revenue Share (%), by Service Type 2024 & 2032
- Figure 18: North America API Veterinary Industry Revenue (Million), by Country 2024 & 2032
- Figure 19: North America API Veterinary Industry Revenue Share (%), by Country 2024 & 2032
- Figure 20: Europe API Veterinary Industry Revenue (Million), by Product 2024 & 2032
- Figure 21: Europe API Veterinary Industry Revenue Share (%), by Product 2024 & 2032
- Figure 22: Europe API Veterinary Industry Revenue (Million), by Synthesis Type 2024 & 2032
- Figure 23: Europe API Veterinary Industry Revenue Share (%), by Synthesis Type 2024 & 2032
- Figure 24: Europe API Veterinary Industry Revenue (Million), by Service Type 2024 & 2032
- Figure 25: Europe API Veterinary Industry Revenue Share (%), by Service Type 2024 & 2032
- Figure 26: Europe API Veterinary Industry Revenue (Million), by Country 2024 & 2032
- Figure 27: Europe API Veterinary Industry Revenue Share (%), by Country 2024 & 2032
- Figure 28: Asia Pacific API Veterinary Industry Revenue (Million), by Product 2024 & 2032
- Figure 29: Asia Pacific API Veterinary Industry Revenue Share (%), by Product 2024 & 2032
- Figure 30: Asia Pacific API Veterinary Industry Revenue (Million), by Synthesis Type 2024 & 2032
- Figure 31: Asia Pacific API Veterinary Industry Revenue Share (%), by Synthesis Type 2024 & 2032
- Figure 32: Asia Pacific API Veterinary Industry Revenue (Million), by Service Type 2024 & 2032
- Figure 33: Asia Pacific API Veterinary Industry Revenue Share (%), by Service Type 2024 & 2032
- Figure 34: Asia Pacific API Veterinary Industry Revenue (Million), by Country 2024 & 2032
- Figure 35: Asia Pacific API Veterinary Industry Revenue Share (%), by Country 2024 & 2032
- Figure 36: Middle East and Africa API Veterinary Industry Revenue (Million), by Product 2024 & 2032
- Figure 37: Middle East and Africa API Veterinary Industry Revenue Share (%), by Product 2024 & 2032
- Figure 38: Middle East and Africa API Veterinary Industry Revenue (Million), by Synthesis Type 2024 & 2032
- Figure 39: Middle East and Africa API Veterinary Industry Revenue Share (%), by Synthesis Type 2024 & 2032
- Figure 40: Middle East and Africa API Veterinary Industry Revenue (Million), by Service Type 2024 & 2032
- Figure 41: Middle East and Africa API Veterinary Industry Revenue Share (%), by Service Type 2024 & 2032
- Figure 42: Middle East and Africa API Veterinary Industry Revenue (Million), by Country 2024 & 2032
- Figure 43: Middle East and Africa API Veterinary Industry Revenue Share (%), by Country 2024 & 2032
- Figure 44: South America API Veterinary Industry Revenue (Million), by Product 2024 & 2032
- Figure 45: South America API Veterinary Industry Revenue Share (%), by Product 2024 & 2032
- Figure 46: South America API Veterinary Industry Revenue (Million), by Synthesis Type 2024 & 2032
- Figure 47: South America API Veterinary Industry Revenue Share (%), by Synthesis Type 2024 & 2032
- Figure 48: South America API Veterinary Industry Revenue (Million), by Service Type 2024 & 2032
- Figure 49: South America API Veterinary Industry Revenue Share (%), by Service Type 2024 & 2032
- Figure 50: South America API Veterinary Industry Revenue (Million), by Country 2024 & 2032
- Figure 51: South America API Veterinary Industry Revenue Share (%), by Country 2024 & 2032
List of Tables
- Table 1: Global API Veterinary Industry Revenue Million Forecast, by Region 2019 & 2032
- Table 2: Global API Veterinary Industry Revenue Million Forecast, by Product 2019 & 2032
- Table 3: Global API Veterinary Industry Revenue Million Forecast, by Synthesis Type 2019 & 2032
- Table 4: Global API Veterinary Industry Revenue Million Forecast, by Service Type 2019 & 2032
- Table 5: Global API Veterinary Industry Revenue Million Forecast, by Region 2019 & 2032
- Table 6: Global API Veterinary Industry Revenue Million Forecast, by Country 2019 & 2032
- Table 7: United States API Veterinary Industry Revenue (Million) Forecast, by Application 2019 & 2032
- Table 8: Canada API Veterinary Industry Revenue (Million) Forecast, by Application 2019 & 2032
- Table 9: Mexico API Veterinary Industry Revenue (Million) Forecast, by Application 2019 & 2032
- Table 10: Global API Veterinary Industry Revenue Million Forecast, by Country 2019 & 2032
- Table 11: Germany API Veterinary Industry Revenue (Million) Forecast, by Application 2019 & 2032
- Table 12: United Kingdom API Veterinary Industry Revenue (Million) Forecast, by Application 2019 & 2032
- Table 13: France API Veterinary Industry Revenue (Million) Forecast, by Application 2019 & 2032
- Table 14: Italy API Veterinary Industry Revenue (Million) Forecast, by Application 2019 & 2032
- Table 15: Spain API Veterinary Industry Revenue (Million) Forecast, by Application 2019 & 2032
- Table 16: Rest of Europe API Veterinary Industry Revenue (Million) Forecast, by Application 2019 & 2032
- Table 17: Global API Veterinary Industry Revenue Million Forecast, by Country 2019 & 2032
- Table 18: China API Veterinary Industry Revenue (Million) Forecast, by Application 2019 & 2032
- Table 19: Japan API Veterinary Industry Revenue (Million) Forecast, by Application 2019 & 2032
- Table 20: India API Veterinary Industry Revenue (Million) Forecast, by Application 2019 & 2032
- Table 21: Australia API Veterinary Industry Revenue (Million) Forecast, by Application 2019 & 2032
- Table 22: South Korea API Veterinary Industry Revenue (Million) Forecast, by Application 2019 & 2032
- Table 23: Rest of Asia Pacific API Veterinary Industry Revenue (Million) Forecast, by Application 2019 & 2032
- Table 24: Global API Veterinary Industry Revenue Million Forecast, by Country 2019 & 2032
- Table 25: GCC API Veterinary Industry Revenue (Million) Forecast, by Application 2019 & 2032
- Table 26: South Africa API Veterinary Industry Revenue (Million) Forecast, by Application 2019 & 2032
- Table 27: Rest of Middle East and Africa API Veterinary Industry Revenue (Million) Forecast, by Application 2019 & 2032
- Table 28: Global API Veterinary Industry Revenue Million Forecast, by Country 2019 & 2032
- Table 29: Brazil API Veterinary Industry Revenue (Million) Forecast, by Application 2019 & 2032
- Table 30: Argentina API Veterinary Industry Revenue (Million) Forecast, by Application 2019 & 2032
- Table 31: Rest of South America API Veterinary Industry Revenue (Million) Forecast, by Application 2019 & 2032
- Table 32: Global API Veterinary Industry Revenue Million Forecast, by Product 2019 & 2032
- Table 33: Global API Veterinary Industry Revenue Million Forecast, by Synthesis Type 2019 & 2032
- Table 34: Global API Veterinary Industry Revenue Million Forecast, by Service Type 2019 & 2032
- Table 35: Global API Veterinary Industry Revenue Million Forecast, by Country 2019 & 2032
- Table 36: United States API Veterinary Industry Revenue (Million) Forecast, by Application 2019 & 2032
- Table 37: Canada API Veterinary Industry Revenue (Million) Forecast, by Application 2019 & 2032
- Table 38: Mexico API Veterinary Industry Revenue (Million) Forecast, by Application 2019 & 2032
- Table 39: Global API Veterinary Industry Revenue Million Forecast, by Product 2019 & 2032
- Table 40: Global API Veterinary Industry Revenue Million Forecast, by Synthesis Type 2019 & 2032
- Table 41: Global API Veterinary Industry Revenue Million Forecast, by Service Type 2019 & 2032
- Table 42: Global API Veterinary Industry Revenue Million Forecast, by Country 2019 & 2032
- Table 43: Germany API Veterinary Industry Revenue (Million) Forecast, by Application 2019 & 2032
- Table 44: United Kingdom API Veterinary Industry Revenue (Million) Forecast, by Application 2019 & 2032
- Table 45: France API Veterinary Industry Revenue (Million) Forecast, by Application 2019 & 2032
- Table 46: Italy API Veterinary Industry Revenue (Million) Forecast, by Application 2019 & 2032
- Table 47: Spain API Veterinary Industry Revenue (Million) Forecast, by Application 2019 & 2032
- Table 48: Rest of Europe API Veterinary Industry Revenue (Million) Forecast, by Application 2019 & 2032
- Table 49: Global API Veterinary Industry Revenue Million Forecast, by Product 2019 & 2032
- Table 50: Global API Veterinary Industry Revenue Million Forecast, by Synthesis Type 2019 & 2032
- Table 51: Global API Veterinary Industry Revenue Million Forecast, by Service Type 2019 & 2032
- Table 52: Global API Veterinary Industry Revenue Million Forecast, by Country 2019 & 2032
- Table 53: China API Veterinary Industry Revenue (Million) Forecast, by Application 2019 & 2032
- Table 54: Japan API Veterinary Industry Revenue (Million) Forecast, by Application 2019 & 2032
- Table 55: India API Veterinary Industry Revenue (Million) Forecast, by Application 2019 & 2032
- Table 56: Australia API Veterinary Industry Revenue (Million) Forecast, by Application 2019 & 2032
- Table 57: South Korea API Veterinary Industry Revenue (Million) Forecast, by Application 2019 & 2032
- Table 58: Rest of Asia Pacific API Veterinary Industry Revenue (Million) Forecast, by Application 2019 & 2032
- Table 59: Global API Veterinary Industry Revenue Million Forecast, by Product 2019 & 2032
- Table 60: Global API Veterinary Industry Revenue Million Forecast, by Synthesis Type 2019 & 2032
- Table 61: Global API Veterinary Industry Revenue Million Forecast, by Service Type 2019 & 2032
- Table 62: Global API Veterinary Industry Revenue Million Forecast, by Country 2019 & 2032
- Table 63: GCC API Veterinary Industry Revenue (Million) Forecast, by Application 2019 & 2032
- Table 64: South Africa API Veterinary Industry Revenue (Million) Forecast, by Application 2019 & 2032
- Table 65: Rest of Middle East and Africa API Veterinary Industry Revenue (Million) Forecast, by Application 2019 & 2032
- Table 66: Global API Veterinary Industry Revenue Million Forecast, by Product 2019 & 2032
- Table 67: Global API Veterinary Industry Revenue Million Forecast, by Synthesis Type 2019 & 2032
- Table 68: Global API Veterinary Industry Revenue Million Forecast, by Service Type 2019 & 2032
- Table 69: Global API Veterinary Industry Revenue Million Forecast, by Country 2019 & 2032
- Table 70: Brazil API Veterinary Industry Revenue (Million) Forecast, by Application 2019 & 2032
- Table 71: Argentina API Veterinary Industry Revenue (Million) Forecast, by Application 2019 & 2032
- Table 72: Rest of South America API Veterinary Industry Revenue (Million) Forecast, by Application 2019 & 2032
Frequently Asked Questions
1. What is the projected Compound Annual Growth Rate (CAGR) of the API Veterinary Industry?
The projected CAGR is approximately 7.10%.
2. Which companies are prominent players in the API Veterinary Industry?
Key companies in the market include Sequent Scientific Ltd (Alivira Animal Health Limited), AMGIS Lifescience Ltd, FIS - Fabbrica Italiana Sintetici S p A, Menadiona, Sidhiv Pharma, NGL Fine-Chem Ltd, Grupo Indukern S L, Chempro Pharma Private Limited, SUANFARMA, Stanley Black & Decker (Excel Industries Limited), Ofichem Group.
3. What are the main segments of the API Veterinary Industry?
The market segments include Product, Synthesis Type, Service Type.
4. Can you provide details about the market size?
The market size is estimated to be USD 7.24 Million as of 2022.
5. What are some drivers contributing to market growth?
Increasing Prevalence of Zoonotic Diseases; Increasing Animal Population And Pet Ownership; Rising Number of Veterinarians and Veterinary Visits.
6. What are the notable trends driving market growth?
The Vaccines Segment is Expected to Hold a Significant Market Share in the Veterinary Active Pharmaceutical Ingredients Manufacturing Market.
7. Are there any restraints impacting market growth?
Lack of Awareness and High Cost of Animal Care; Stringent Government Regulations.
8. Can you provide examples of recent developments in the market?
In November 2022, SeQuent Scientific Limited (SeQuent), India's animal health company with a strong presence in veterinary formulations and APIs, signed a definitive agreement to acquire a 100% stake in Tineta Pharma Private Limited (Tineta), a company incorporated in India.
9. What pricing options are available for accessing the report?
Pricing options include single-user, multi-user, and enterprise licenses priced at USD 4750, USD 5250, and USD 8750 respectively.
10. Is the market size provided in terms of value or volume?
The market size is provided in terms of value, measured in Million.
11. Are there any specific market keywords associated with the report?
Yes, the market keyword associated with the report is "API Veterinary Industry," which aids in identifying and referencing the specific market segment covered.
12. How do I determine which pricing option suits my needs best?
The pricing options vary based on user requirements and access needs. Individual users may opt for single-user licenses, while businesses requiring broader access may choose multi-user or enterprise licenses for cost-effective access to the report.
13. Are there any additional resources or data provided in the API Veterinary Industry report?
While the report offers comprehensive insights, it's advisable to review the specific contents or supplementary materials provided to ascertain if additional resources or data are available.
14. How can I stay updated on further developments or reports in the API Veterinary Industry?
To stay informed about further developments, trends, and reports in the API Veterinary Industry, consider subscribing to industry newsletters, following relevant companies and organizations, or regularly checking reputable industry news sources and publications.
Methodology
Step 1 - Identification of Relevant Samples Size from Population Database


Step 2 - Approaches for Defining Global Market Size (Value, Volume* & Price*)

Note*: In applicable scenarios
Step 3 - Data Sources
Primary Research
- Web Analytics
- Survey Reports
- Research Institute
- Latest Research Reports
- Opinion Leaders
Secondary Research
- Annual Reports
- White Paper
- Latest Press Release
- Industry Association
- Paid Database
- Investor Presentations

Step 4 - Data Triangulation
Involves using different sources of information in order to increase the validity of a study
These sources are likely to be stakeholders in a program - participants, other researchers, program staff, other community members, and so on.
Then we put all data in single framework & apply various statistical tools to find out the dynamic on the market.
During the analysis stage, feedback from the stakeholder groups would be compared to determine areas of agreement as well as areas of divergence
