

Key Insights
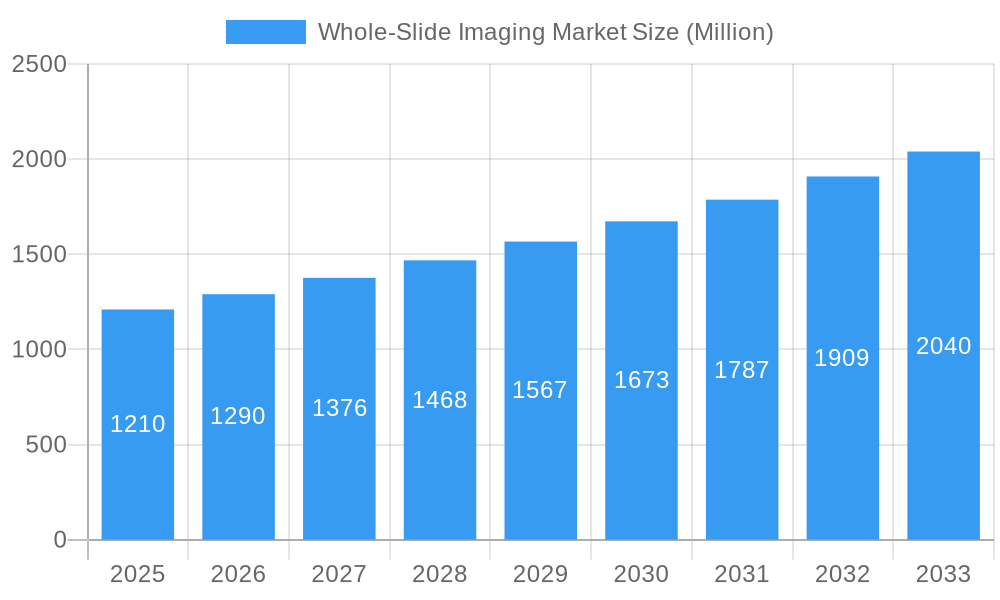
The whole-slide imaging (WSI) market, valued at $1.21 billion in 2025, is projected to experience robust growth, driven by the increasing adoption of digital pathology in healthcare. This shift is fueled by several factors: the demand for improved diagnostic accuracy and efficiency, the rising prevalence of chronic diseases requiring extensive pathological analysis, and the growing need for remote diagnostics and telepathology services. Technological advancements, such as the development of higher-resolution scanners, sophisticated image management systems, and AI-powered diagnostic tools, are further propelling market expansion. The integration of WSI into routine workflows is streamlining processes, reducing turnaround times, and enabling better collaboration among pathologists, regardless of geographical location. Significant growth is anticipated in regions like North America and Europe, where advanced healthcare infrastructure and robust regulatory frameworks support the adoption of innovative technologies. However, high initial investment costs associated with WSI implementation and the need for specialized training for pathologists could act as potential restraints on market growth, particularly in developing economies. The market segmentation highlights the strong demand across various applications, including telepathology, cytopathology, and immunohistochemistry, with significant contributions from academic institutes and research institutions. The competitive landscape comprises a mix of established players and emerging companies, each focusing on innovation and market penetration through strategic partnerships and product development. The forecasted CAGR of 6.39% suggests a continuously expanding market throughout the forecast period.
Whole-Slide Imaging Market Market Size (In Billion)
The long-term outlook for the WSI market remains positive, projecting substantial growth through 2033. The increasing integration of artificial intelligence (AI) and machine learning (ML) into WSI systems is expected to significantly impact the market. AI-powered diagnostic tools offer the potential for improved diagnostic accuracy, reduced human error, and faster turnaround times, making WSI an even more attractive solution for pathology laboratories. Furthermore, the growing focus on personalized medicine and the development of companion diagnostics will further drive demand for WSI systems capable of analyzing complex datasets and facilitating precise treatment decisions. Continued technological advancements, coupled with increasing awareness of the benefits of digital pathology among healthcare providers, are poised to accelerate market growth in the coming years, leading to wider adoption across various healthcare settings globally.
Whole-Slide Imaging Market Company Market Share
Whole-Slide Imaging Market: A Comprehensive Report (2019-2033)
This comprehensive report provides a detailed analysis of the Whole-Slide Imaging market, encompassing market dynamics, growth trends, regional segmentation, product landscape, key players, and future outlook. The study period covers 2019-2033, with 2025 as the base and estimated year. The report meticulously examines the parent market (Digital Pathology) and its child market (Whole-Slide Imaging), offering granular insights for informed decision-making. The market is segmented by technology (Scanners, IT Infrastructure, Viewer, Image Management System), application (Telepathology, Cytopathology, Immunohistochemistry, Hematopathology), and end-user (Academic Institute, Research, Others). The projected market value in 2033 is estimated to be xx Million.
Whole-Slide Imaging Market Market Dynamics & Structure
The Whole-Slide Imaging market is characterized by moderate concentration, with key players holding significant market share but facing increasing competition from smaller, innovative companies. Technological innovation, particularly in AI-powered image analysis and cloud-based solutions, is a major driver of market growth. Regulatory frameworks, varying across regions, influence adoption rates and market access. The market also witnesses considerable M&A activity, reflecting consolidation and strategic expansion. Competitive substitutes include traditional microscopy techniques, but the advantages of whole-slide imaging in terms of efficiency and analysis capabilities are driving market shift. End-user demographics are evolving, with increasing adoption by research institutions, hospitals, and pharmaceutical companies.
- Market Concentration: Moderately concentrated, with top 5 players holding approximately xx% market share in 2024.
- Technological Innovation: AI-powered image analysis, cloud-based solutions, and improved scanner technology are key drivers.
- Regulatory Landscape: Varying regulatory approvals across geographies influence market penetration.
- M&A Activity: Significant M&A activity observed in the historical period (2019-2024), with approximately xx deals recorded. This trend is expected to continue.
- Innovation Barriers: High initial investment costs for equipment and software can pose a barrier to entry for smaller players.
Whole-Slide Imaging Market Growth Trends & Insights
The Whole-Slide Imaging market experienced significant growth during the historical period (2019-2024), with a CAGR of xx%. This growth is attributed to several factors, including increasing adoption of digital pathology, rising prevalence of chronic diseases, technological advancements, and growing demand for efficient and accurate diagnostic tools. The market is expected to continue its growth trajectory during the forecast period (2025-2033), driven by factors such as increased investment in research and development, expanding applications in various fields (e.g., oncology, pathology), and the growing adoption of telepathology. Market penetration is expected to reach xx% by 2033, particularly in developed regions. Consumer behavior shifts towards advanced diagnostic tools are further fueling market expansion. Technological disruptions, such as AI-assisted diagnosis, are accelerating market transformation and enhancing diagnostic capabilities.
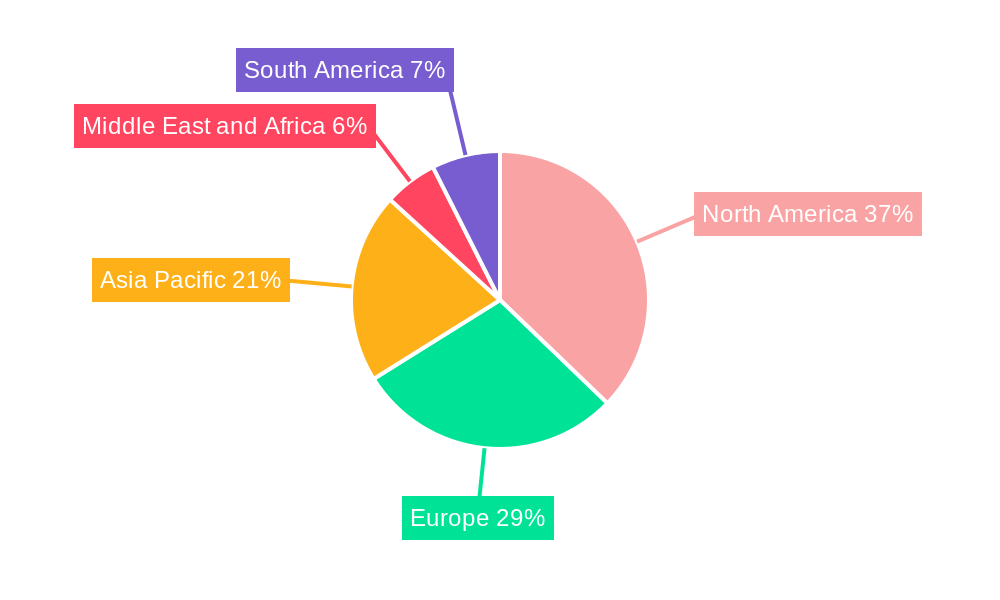
Dominant Regions, Countries, or Segments in Whole-Slide Imaging Market
North America currently dominates the Whole-Slide Imaging market, driven by high healthcare expenditure, advanced infrastructure, and early adoption of new technologies. However, the Asia-Pacific region is projected to experience the fastest growth rate during the forecast period due to increasing healthcare investments, rising prevalence of chronic diseases, and a growing middle class. Within the segments, the Scanners segment holds the largest market share, followed by Image Management Systems. The Telepathology application segment is demonstrating high growth potential due to increasing demand for remote diagnostic capabilities.
- Key Drivers (North America): High healthcare expenditure, advanced infrastructure, strong regulatory support.
- Key Drivers (Asia-Pacific): Rising healthcare investments, increasing prevalence of chronic diseases, growing middle class.
- Segment Dominance: Scanners (xx% market share in 2024), followed by Image Management Systems. Telepathology showing fastest growth among applications.
Whole-Slide Imaging Market Product Landscape
The Whole-Slide Imaging market offers a diverse range of products, including high-resolution scanners, advanced image management software, and specialized viewing platforms. Recent innovations focus on improving image quality, enhancing analysis capabilities through AI, and integrating cloud-based solutions for seamless data sharing and remote access. Products are differentiated based on resolution, speed, ease of use, and integration capabilities. Unique selling propositions often include advanced features like automated slide scanning, AI-driven diagnostics, and secure data management platforms.
Key Drivers, Barriers & Challenges in Whole-Slide Imaging Market
Key Drivers: The increasing adoption of digital pathology, the growing demand for accurate and efficient diagnostic tools, and advancements in AI and machine learning are propelling market growth. The need for improved healthcare infrastructure and remote diagnostic capabilities also contribute significantly.
Challenges: High initial investment costs, complexity of integration with existing laboratory workflows, and the need for skilled personnel to operate and interpret the images are significant hurdles. Regulatory hurdles related to data security and privacy also pose challenges, along with competitive pressure from established players and emerging innovative technologies. Supply chain disruptions can impact the availability of components needed for scanner manufacturing, potentially leading to delays and increased costs (estimated impact: xx% on market growth in 2024).
Emerging Opportunities in Whole-Slide Imaging Market
Untapped markets in developing countries present significant growth opportunities. The integration of AI and machine learning for automated image analysis opens new avenues for faster and more accurate diagnoses. The rising demand for personalized medicine and the expansion of telepathology create further opportunities for market expansion. The development of cost-effective and user-friendly whole-slide imaging solutions can expand market reach.
Growth Accelerators in the Whole-Slide Imaging Market Industry
Technological advancements such as improved image resolution, faster scanning speeds, and AI-powered image analysis are driving market expansion. Strategic partnerships between technology providers, healthcare institutions, and research organizations are accelerating market adoption. The expansion of telepathology services and the development of cloud-based platforms are further accelerating growth.
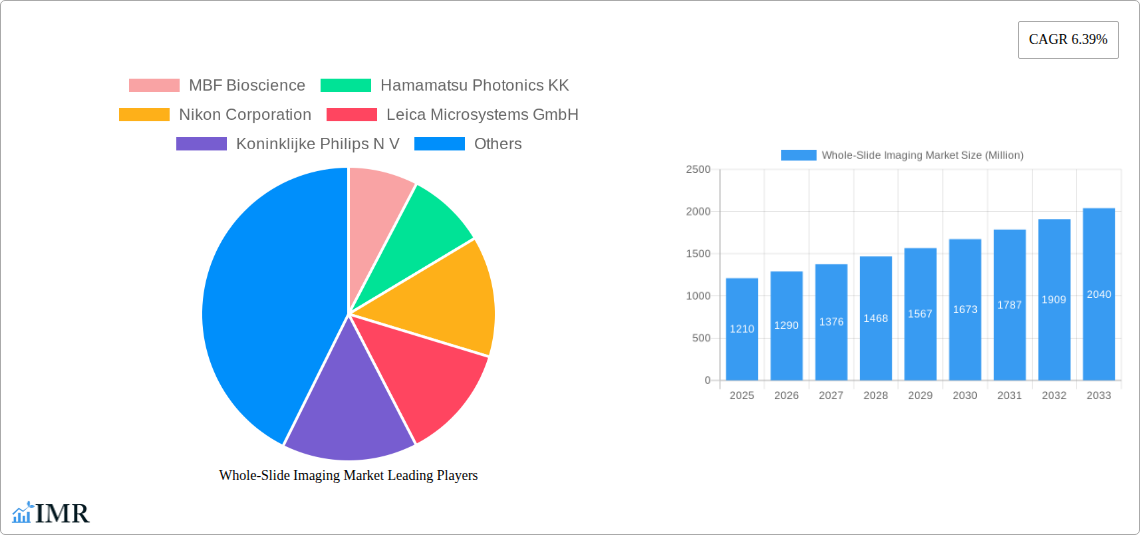
Key Players Shaping the Whole-Slide Imaging Market Market
- MBF Bioscience
- Hamamatsu Photonics KK
- Nikon Corporation
- Leica Microsystems GmbH
- Koninklijke Philips N V
- 3Dhistech
- Visiopharm
- Indica Labs
- Molecular Machines & Industries
- Mikroscan Technologies Inc
- Olympus Corporation
- Akoya Biosciences
Notable Milestones in Whole-Slide Imaging Market Sector
- March 2023: Pramana, Inc. partnered with PathPresenter to accelerate enterprise adoption of digital pathology workflows.
- March 2023: Hamamatsu entered a multi-year distribution agreement with Siemens Healthineers for NanoZoomer whole-slide scanners.
In-Depth Whole-Slide Imaging Market Market Outlook
The Whole-Slide Imaging market is poised for substantial growth driven by technological innovations, increasing adoption of digital pathology, and expanding applications across various healthcare settings. Strategic partnerships and market expansion into untapped regions will further propel market growth. The integration of AI and machine learning will redefine diagnostic capabilities, fostering a future where whole-slide imaging plays a pivotal role in personalized and preventive medicine. The market's future potential is substantial, presenting significant opportunities for both established and emerging players.
Whole-Slide Imaging Market Segmentation
-
1. Technology
- 1.1. Scanners
- 1.2. IT Infrastructure
- 1.3. Viewer
- 1.4. Image Management System
-
2. Application
- 2.1. Telepathology
- 2.2. Cytopathology
- 2.3. Immunohistochemistry
- 2.4. Hematopathology
-
3. End User
- 3.1. Academic Institute
- 3.2. Research
- 3.3. Others
Whole-Slide Imaging Market Segmentation By Geography
-
1. North America
- 1.1. United States
- 1.2. Canada
- 1.3. Mexico
-
2. Europe
- 2.1. Germany
- 2.2. United Kingdom
- 2.3. France
- 2.4. Italy
- 2.5. Spain
- 2.6. Rest of Europe
-
3. Asia Pacific
- 3.1. China
- 3.2. Japan
- 3.3. India
- 3.4. Australia
- 3.5. South korea
- 3.6. Rest of Asia Pacific
-
4. Middle East and Africa
- 4.1. GCC
- 4.2. South Africa
- 4.3. Rest of Middle East and Africa
-
5. South America
- 5.1. Brazil
- 5.2. Argentina
- 5.3. Rest of South America
Whole-Slide Imaging Market Regional Market Share
Geographic Coverage of Whole-Slide Imaging Market
Whole-Slide Imaging Market REPORT HIGHLIGHTS
| Aspects | Details |
|---|---|
| Study Period | 2020-2034 |
| Base Year | 2025 |
| Estimated Year | 2026 |
| Forecast Period | 2026-2034 |
| Historical Period | 2020-2025 |
| Growth Rate | CAGR of 6.39% from 2020-2034 |
| Segmentation |
|
Table of Contents
- 1. Introduction
- 1.1. Research Scope
- 1.2. Market Segmentation
- 1.3. Research Objective
- 1.4. Definitions and Assumptions
- 2. Executive Summary
- 2.1. Market Snapshot
- 3. Market Dynamics
- 3.1. Market Drivers
- 3.2. Market Restrains
- 3.3. Market Trends
- 3.4. Market Opportunities
- 4. Market Factor Analysis
- 4.1. Porters Five Forces
- 4.1.1. Bargaining Power of Suppliers
- 4.1.2. Bargaining Power of Buyers
- 4.1.3. Threat of New Entrants
- 4.1.4. Threat of Substitutes
- 4.1.5. Competitive Rivalry
- 4.2. PESTEL analysis
- 4.3. BCG Analysis
- 4.3.1. Stars (High Growth, High Market Share)
- 4.3.2. Cash Cows (Low Growth, High Market Share)
- 4.3.3. Question Mark (High Growth, Low Market Share)
- 4.3.4. Dogs (Low Growth, Low Market Share)
- 4.4. Ansoff Matrix Analysis
- 4.5. Supply Chain Analysis
- 4.6. Regulatory Landscape
- 4.7. Current Market Potential and Opportunity Assessment (TAM–SAM–SOM Framework)
- 4.8. IMR Analyst Note
- 4.1. Porters Five Forces
- 5. Market Analysis, Insights and Forecast 2021-2033
- 5.1. Market Analysis, Insights and Forecast - by Technology
- 5.1.1. Scanners
- 5.1.2. IT Infrastructure
- 5.1.3. Viewer
- 5.1.4. Image Management System
- 5.2. Market Analysis, Insights and Forecast - by Application
- 5.2.1. Telepathology
- 5.2.2. Cytopathology
- 5.2.3. Immunohistochemistry
- 5.2.4. Hematopathology
- 5.3. Market Analysis, Insights and Forecast - by End User
- 5.3.1. Academic Institute
- 5.3.2. Research
- 5.3.3. Others
- 5.4. Market Analysis, Insights and Forecast - by Region
- 5.4.1. North America
- 5.4.2. Europe
- 5.4.3. Asia Pacific
- 5.4.4. Middle East and Africa
- 5.4.5. South America
- 5.1. Market Analysis, Insights and Forecast - by Technology
- 6. Global Whole-Slide Imaging Market Analysis, Insights and Forecast, 2021-2033
- 6.1. Market Analysis, Insights and Forecast - by Technology
- 6.1.1. Scanners
- 6.1.2. IT Infrastructure
- 6.1.3. Viewer
- 6.1.4. Image Management System
- 6.2. Market Analysis, Insights and Forecast - by Application
- 6.2.1. Telepathology
- 6.2.2. Cytopathology
- 6.2.3. Immunohistochemistry
- 6.2.4. Hematopathology
- 6.3. Market Analysis, Insights and Forecast - by End User
- 6.3.1. Academic Institute
- 6.3.2. Research
- 6.3.3. Others
- 6.1. Market Analysis, Insights and Forecast - by Technology
- 7. North America Whole-Slide Imaging Market Analysis, Insights and Forecast, 2020-2032
- 7.1. Market Analysis, Insights and Forecast - by Technology
- 7.1.1. Scanners
- 7.1.2. IT Infrastructure
- 7.1.3. Viewer
- 7.1.4. Image Management System
- 7.2. Market Analysis, Insights and Forecast - by Application
- 7.2.1. Telepathology
- 7.2.2. Cytopathology
- 7.2.3. Immunohistochemistry
- 7.2.4. Hematopathology
- 7.3. Market Analysis, Insights and Forecast - by End User
- 7.3.1. Academic Institute
- 7.3.2. Research
- 7.3.3. Others
- 7.1. Market Analysis, Insights and Forecast - by Technology
- 8. Europe Whole-Slide Imaging Market Analysis, Insights and Forecast, 2020-2032
- 8.1. Market Analysis, Insights and Forecast - by Technology
- 8.1.1. Scanners
- 8.1.2. IT Infrastructure
- 8.1.3. Viewer
- 8.1.4. Image Management System
- 8.2. Market Analysis, Insights and Forecast - by Application
- 8.2.1. Telepathology
- 8.2.2. Cytopathology
- 8.2.3. Immunohistochemistry
- 8.2.4. Hematopathology
- 8.3. Market Analysis, Insights and Forecast - by End User
- 8.3.1. Academic Institute
- 8.3.2. Research
- 8.3.3. Others
- 8.1. Market Analysis, Insights and Forecast - by Technology
- 9. Asia Pacific Whole-Slide Imaging Market Analysis, Insights and Forecast, 2020-2032
- 9.1. Market Analysis, Insights and Forecast - by Technology
- 9.1.1. Scanners
- 9.1.2. IT Infrastructure
- 9.1.3. Viewer
- 9.1.4. Image Management System
- 9.2. Market Analysis, Insights and Forecast - by Application
- 9.2.1. Telepathology
- 9.2.2. Cytopathology
- 9.2.3. Immunohistochemistry
- 9.2.4. Hematopathology
- 9.3. Market Analysis, Insights and Forecast - by End User
- 9.3.1. Academic Institute
- 9.3.2. Research
- 9.3.3. Others
- 9.1. Market Analysis, Insights and Forecast - by Technology
- 10. Middle East and Africa Whole-Slide Imaging Market Analysis, Insights and Forecast, 2020-2032
- 10.1. Market Analysis, Insights and Forecast - by Technology
- 10.1.1. Scanners
- 10.1.2. IT Infrastructure
- 10.1.3. Viewer
- 10.1.4. Image Management System
- 10.2. Market Analysis, Insights and Forecast - by Application
- 10.2.1. Telepathology
- 10.2.2. Cytopathology
- 10.2.3. Immunohistochemistry
- 10.2.4. Hematopathology
- 10.3. Market Analysis, Insights and Forecast - by End User
- 10.3.1. Academic Institute
- 10.3.2. Research
- 10.3.3. Others
- 10.1. Market Analysis, Insights and Forecast - by Technology
- 11. South America Whole-Slide Imaging Market Analysis, Insights and Forecast, 2020-2032
- 11.1. Market Analysis, Insights and Forecast - by Technology
- 11.1.1. Scanners
- 11.1.2. IT Infrastructure
- 11.1.3. Viewer
- 11.1.4. Image Management System
- 11.2. Market Analysis, Insights and Forecast - by Application
- 11.2.1. Telepathology
- 11.2.2. Cytopathology
- 11.2.3. Immunohistochemistry
- 11.2.4. Hematopathology
- 11.3. Market Analysis, Insights and Forecast - by End User
- 11.3.1. Academic Institute
- 11.3.2. Research
- 11.3.3. Others
- 11.1. Market Analysis, Insights and Forecast - by Technology
- 12. Competitive Analysis
- 12.1. Company Profiles
- 12.1.1 MBF Bioscience
- 12.1.1.1. Company Overview
- 12.1.1.2. Products
- 12.1.1.3. Company Financials
- 12.1.1.4. SWOT Analysis
- 12.1.2 Hamamatsu Photonics KK
- 12.1.2.1. Company Overview
- 12.1.2.2. Products
- 12.1.2.3. Company Financials
- 12.1.2.4. SWOT Analysis
- 12.1.3 Nikon Corporation
- 12.1.3.1. Company Overview
- 12.1.3.2. Products
- 12.1.3.3. Company Financials
- 12.1.3.4. SWOT Analysis
- 12.1.4 Leica Microsystems GmbH
- 12.1.4.1. Company Overview
- 12.1.4.2. Products
- 12.1.4.3. Company Financials
- 12.1.4.4. SWOT Analysis
- 12.1.5 Koninklijke Philips N V
- 12.1.5.1. Company Overview
- 12.1.5.2. Products
- 12.1.5.3. Company Financials
- 12.1.5.4. SWOT Analysis
- 12.1.6 3Dhistech
- 12.1.6.1. Company Overview
- 12.1.6.2. Products
- 12.1.6.3. Company Financials
- 12.1.6.4. SWOT Analysis
- 12.1.7 Visiopharm
- 12.1.7.1. Company Overview
- 12.1.7.2. Products
- 12.1.7.3. Company Financials
- 12.1.7.4. SWOT Analysis
- 12.1.8 Indica Labs
- 12.1.8.1. Company Overview
- 12.1.8.2. Products
- 12.1.8.3. Company Financials
- 12.1.8.4. SWOT Analysis
- 12.1.9 Molecular Machines & Industries
- 12.1.9.1. Company Overview
- 12.1.9.2. Products
- 12.1.9.3. Company Financials
- 12.1.9.4. SWOT Analysis
- 12.1.10 Mikroscan Technologies Inc
- 12.1.10.1. Company Overview
- 12.1.10.2. Products
- 12.1.10.3. Company Financials
- 12.1.10.4. SWOT Analysis
- 12.1.11 Olympus Corporation
- 12.1.11.1. Company Overview
- 12.1.11.2. Products
- 12.1.11.3. Company Financials
- 12.1.11.4. SWOT Analysis
- 12.1.12 Akoya Biosciences
- 12.1.12.1. Company Overview
- 12.1.12.2. Products
- 12.1.12.3. Company Financials
- 12.1.12.4. SWOT Analysis
- 12.1.1 MBF Bioscience
- 12.2. Market Entropy
- 12.2.1 Company's Key Areas Served
- 12.2.2 Recent Developments
- 12.3. Company Market Share Analysis 2025
- 12.3.1 Top 5 Companies Market Share Analysis
- 12.3.2 Top 3 Companies Market Share Analysis
- 12.4. List of Potential Customers
- 13. Research Methodology
List of Figures
- Figure 1: Global Whole-Slide Imaging Market Revenue Breakdown (Million, %) by Region 2025 & 2033
- Figure 2: Global Whole-Slide Imaging Market Volume Breakdown (K Unit, %) by Region 2025 & 2033
- Figure 3: North America Whole-Slide Imaging Market Revenue (Million), by Technology 2025 & 2033
- Figure 4: North America Whole-Slide Imaging Market Volume (K Unit), by Technology 2025 & 2033
- Figure 5: North America Whole-Slide Imaging Market Revenue Share (%), by Technology 2025 & 2033
- Figure 6: North America Whole-Slide Imaging Market Volume Share (%), by Technology 2025 & 2033
- Figure 7: North America Whole-Slide Imaging Market Revenue (Million), by Application 2025 & 2033
- Figure 8: North America Whole-Slide Imaging Market Volume (K Unit), by Application 2025 & 2033
- Figure 9: North America Whole-Slide Imaging Market Revenue Share (%), by Application 2025 & 2033
- Figure 10: North America Whole-Slide Imaging Market Volume Share (%), by Application 2025 & 2033
- Figure 11: North America Whole-Slide Imaging Market Revenue (Million), by End User 2025 & 2033
- Figure 12: North America Whole-Slide Imaging Market Volume (K Unit), by End User 2025 & 2033
- Figure 13: North America Whole-Slide Imaging Market Revenue Share (%), by End User 2025 & 2033
- Figure 14: North America Whole-Slide Imaging Market Volume Share (%), by End User 2025 & 2033
- Figure 15: North America Whole-Slide Imaging Market Revenue (Million), by Country 2025 & 2033
- Figure 16: North America Whole-Slide Imaging Market Volume (K Unit), by Country 2025 & 2033
- Figure 17: North America Whole-Slide Imaging Market Revenue Share (%), by Country 2025 & 2033
- Figure 18: North America Whole-Slide Imaging Market Volume Share (%), by Country 2025 & 2033
- Figure 19: Europe Whole-Slide Imaging Market Revenue (Million), by Technology 2025 & 2033
- Figure 20: Europe Whole-Slide Imaging Market Volume (K Unit), by Technology 2025 & 2033
- Figure 21: Europe Whole-Slide Imaging Market Revenue Share (%), by Technology 2025 & 2033
- Figure 22: Europe Whole-Slide Imaging Market Volume Share (%), by Technology 2025 & 2033
- Figure 23: Europe Whole-Slide Imaging Market Revenue (Million), by Application 2025 & 2033
- Figure 24: Europe Whole-Slide Imaging Market Volume (K Unit), by Application 2025 & 2033
- Figure 25: Europe Whole-Slide Imaging Market Revenue Share (%), by Application 2025 & 2033
- Figure 26: Europe Whole-Slide Imaging Market Volume Share (%), by Application 2025 & 2033
- Figure 27: Europe Whole-Slide Imaging Market Revenue (Million), by End User 2025 & 2033
- Figure 28: Europe Whole-Slide Imaging Market Volume (K Unit), by End User 2025 & 2033
- Figure 29: Europe Whole-Slide Imaging Market Revenue Share (%), by End User 2025 & 2033
- Figure 30: Europe Whole-Slide Imaging Market Volume Share (%), by End User 2025 & 2033
- Figure 31: Europe Whole-Slide Imaging Market Revenue (Million), by Country 2025 & 2033
- Figure 32: Europe Whole-Slide Imaging Market Volume (K Unit), by Country 2025 & 2033
- Figure 33: Europe Whole-Slide Imaging Market Revenue Share (%), by Country 2025 & 2033
- Figure 34: Europe Whole-Slide Imaging Market Volume Share (%), by Country 2025 & 2033
- Figure 35: Asia Pacific Whole-Slide Imaging Market Revenue (Million), by Technology 2025 & 2033
- Figure 36: Asia Pacific Whole-Slide Imaging Market Volume (K Unit), by Technology 2025 & 2033
- Figure 37: Asia Pacific Whole-Slide Imaging Market Revenue Share (%), by Technology 2025 & 2033
- Figure 38: Asia Pacific Whole-Slide Imaging Market Volume Share (%), by Technology 2025 & 2033
- Figure 39: Asia Pacific Whole-Slide Imaging Market Revenue (Million), by Application 2025 & 2033
- Figure 40: Asia Pacific Whole-Slide Imaging Market Volume (K Unit), by Application 2025 & 2033
- Figure 41: Asia Pacific Whole-Slide Imaging Market Revenue Share (%), by Application 2025 & 2033
- Figure 42: Asia Pacific Whole-Slide Imaging Market Volume Share (%), by Application 2025 & 2033
- Figure 43: Asia Pacific Whole-Slide Imaging Market Revenue (Million), by End User 2025 & 2033
- Figure 44: Asia Pacific Whole-Slide Imaging Market Volume (K Unit), by End User 2025 & 2033
- Figure 45: Asia Pacific Whole-Slide Imaging Market Revenue Share (%), by End User 2025 & 2033
- Figure 46: Asia Pacific Whole-Slide Imaging Market Volume Share (%), by End User 2025 & 2033
- Figure 47: Asia Pacific Whole-Slide Imaging Market Revenue (Million), by Country 2025 & 2033
- Figure 48: Asia Pacific Whole-Slide Imaging Market Volume (K Unit), by Country 2025 & 2033
- Figure 49: Asia Pacific Whole-Slide Imaging Market Revenue Share (%), by Country 2025 & 2033
- Figure 50: Asia Pacific Whole-Slide Imaging Market Volume Share (%), by Country 2025 & 2033
- Figure 51: Middle East and Africa Whole-Slide Imaging Market Revenue (Million), by Technology 2025 & 2033
- Figure 52: Middle East and Africa Whole-Slide Imaging Market Volume (K Unit), by Technology 2025 & 2033
- Figure 53: Middle East and Africa Whole-Slide Imaging Market Revenue Share (%), by Technology 2025 & 2033
- Figure 54: Middle East and Africa Whole-Slide Imaging Market Volume Share (%), by Technology 2025 & 2033
- Figure 55: Middle East and Africa Whole-Slide Imaging Market Revenue (Million), by Application 2025 & 2033
- Figure 56: Middle East and Africa Whole-Slide Imaging Market Volume (K Unit), by Application 2025 & 2033
- Figure 57: Middle East and Africa Whole-Slide Imaging Market Revenue Share (%), by Application 2025 & 2033
- Figure 58: Middle East and Africa Whole-Slide Imaging Market Volume Share (%), by Application 2025 & 2033
- Figure 59: Middle East and Africa Whole-Slide Imaging Market Revenue (Million), by End User 2025 & 2033
- Figure 60: Middle East and Africa Whole-Slide Imaging Market Volume (K Unit), by End User 2025 & 2033
- Figure 61: Middle East and Africa Whole-Slide Imaging Market Revenue Share (%), by End User 2025 & 2033
- Figure 62: Middle East and Africa Whole-Slide Imaging Market Volume Share (%), by End User 2025 & 2033
- Figure 63: Middle East and Africa Whole-Slide Imaging Market Revenue (Million), by Country 2025 & 2033
- Figure 64: Middle East and Africa Whole-Slide Imaging Market Volume (K Unit), by Country 2025 & 2033
- Figure 65: Middle East and Africa Whole-Slide Imaging Market Revenue Share (%), by Country 2025 & 2033
- Figure 66: Middle East and Africa Whole-Slide Imaging Market Volume Share (%), by Country 2025 & 2033
- Figure 67: South America Whole-Slide Imaging Market Revenue (Million), by Technology 2025 & 2033
- Figure 68: South America Whole-Slide Imaging Market Volume (K Unit), by Technology 2025 & 2033
- Figure 69: South America Whole-Slide Imaging Market Revenue Share (%), by Technology 2025 & 2033
- Figure 70: South America Whole-Slide Imaging Market Volume Share (%), by Technology 2025 & 2033
- Figure 71: South America Whole-Slide Imaging Market Revenue (Million), by Application 2025 & 2033
- Figure 72: South America Whole-Slide Imaging Market Volume (K Unit), by Application 2025 & 2033
- Figure 73: South America Whole-Slide Imaging Market Revenue Share (%), by Application 2025 & 2033
- Figure 74: South America Whole-Slide Imaging Market Volume Share (%), by Application 2025 & 2033
- Figure 75: South America Whole-Slide Imaging Market Revenue (Million), by End User 2025 & 2033
- Figure 76: South America Whole-Slide Imaging Market Volume (K Unit), by End User 2025 & 2033
- Figure 77: South America Whole-Slide Imaging Market Revenue Share (%), by End User 2025 & 2033
- Figure 78: South America Whole-Slide Imaging Market Volume Share (%), by End User 2025 & 2033
- Figure 79: South America Whole-Slide Imaging Market Revenue (Million), by Country 2025 & 2033
- Figure 80: South America Whole-Slide Imaging Market Volume (K Unit), by Country 2025 & 2033
- Figure 81: South America Whole-Slide Imaging Market Revenue Share (%), by Country 2025 & 2033
- Figure 82: South America Whole-Slide Imaging Market Volume Share (%), by Country 2025 & 2033
List of Tables
- Table 1: Global Whole-Slide Imaging Market Revenue Million Forecast, by Technology 2020 & 2033
- Table 2: Global Whole-Slide Imaging Market Volume K Unit Forecast, by Technology 2020 & 2033
- Table 3: Global Whole-Slide Imaging Market Revenue Million Forecast, by Application 2020 & 2033
- Table 4: Global Whole-Slide Imaging Market Volume K Unit Forecast, by Application 2020 & 2033
- Table 5: Global Whole-Slide Imaging Market Revenue Million Forecast, by End User 2020 & 2033
- Table 6: Global Whole-Slide Imaging Market Volume K Unit Forecast, by End User 2020 & 2033
- Table 7: Global Whole-Slide Imaging Market Revenue Million Forecast, by Region 2020 & 2033
- Table 8: Global Whole-Slide Imaging Market Volume K Unit Forecast, by Region 2020 & 2033
- Table 9: Global Whole-Slide Imaging Market Revenue Million Forecast, by Technology 2020 & 2033
- Table 10: Global Whole-Slide Imaging Market Volume K Unit Forecast, by Technology 2020 & 2033
- Table 11: Global Whole-Slide Imaging Market Revenue Million Forecast, by Application 2020 & 2033
- Table 12: Global Whole-Slide Imaging Market Volume K Unit Forecast, by Application 2020 & 2033
- Table 13: Global Whole-Slide Imaging Market Revenue Million Forecast, by End User 2020 & 2033
- Table 14: Global Whole-Slide Imaging Market Volume K Unit Forecast, by End User 2020 & 2033
- Table 15: Global Whole-Slide Imaging Market Revenue Million Forecast, by Country 2020 & 2033
- Table 16: Global Whole-Slide Imaging Market Volume K Unit Forecast, by Country 2020 & 2033
- Table 17: United States Whole-Slide Imaging Market Revenue (Million) Forecast, by Application 2020 & 2033
- Table 18: United States Whole-Slide Imaging Market Volume (K Unit) Forecast, by Application 2020 & 2033
- Table 19: Canada Whole-Slide Imaging Market Revenue (Million) Forecast, by Application 2020 & 2033
- Table 20: Canada Whole-Slide Imaging Market Volume (K Unit) Forecast, by Application 2020 & 2033
- Table 21: Mexico Whole-Slide Imaging Market Revenue (Million) Forecast, by Application 2020 & 2033
- Table 22: Mexico Whole-Slide Imaging Market Volume (K Unit) Forecast, by Application 2020 & 2033
- Table 23: Global Whole-Slide Imaging Market Revenue Million Forecast, by Technology 2020 & 2033
- Table 24: Global Whole-Slide Imaging Market Volume K Unit Forecast, by Technology 2020 & 2033
- Table 25: Global Whole-Slide Imaging Market Revenue Million Forecast, by Application 2020 & 2033
- Table 26: Global Whole-Slide Imaging Market Volume K Unit Forecast, by Application 2020 & 2033
- Table 27: Global Whole-Slide Imaging Market Revenue Million Forecast, by End User 2020 & 2033
- Table 28: Global Whole-Slide Imaging Market Volume K Unit Forecast, by End User 2020 & 2033
- Table 29: Global Whole-Slide Imaging Market Revenue Million Forecast, by Country 2020 & 2033
- Table 30: Global Whole-Slide Imaging Market Volume K Unit Forecast, by Country 2020 & 2033
- Table 31: Germany Whole-Slide Imaging Market Revenue (Million) Forecast, by Application 2020 & 2033
- Table 32: Germany Whole-Slide Imaging Market Volume (K Unit) Forecast, by Application 2020 & 2033
- Table 33: United Kingdom Whole-Slide Imaging Market Revenue (Million) Forecast, by Application 2020 & 2033
- Table 34: United Kingdom Whole-Slide Imaging Market Volume (K Unit) Forecast, by Application 2020 & 2033
- Table 35: France Whole-Slide Imaging Market Revenue (Million) Forecast, by Application 2020 & 2033
- Table 36: France Whole-Slide Imaging Market Volume (K Unit) Forecast, by Application 2020 & 2033
- Table 37: Italy Whole-Slide Imaging Market Revenue (Million) Forecast, by Application 2020 & 2033
- Table 38: Italy Whole-Slide Imaging Market Volume (K Unit) Forecast, by Application 2020 & 2033
- Table 39: Spain Whole-Slide Imaging Market Revenue (Million) Forecast, by Application 2020 & 2033
- Table 40: Spain Whole-Slide Imaging Market Volume (K Unit) Forecast, by Application 2020 & 2033
- Table 41: Rest of Europe Whole-Slide Imaging Market Revenue (Million) Forecast, by Application 2020 & 2033
- Table 42: Rest of Europe Whole-Slide Imaging Market Volume (K Unit) Forecast, by Application 2020 & 2033
- Table 43: Global Whole-Slide Imaging Market Revenue Million Forecast, by Technology 2020 & 2033
- Table 44: Global Whole-Slide Imaging Market Volume K Unit Forecast, by Technology 2020 & 2033
- Table 45: Global Whole-Slide Imaging Market Revenue Million Forecast, by Application 2020 & 2033
- Table 46: Global Whole-Slide Imaging Market Volume K Unit Forecast, by Application 2020 & 2033
- Table 47: Global Whole-Slide Imaging Market Revenue Million Forecast, by End User 2020 & 2033
- Table 48: Global Whole-Slide Imaging Market Volume K Unit Forecast, by End User 2020 & 2033
- Table 49: Global Whole-Slide Imaging Market Revenue Million Forecast, by Country 2020 & 2033
- Table 50: Global Whole-Slide Imaging Market Volume K Unit Forecast, by Country 2020 & 2033
- Table 51: China Whole-Slide Imaging Market Revenue (Million) Forecast, by Application 2020 & 2033
- Table 52: China Whole-Slide Imaging Market Volume (K Unit) Forecast, by Application 2020 & 2033
- Table 53: Japan Whole-Slide Imaging Market Revenue (Million) Forecast, by Application 2020 & 2033
- Table 54: Japan Whole-Slide Imaging Market Volume (K Unit) Forecast, by Application 2020 & 2033
- Table 55: India Whole-Slide Imaging Market Revenue (Million) Forecast, by Application 2020 & 2033
- Table 56: India Whole-Slide Imaging Market Volume (K Unit) Forecast, by Application 2020 & 2033
- Table 57: Australia Whole-Slide Imaging Market Revenue (Million) Forecast, by Application 2020 & 2033
- Table 58: Australia Whole-Slide Imaging Market Volume (K Unit) Forecast, by Application 2020 & 2033
- Table 59: South korea Whole-Slide Imaging Market Revenue (Million) Forecast, by Application 2020 & 2033
- Table 60: South korea Whole-Slide Imaging Market Volume (K Unit) Forecast, by Application 2020 & 2033
- Table 61: Rest of Asia Pacific Whole-Slide Imaging Market Revenue (Million) Forecast, by Application 2020 & 2033
- Table 62: Rest of Asia Pacific Whole-Slide Imaging Market Volume (K Unit) Forecast, by Application 2020 & 2033
- Table 63: Global Whole-Slide Imaging Market Revenue Million Forecast, by Technology 2020 & 2033
- Table 64: Global Whole-Slide Imaging Market Volume K Unit Forecast, by Technology 2020 & 2033
- Table 65: Global Whole-Slide Imaging Market Revenue Million Forecast, by Application 2020 & 2033
- Table 66: Global Whole-Slide Imaging Market Volume K Unit Forecast, by Application 2020 & 2033
- Table 67: Global Whole-Slide Imaging Market Revenue Million Forecast, by End User 2020 & 2033
- Table 68: Global Whole-Slide Imaging Market Volume K Unit Forecast, by End User 2020 & 2033
- Table 69: Global Whole-Slide Imaging Market Revenue Million Forecast, by Country 2020 & 2033
- Table 70: Global Whole-Slide Imaging Market Volume K Unit Forecast, by Country 2020 & 2033
- Table 71: GCC Whole-Slide Imaging Market Revenue (Million) Forecast, by Application 2020 & 2033
- Table 72: GCC Whole-Slide Imaging Market Volume (K Unit) Forecast, by Application 2020 & 2033
- Table 73: South Africa Whole-Slide Imaging Market Revenue (Million) Forecast, by Application 2020 & 2033
- Table 74: South Africa Whole-Slide Imaging Market Volume (K Unit) Forecast, by Application 2020 & 2033
- Table 75: Rest of Middle East and Africa Whole-Slide Imaging Market Revenue (Million) Forecast, by Application 2020 & 2033
- Table 76: Rest of Middle East and Africa Whole-Slide Imaging Market Volume (K Unit) Forecast, by Application 2020 & 2033
- Table 77: Global Whole-Slide Imaging Market Revenue Million Forecast, by Technology 2020 & 2033
- Table 78: Global Whole-Slide Imaging Market Volume K Unit Forecast, by Technology 2020 & 2033
- Table 79: Global Whole-Slide Imaging Market Revenue Million Forecast, by Application 2020 & 2033
- Table 80: Global Whole-Slide Imaging Market Volume K Unit Forecast, by Application 2020 & 2033
- Table 81: Global Whole-Slide Imaging Market Revenue Million Forecast, by End User 2020 & 2033
- Table 82: Global Whole-Slide Imaging Market Volume K Unit Forecast, by End User 2020 & 2033
- Table 83: Global Whole-Slide Imaging Market Revenue Million Forecast, by Country 2020 & 2033
- Table 84: Global Whole-Slide Imaging Market Volume K Unit Forecast, by Country 2020 & 2033
- Table 85: Brazil Whole-Slide Imaging Market Revenue (Million) Forecast, by Application 2020 & 2033
- Table 86: Brazil Whole-Slide Imaging Market Volume (K Unit) Forecast, by Application 2020 & 2033
- Table 87: Argentina Whole-Slide Imaging Market Revenue (Million) Forecast, by Application 2020 & 2033
- Table 88: Argentina Whole-Slide Imaging Market Volume (K Unit) Forecast, by Application 2020 & 2033
- Table 89: Rest of South America Whole-Slide Imaging Market Revenue (Million) Forecast, by Application 2020 & 2033
- Table 90: Rest of South America Whole-Slide Imaging Market Volume (K Unit) Forecast, by Application 2020 & 2033
Frequently Asked Questions
1. What is the projected Compound Annual Growth Rate (CAGR) of the Whole-Slide Imaging Market?
The projected CAGR is approximately 6.39%.
2. Which companies are prominent players in the Whole-Slide Imaging Market?
Key companies in the market include MBF Bioscience, Hamamatsu Photonics KK, Nikon Corporation, Leica Microsystems GmbH, Koninklijke Philips N V, 3Dhistech, Visiopharm, Indica Labs, Molecular Machines & Industries, Mikroscan Technologies Inc, Olympus Corporation, Akoya Biosciences.
3. What are the main segments of the Whole-Slide Imaging Market?
The market segments include Technology, Application, End User.
4. Can you provide details about the market size?
The market size is estimated to be USD 1.21 Million as of 2022.
5. What are some drivers contributing to market growth?
Growing Popularity of Virtual Slides as Compared to Physical Slides; Technological Advancements in Whole Slide Imaging; Increasing Research in Drug Discovery.
6. What are the notable trends driving market growth?
Telepathology Segment is Expected to Grow Significantly Over the Forecast Period.
7. Are there any restraints impacting market growth?
Stringent Regulatory Approvals; High Cost of Whole Slide Imaging Systems.
8. Can you provide examples of recent developments in the market?
March 2023: Pramana, Inc., an AI-enabled health tech company modernizing the pathology sector, collaborated with PathPresenter to accelerate the enterprise adoption of digital pathology workflows. The goal of this collaboration is to ensure a seamless user experience for the labs adopting Pramana's Digital Pathology as a Service solution for whole slide image generation, as well as PathPresenter's image management/image viewing platform.
9. What pricing options are available for accessing the report?
Pricing options include single-user, multi-user, and enterprise licenses priced at USD 4750, USD 5250, and USD 8750 respectively.
10. Is the market size provided in terms of value or volume?
The market size is provided in terms of value, measured in Million and volume, measured in K Unit.
11. Are there any specific market keywords associated with the report?
Yes, the market keyword associated with the report is "Whole-Slide Imaging Market," which aids in identifying and referencing the specific market segment covered.
12. How do I determine which pricing option suits my needs best?
The pricing options vary based on user requirements and access needs. Individual users may opt for single-user licenses, while businesses requiring broader access may choose multi-user or enterprise licenses for cost-effective access to the report.
13. Are there any additional resources or data provided in the Whole-Slide Imaging Market report?
While the report offers comprehensive insights, it's advisable to review the specific contents or supplementary materials provided to ascertain if additional resources or data are available.
14. How can I stay updated on further developments or reports in the Whole-Slide Imaging Market?
To stay informed about further developments, trends, and reports in the Whole-Slide Imaging Market, consider subscribing to industry newsletters, following relevant companies and organizations, or regularly checking reputable industry news sources and publications.
Methodology
Step 1 - Identification of Relevant Samples Size from Population Database


Step 2 - Approaches for Defining Global Market Size (Value, Volume* & Price*)

Note*: In applicable scenarios
Step 3 - Data Sources
Primary Research
- Web Analytics
- Survey Reports
- Research Institute
- Latest Research Reports
- Opinion Leaders
Secondary Research
- Annual Reports
- White Paper
- Latest Press Release
- Industry Association
- Paid Database
- Investor Presentations

Step 4 - Data Triangulation
Involves using different sources of information in order to increase the validity of a study
These sources are likely to be stakeholders in a program - participants, other researchers, program staff, other community members, and so on.
Then we put all data in single framework & apply various statistical tools to find out the dynamic on the market.
During the analysis stage, feedback from the stakeholder groups would be compared to determine areas of agreement as well as areas of divergence