

Key Insights
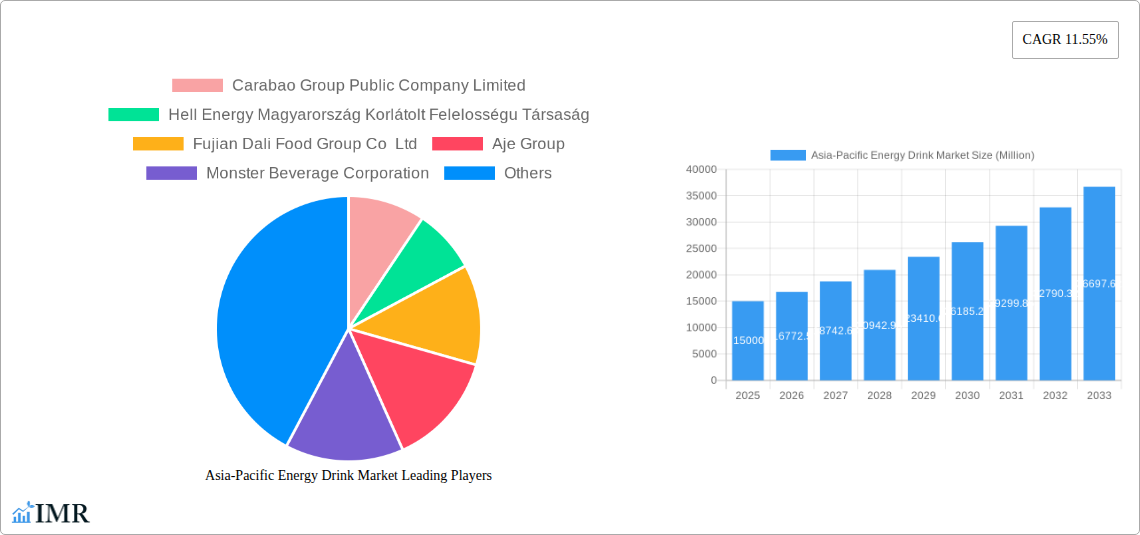
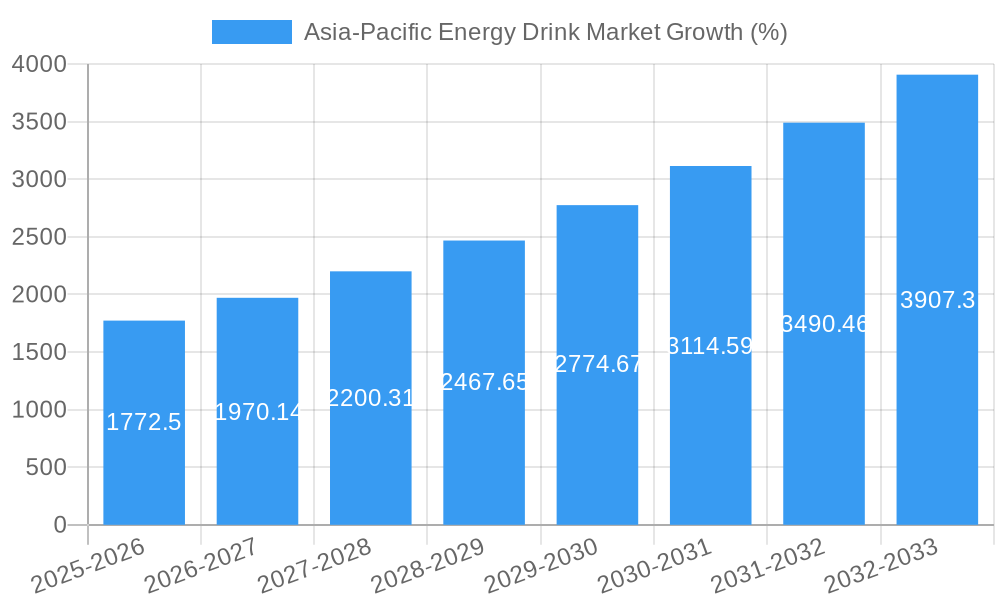
The Asia-Pacific energy drink market, valued at approximately $XX million in 2025, is projected to experience robust growth, with a Compound Annual Growth Rate (CAGR) of 11.55% from 2025 to 2033. This expansion is fueled by several key drivers. Rising disposable incomes across several Asian nations, particularly in rapidly developing economies like India and Indonesia, are increasing consumer spending on convenient and stimulating beverages. Further accelerating market growth is a burgeoning young, working-age population increasingly embracing active lifestyles and demanding functional beverages that enhance performance and concentration. The growing popularity of health and wellness trends is also impacting the market, with increasing demand for natural, organic, and low-sugar options. However, this market also faces challenges. Concerns regarding the high sugar content and potential health consequences of traditional energy drinks are prompting consumers to seek healthier alternatives. Furthermore, stringent regulations regarding ingredients and marketing claims, particularly in countries like Australia and Japan, might act as a restraint on market growth. This necessitates that companies innovate with diverse product offerings (energy shots, functional energy drinks, etc.) and effective marketing strategies highlighting health benefits and responsible consumption. The dominance of established players like Red Bull and Monster, coupled with the entry of regional and local brands, creates a highly competitive landscape with a constant drive towards innovation and brand differentiation. Segment-wise, the metal can packaging remains a popular choice, while the "off-trade" distribution channel (supermarkets, convenience stores) dominates, though on-trade (restaurants, bars) also offers significant growth potential.
The competitive dynamics are shaped by the presence of both multinational corporations and regional players. Established international brands like Red Bull, Monster Beverage, Coca-Cola, and PepsiCo leverage their strong brand recognition and extensive distribution networks to maintain market share. Simultaneously, local and regional players, such as Carabao Group (Thailand) and Aje Group (Indonesia), are gaining traction by catering to local tastes and preferences with tailored product offerings and competitive pricing. The continued expansion of e-commerce and online retail channels is expected to further boost market access and distribution reach. Successful players will likely be those that effectively balance appealing to consumer demand for healthier options while meeting the desire for convenient and affordable energy boosts. Furthermore, strategic partnerships and product diversification will be critical for long-term success. Geographic expansion into less penetrated markets within the Asia-Pacific region also presents a considerable avenue for growth.
Asia-Pacific Energy Drink Market: A Comprehensive Report (2019-2033)
This comprehensive report provides a detailed analysis of the Asia-Pacific energy drink market, encompassing market dynamics, growth trends, dominant segments, key players, and future outlook. With a study period spanning 2019-2033, a base year of 2025, and a forecast period of 2025-2033, this report is an invaluable resource for industry professionals, investors, and strategic decision-makers. The market size is presented in million units.
Asia-Pacific Energy Drink Market Dynamics & Structure
The Asia-Pacific energy drink market is characterized by a dynamic interplay of factors impacting its structure and growth trajectory. Market concentration is moderate, with several multinational corporations and regional players vying for market share. Technological innovation, particularly in formulations (e.g., natural/organic, low-calorie options) and packaging, plays a crucial role. Regulatory frameworks concerning sugar content, labeling, and marketing significantly influence product development and distribution. The market experiences competitive pressure from substitute beverages, including sports drinks and functional beverages. End-user demographics, primarily young adults and working professionals, drive demand. M&A activity has been moderate, with strategic acquisitions aimed at expanding geographic reach and product portfolios.
- Market Concentration: Moderately concentrated, with top 5 players holding xx% market share in 2024.
- Technological Innovation: Focus on natural/organic ingredients, functional benefits (e.g., improved focus, endurance), and sustainable packaging.
- Regulatory Framework: Varying regulations across countries on sugar content, labeling, and marketing claims.
- Competitive Substitutes: Sports drinks, functional beverages, coffee, and tea.
- End-User Demographics: Primarily young adults (18-35 years) and working professionals.
- M&A Trends: xx M&A deals recorded between 2019-2024, primarily focused on regional expansion and product diversification.
Asia-Pacific Energy Drink Market Growth Trends & Insights
The Asia-Pacific energy drink market experienced significant growth from 2019 to 2024, driven by rising disposable incomes, changing lifestyles, and increasing awareness of functional beverages. The market exhibited a CAGR of xx% during the historical period (2019-2024). Market penetration varies across countries, with higher adoption rates in developed economies like Japan and South Korea compared to emerging markets. Technological disruptions, such as the introduction of innovative formulations (e.g., sugar-free, natural options) and packaging formats, have fueled market expansion. Consumer behavior shifts towards healthier options and personalized experiences are shaping product development and marketing strategies. The forecast period (2025-2033) anticipates sustained growth, driven by factors such as increasing urbanization and rising health consciousness. Market size is projected to reach xx million units by 2033.
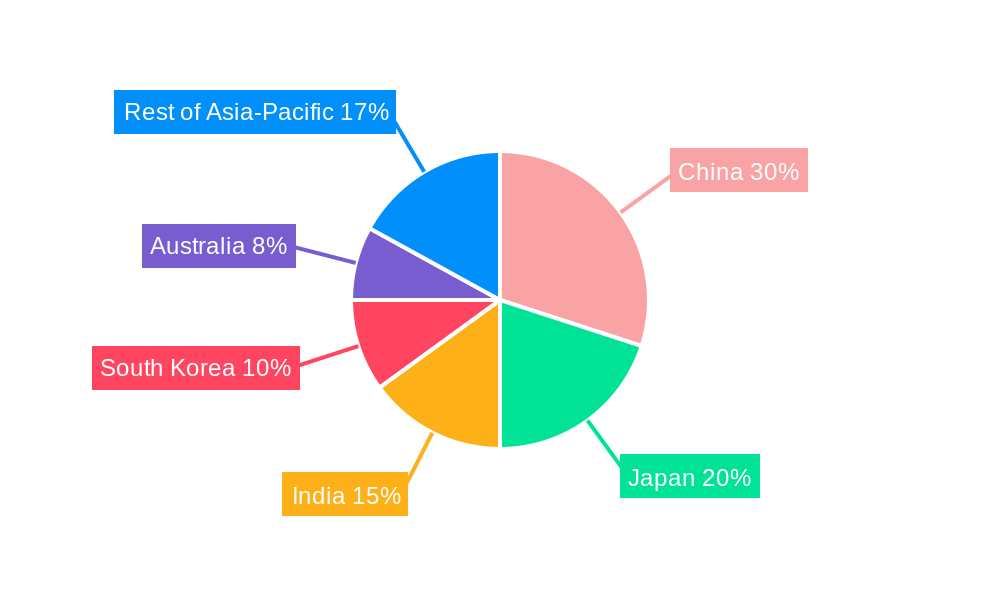
Dominant Regions, Countries, or Segments in Asia-Pacific Energy Drink Market
China, India, and Japan are the dominant countries in the Asia-Pacific energy drink market, accounting for xx% of the total market in 2024. Within the segments, traditional energy drinks hold the largest market share (xx%), followed by sugar-free/low-calorie energy drinks (xx%). The Metal Can packaging type maintains a significant share due to its cost-effectiveness and suitability for energy drink distribution. The off-trade distribution channel is currently the dominant segment, driven by increasing supermarket penetration and e-commerce adoption.
- Key Drivers for China: Growing middle class, rising urbanization, and increasing preference for convenient beverages.
- Key Drivers for India: Young and growing population, rising disposable incomes, and increasing adoption of western lifestyles.
- Key Drivers for Japan: High per capita consumption of beverages, established distribution networks, and a preference for premium products.
- Dominant Segment (Soft Drink Type): Traditional Energy Drinks
- Dominant Segment (Packaging Type): Metal Cans
- Dominant Segment (Distribution Channel): Off-trade
Asia-Pacific Energy Drink Market Product Landscape
The Asia-Pacific energy drink market offers a diverse product landscape, with a wide range of flavors, formulations (e.g., sugar-free, natural, organic), and packaging options. Product innovation is focused on catering to health-conscious consumers, with a rise in sugar-free and low-calorie options. Functional benefits are increasingly emphasized, such as improved focus, endurance, and mood enhancement. Technological advancements involve the development of new ingredients, enhanced packaging materials, and improved manufacturing processes. Unique selling propositions often include natural ingredients, functional benefits, and innovative flavor combinations.
Key Drivers, Barriers & Challenges in Asia-Pacific Energy Drink Market
Key Drivers:
- Rising disposable incomes and changing lifestyles
- Increasing urbanization and young demographics
- Growing health consciousness and demand for functional beverages
- Technological advancements in formulations and packaging
Challenges:
- Intense competition among established and emerging brands.
- Increasing health concerns regarding high sugar and caffeine content.
- Stringent regulations regarding labeling and marketing claims.
- Supply chain disruptions and fluctuating raw material prices impacting profitability.
Emerging Opportunities in Asia-Pacific Energy Drink Market
- Growing demand for functional and health-oriented energy drinks.
- Expansion into untapped rural markets with increased purchasing power.
- Development of innovative product formats (e.g., ready-to-drink shots).
- Rise of e-commerce and online direct-to-consumer sales.
Growth Accelerators in the Asia-Pacific Energy Drink Market Industry
Long-term growth will be fueled by strategic partnerships, collaborations across the value chain (raw material suppliers, packaging companies, retailers), and expansion into new markets. Technological advancements, such as enhanced manufacturing processes and sustainable packaging options, will play a critical role. Furthermore, marketing strategies focusing on health benefits, specific target groups (athletes, students), and brand storytelling will create sustained growth.
Key Players Shaping the Asia-Pacific Energy Drink Market Market
- Carabao Group Public Company Limited
- Hell Energy Magyarország Korlátolt Felelosségu Társaság
- Fujian Dali Food Group Co Ltd
- Aje Group
- Monster Beverage Corporation
- PepsiCo Inc
- The Coca-Cola Company
- Red Bull GmbH
- Henan Zhongwo Beverage Co Ltd
- Eastroc Beverage(Group) Co Ltd
- T C Pharmaceutical Industries Company Limited
- Taisho Pharmaceutical Holdings Co Ltd
- Congo Brands
- Osotspa Public Company Limited
Notable Milestones in Asia-Pacific Energy Drink Market Sector
- September 2023: PepsiCo India launched Sting Blue Current, a limited-edition flavor, boosting its presence in the Indian market.
- April 2023: Prime Energy's launch introduced a zero-sugar, electrolyte-rich option, catering to the growing health-conscious segment.
- January 2023: Monster's announcement of affordable energy drink expansion signaled a focus on driving growth in the Asia-Pacific region through broader market accessibility.
In-Depth Asia-Pacific Energy Drink Market Outlook
The Asia-Pacific energy drink market holds significant future potential, driven by consistent growth in key markets and the emergence of new opportunities. Strategic initiatives, including product diversification, strategic partnerships, and expansion into untapped markets, are crucial to sustain growth and create value. The market is poised for strong growth in the forecast period, driven by changing consumer preferences, technological innovation, and increasing market penetration in emerging economies. This creates promising opportunities for both established players and new entrants to capture market share and drive revenue growth.
Asia-Pacific Energy Drink Market Segmentation
-
1. Soft Drink Type
- 1.1. Energy Shots
- 1.2. Natural/Organic Energy Drinks
- 1.3. Sugar-free or Low-calories Energy Drinks
- 1.4. Traditional Energy Drinks
- 1.5. Other Energy Drinks
-
2. Packaging Type
- 2.1. Glass Bottles
- 2.2. Metal Can
- 2.3. PET Bottles
-
3. Distribution Channel
-
3.1. Off-trade
- 3.1.1. Convenience Stores
- 3.1.2. Online Retail
- 3.1.3. Supermarket/Hypermarket
- 3.1.4. Others
- 3.2. On-trade
-
3.1. Off-trade
Asia-Pacific Energy Drink Market Segmentation By Geography
-
1. Asia Pacific
- 1.1. China
- 1.2. Japan
- 1.3. South Korea
- 1.4. India
- 1.5. Australia
- 1.6. New Zealand
- 1.7. Indonesia
- 1.8. Malaysia
- 1.9. Singapore
- 1.10. Thailand
- 1.11. Vietnam
- 1.12. Philippines
Asia-Pacific Energy Drink Market REPORT HIGHLIGHTS
| Aspects | Details |
|---|---|
| Study Period | 2019-2033 |
| Base Year | 2024 |
| Estimated Year | 2025 |
| Forecast Period | 2025-2033 |
| Historical Period | 2019-2024 |
| Growth Rate | CAGR of 11.55% from 2019-2033 |
| Segmentation |
|
Table of Contents
- 1. Introduction
- 1.1. Research Scope
- 1.2. Market Segmentation
- 1.3. Research Methodology
- 1.4. Definitions and Assumptions
- 2. Executive Summary
- 2.1. Introduction
- 3. Market Dynamics
- 3.1. Introduction
- 3.2. Market Drivers
- 3.2.1. Increasing Demand for Protein-Rich Food; Increasing Demand for Plant-Based and Organic Ingredients
- 3.3. Market Restrains
- 3.3.1. Presence of Counterfeit Products
- 3.4. Market Trends
- 3.4.1. OTHER KEY INDUSTRY TRENDS COVERED IN THE REPORT
- 4. Market Factor Analysis
- 4.1. Porters Five Forces
- 4.2. Supply/Value Chain
- 4.3. PESTEL analysis
- 4.4. Market Entropy
- 4.5. Patent/Trademark Analysis
- 5. Asia-Pacific Energy Drink Market Analysis, Insights and Forecast, 2019-2031
- 5.1. Market Analysis, Insights and Forecast - by Soft Drink Type
- 5.1.1. Energy Shots
- 5.1.2. Natural/Organic Energy Drinks
- 5.1.3. Sugar-free or Low-calories Energy Drinks
- 5.1.4. Traditional Energy Drinks
- 5.1.5. Other Energy Drinks
- 5.2. Market Analysis, Insights and Forecast - by Packaging Type
- 5.2.1. Glass Bottles
- 5.2.2. Metal Can
- 5.2.3. PET Bottles
- 5.3. Market Analysis, Insights and Forecast - by Distribution Channel
- 5.3.1. Off-trade
- 5.3.1.1. Convenience Stores
- 5.3.1.2. Online Retail
- 5.3.1.3. Supermarket/Hypermarket
- 5.3.1.4. Others
- 5.3.2. On-trade
- 5.3.1. Off-trade
- 5.4. Market Analysis, Insights and Forecast - by Region
- 5.4.1. Asia Pacific
- 5.1. Market Analysis, Insights and Forecast - by Soft Drink Type
- 6. China Asia-Pacific Energy Drink Market Analysis, Insights and Forecast, 2019-2031
- 7. Japan Asia-Pacific Energy Drink Market Analysis, Insights and Forecast, 2019-2031
- 8. India Asia-Pacific Energy Drink Market Analysis, Insights and Forecast, 2019-2031
- 9. South Korea Asia-Pacific Energy Drink Market Analysis, Insights and Forecast, 2019-2031
- 10. Taiwan Asia-Pacific Energy Drink Market Analysis, Insights and Forecast, 2019-2031
- 11. Australia Asia-Pacific Energy Drink Market Analysis, Insights and Forecast, 2019-2031
- 12. Rest of Asia-Pacific Asia-Pacific Energy Drink Market Analysis, Insights and Forecast, 2019-2031
- 13. Competitive Analysis
- 13.1. Market Share Analysis 2024
- 13.2. Company Profiles
- 13.2.1 Carabao Group Public Company Limited
- 13.2.1.1. Overview
- 13.2.1.2. Products
- 13.2.1.3. SWOT Analysis
- 13.2.1.4. Recent Developments
- 13.2.1.5. Financials (Based on Availability)
- 13.2.2 Hell Energy Magyarország Korlátolt Felelosségu Társaság
- 13.2.2.1. Overview
- 13.2.2.2. Products
- 13.2.2.3. SWOT Analysis
- 13.2.2.4. Recent Developments
- 13.2.2.5. Financials (Based on Availability)
- 13.2.3 Fujian Dali Food Group Co Ltd
- 13.2.3.1. Overview
- 13.2.3.2. Products
- 13.2.3.3. SWOT Analysis
- 13.2.3.4. Recent Developments
- 13.2.3.5. Financials (Based on Availability)
- 13.2.4 Aje Group
- 13.2.4.1. Overview
- 13.2.4.2. Products
- 13.2.4.3. SWOT Analysis
- 13.2.4.4. Recent Developments
- 13.2.4.5. Financials (Based on Availability)
- 13.2.5 Monster Beverage Corporation
- 13.2.5.1. Overview
- 13.2.5.2. Products
- 13.2.5.3. SWOT Analysis
- 13.2.5.4. Recent Developments
- 13.2.5.5. Financials (Based on Availability)
- 13.2.6 PepsiCo Inc
- 13.2.6.1. Overview
- 13.2.6.2. Products
- 13.2.6.3. SWOT Analysis
- 13.2.6.4. Recent Developments
- 13.2.6.5. Financials (Based on Availability)
- 13.2.7 The Coca-Cola Compan
- 13.2.7.1. Overview
- 13.2.7.2. Products
- 13.2.7.3. SWOT Analysis
- 13.2.7.4. Recent Developments
- 13.2.7.5. Financials (Based on Availability)
- 13.2.8 Red Bull GmbH
- 13.2.8.1. Overview
- 13.2.8.2. Products
- 13.2.8.3. SWOT Analysis
- 13.2.8.4. Recent Developments
- 13.2.8.5. Financials (Based on Availability)
- 13.2.9 Henan Zhongwo Beverage Co Ltd
- 13.2.9.1. Overview
- 13.2.9.2. Products
- 13.2.9.3. SWOT Analysis
- 13.2.9.4. Recent Developments
- 13.2.9.5. Financials (Based on Availability)
- 13.2.10 Eastroc Beverage(Group) Co Ltd
- 13.2.10.1. Overview
- 13.2.10.2. Products
- 13.2.10.3. SWOT Analysis
- 13.2.10.4. Recent Developments
- 13.2.10.5. Financials (Based on Availability)
- 13.2.11 T C Pharmaceutical Industries Company Limited
- 13.2.11.1. Overview
- 13.2.11.2. Products
- 13.2.11.3. SWOT Analysis
- 13.2.11.4. Recent Developments
- 13.2.11.5. Financials (Based on Availability)
- 13.2.12 Taisho Pharmaceutical Holdings Co Ltd
- 13.2.12.1. Overview
- 13.2.12.2. Products
- 13.2.12.3. SWOT Analysis
- 13.2.12.4. Recent Developments
- 13.2.12.5. Financials (Based on Availability)
- 13.2.13 Congo Brands
- 13.2.13.1. Overview
- 13.2.13.2. Products
- 13.2.13.3. SWOT Analysis
- 13.2.13.4. Recent Developments
- 13.2.13.5. Financials (Based on Availability)
- 13.2.14 Osotspa Public Company Limited
- 13.2.14.1. Overview
- 13.2.14.2. Products
- 13.2.14.3. SWOT Analysis
- 13.2.14.4. Recent Developments
- 13.2.14.5. Financials (Based on Availability)
- 13.2.1 Carabao Group Public Company Limited
List of Figures
- Figure 1: Asia-Pacific Energy Drink Market Revenue Breakdown (Million, %) by Product 2024 & 2032
- Figure 2: Asia-Pacific Energy Drink Market Share (%) by Company 2024
List of Tables
- Table 1: Asia-Pacific Energy Drink Market Revenue Million Forecast, by Region 2019 & 2032
- Table 2: Asia-Pacific Energy Drink Market Revenue Million Forecast, by Soft Drink Type 2019 & 2032
- Table 3: Asia-Pacific Energy Drink Market Revenue Million Forecast, by Packaging Type 2019 & 2032
- Table 4: Asia-Pacific Energy Drink Market Revenue Million Forecast, by Distribution Channel 2019 & 2032
- Table 5: Asia-Pacific Energy Drink Market Revenue Million Forecast, by Region 2019 & 2032
- Table 6: Asia-Pacific Energy Drink Market Revenue Million Forecast, by Country 2019 & 2032
- Table 7: China Asia-Pacific Energy Drink Market Revenue (Million) Forecast, by Application 2019 & 2032
- Table 8: Japan Asia-Pacific Energy Drink Market Revenue (Million) Forecast, by Application 2019 & 2032
- Table 9: India Asia-Pacific Energy Drink Market Revenue (Million) Forecast, by Application 2019 & 2032
- Table 10: South Korea Asia-Pacific Energy Drink Market Revenue (Million) Forecast, by Application 2019 & 2032
- Table 11: Taiwan Asia-Pacific Energy Drink Market Revenue (Million) Forecast, by Application 2019 & 2032
- Table 12: Australia Asia-Pacific Energy Drink Market Revenue (Million) Forecast, by Application 2019 & 2032
- Table 13: Rest of Asia-Pacific Asia-Pacific Energy Drink Market Revenue (Million) Forecast, by Application 2019 & 2032
- Table 14: Asia-Pacific Energy Drink Market Revenue Million Forecast, by Soft Drink Type 2019 & 2032
- Table 15: Asia-Pacific Energy Drink Market Revenue Million Forecast, by Packaging Type 2019 & 2032
- Table 16: Asia-Pacific Energy Drink Market Revenue Million Forecast, by Distribution Channel 2019 & 2032
- Table 17: Asia-Pacific Energy Drink Market Revenue Million Forecast, by Country 2019 & 2032
- Table 18: China Asia-Pacific Energy Drink Market Revenue (Million) Forecast, by Application 2019 & 2032
- Table 19: Japan Asia-Pacific Energy Drink Market Revenue (Million) Forecast, by Application 2019 & 2032
- Table 20: South Korea Asia-Pacific Energy Drink Market Revenue (Million) Forecast, by Application 2019 & 2032
- Table 21: India Asia-Pacific Energy Drink Market Revenue (Million) Forecast, by Application 2019 & 2032
- Table 22: Australia Asia-Pacific Energy Drink Market Revenue (Million) Forecast, by Application 2019 & 2032
- Table 23: New Zealand Asia-Pacific Energy Drink Market Revenue (Million) Forecast, by Application 2019 & 2032
- Table 24: Indonesia Asia-Pacific Energy Drink Market Revenue (Million) Forecast, by Application 2019 & 2032
- Table 25: Malaysia Asia-Pacific Energy Drink Market Revenue (Million) Forecast, by Application 2019 & 2032
- Table 26: Singapore Asia-Pacific Energy Drink Market Revenue (Million) Forecast, by Application 2019 & 2032
- Table 27: Thailand Asia-Pacific Energy Drink Market Revenue (Million) Forecast, by Application 2019 & 2032
- Table 28: Vietnam Asia-Pacific Energy Drink Market Revenue (Million) Forecast, by Application 2019 & 2032
- Table 29: Philippines Asia-Pacific Energy Drink Market Revenue (Million) Forecast, by Application 2019 & 2032
Frequently Asked Questions
1. What is the projected Compound Annual Growth Rate (CAGR) of the Asia-Pacific Energy Drink Market?
The projected CAGR is approximately 11.55%.
2. Which companies are prominent players in the Asia-Pacific Energy Drink Market?
Key companies in the market include Carabao Group Public Company Limited, Hell Energy Magyarország Korlátolt Felelosségu Társaság, Fujian Dali Food Group Co Ltd, Aje Group, Monster Beverage Corporation, PepsiCo Inc, The Coca-Cola Compan, Red Bull GmbH, Henan Zhongwo Beverage Co Ltd, Eastroc Beverage(Group) Co Ltd, T C Pharmaceutical Industries Company Limited, Taisho Pharmaceutical Holdings Co Ltd, Congo Brands, Osotspa Public Company Limited.
3. What are the main segments of the Asia-Pacific Energy Drink Market?
The market segments include Soft Drink Type, Packaging Type, Distribution Channel.
4. Can you provide details about the market size?
The market size is estimated to be USD XX Million as of 2022.
5. What are some drivers contributing to market growth?
Increasing Demand for Protein-Rich Food; Increasing Demand for Plant-Based and Organic Ingredients.
6. What are the notable trends driving market growth?
OTHER KEY INDUSTRY TRENDS COVERED IN THE REPORT.
7. Are there any restraints impacting market growth?
Presence of Counterfeit Products.
8. Can you provide examples of recent developments in the market?
September 2023: PepsiCo India launched a limited edition flavor of its Sting Energy drink, called Sting Blue Current. Sting Blue Current is available at 200 ml in single-serve packs across India.April 2023: Prime has released a new energy drink, Prime Energy, containing 200mg of caffeine and zero sugar.The new drinks hold 300mg of electrolytes and contain ten calories, and come in blue raspberry, tropical punch, lemon lime, orange mango and strawberry watermelon flavours.January 2023: Monster is innovating its enery drinks and announced to launch affordable energy drink expansion to drive Asia growth.
9. What pricing options are available for accessing the report?
Pricing options include single-user, multi-user, and enterprise licenses priced at USD 3800, USD 4500, and USD 5800 respectively.
10. Is the market size provided in terms of value or volume?
The market size is provided in terms of value, measured in Million.
11. Are there any specific market keywords associated with the report?
Yes, the market keyword associated with the report is "Asia-Pacific Energy Drink Market," which aids in identifying and referencing the specific market segment covered.
12. How do I determine which pricing option suits my needs best?
The pricing options vary based on user requirements and access needs. Individual users may opt for single-user licenses, while businesses requiring broader access may choose multi-user or enterprise licenses for cost-effective access to the report.
13. Are there any additional resources or data provided in the Asia-Pacific Energy Drink Market report?
While the report offers comprehensive insights, it's advisable to review the specific contents or supplementary materials provided to ascertain if additional resources or data are available.
14. How can I stay updated on further developments or reports in the Asia-Pacific Energy Drink Market?
To stay informed about further developments, trends, and reports in the Asia-Pacific Energy Drink Market, consider subscribing to industry newsletters, following relevant companies and organizations, or regularly checking reputable industry news sources and publications.
Methodology
Step 1 - Identification of Relevant Samples Size from Population Database


Step 2 - Approaches for Defining Global Market Size (Value, Volume* & Price*)

Note*: In applicable scenarios
Step 3 - Data Sources
Primary Research
- Web Analytics
- Survey Reports
- Research Institute
- Latest Research Reports
- Opinion Leaders
Secondary Research
- Annual Reports
- White Paper
- Latest Press Release
- Industry Association
- Paid Database
- Investor Presentations

Step 4 - Data Triangulation
Involves using different sources of information in order to increase the validity of a study
These sources are likely to be stakeholders in a program - participants, other researchers, program staff, other community members, and so on.
Then we put all data in single framework & apply various statistical tools to find out the dynamic on the market.
During the analysis stage, feedback from the stakeholder groups would be compared to determine areas of agreement as well as areas of divergence
