

Key Insights
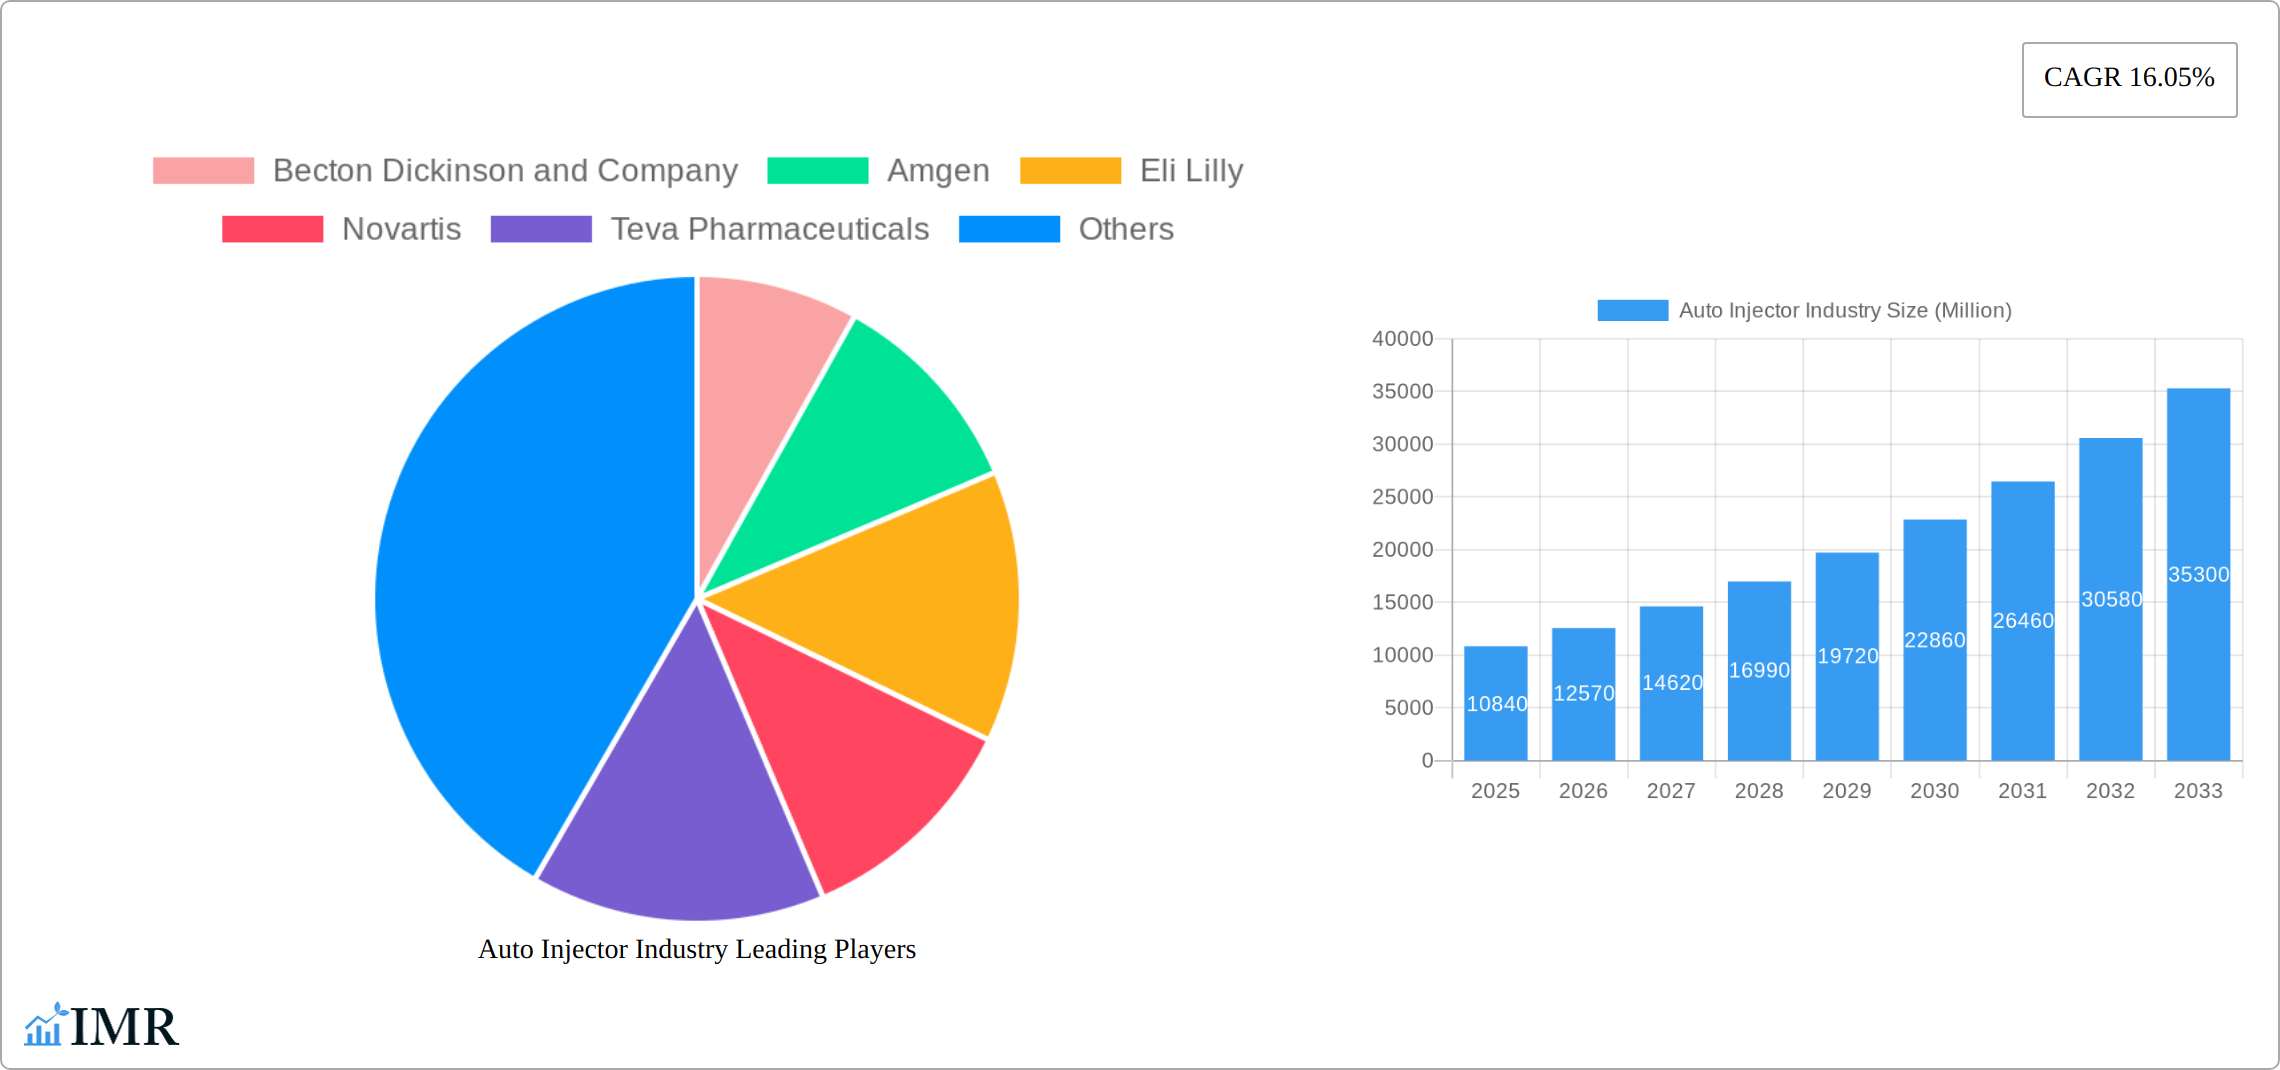
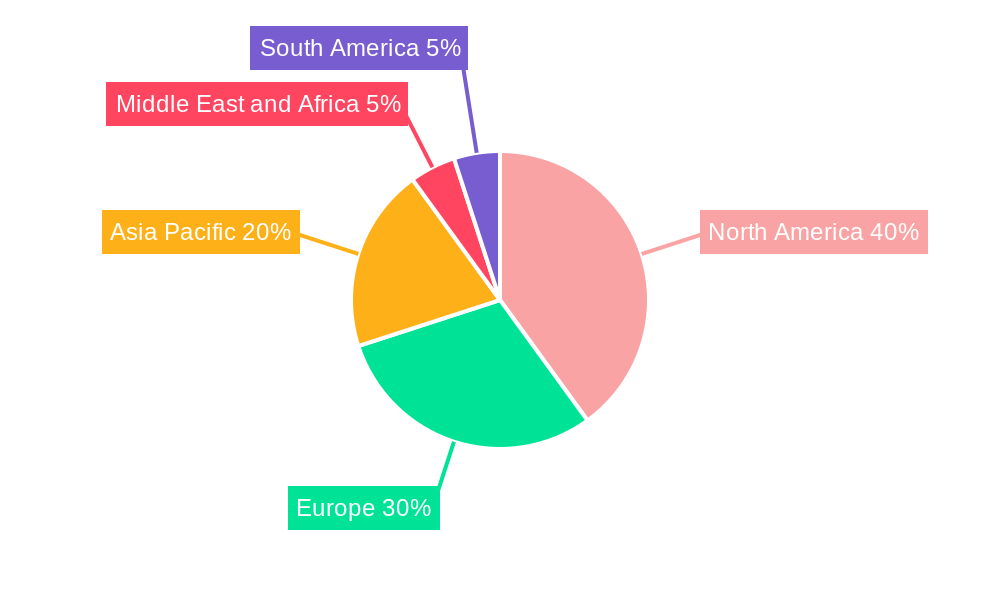
The global auto injector market, valued at $10.84 billion in 2025, is projected to experience robust growth, exhibiting a Compound Annual Growth Rate (CAGR) of 16.05% from 2025 to 2033. This expansion is fueled by several key drivers. The rising prevalence of chronic conditions like rheumatoid arthritis, multiple sclerosis, and anaphylaxis necessitates convenient and reliable self-administration of medications, driving demand for auto injectors. Furthermore, technological advancements leading to the development of more user-friendly and safer devices, along with increased awareness among patients and healthcare professionals, contribute significantly to market growth. The market is segmented by end-user (home care settings, hospitals & clinics, others), application (rheumatoid arthritis, multiple sclerosis, anaphylaxis, and other applications including cardiovascular diseases, diabetes, migraines, psoriasis, and anemia), and type (disposable and reusable auto injectors). North America currently holds a substantial market share due to high healthcare expenditure and technological advancements, but the Asia-Pacific region is expected to witness significant growth driven by increasing prevalence of chronic diseases and rising disposable incomes. While regulatory hurdles and the potential for adverse events pose certain challenges, the overall market outlook remains positive, driven by continuous innovation and a growing need for effective medication delivery systems.
The competitive landscape is characterized by a mix of established pharmaceutical companies and specialized medical device manufacturers. Key players like Becton Dickinson, Amgen, Eli Lilly, Novartis, Teva Pharmaceuticals, Biogen, AstraZeneca, AbbVie, and Ypsomed are actively involved in research and development, product launches, and strategic partnerships to enhance their market position. The market is witnessing a shift towards sophisticated devices incorporating features like dose counters, safety mechanisms, and connected health technology. This trend further fuels market growth as it improves patient compliance and reduces medication errors. The increasing adoption of personalized medicine is also expected to drive the demand for customized auto injectors tailored to individual patient needs. Future growth will be influenced by factors such as the development of biosimilars, pricing pressures, and the evolving regulatory landscape.
Auto Injector Industry Market Report: 2019-2033
This comprehensive report provides a detailed analysis of the global auto injector market, encompassing historical data (2019-2024), current estimates (2025), and future projections (2025-2033). The report offers invaluable insights into market dynamics, growth trends, regional segmentation, product landscape, key players, and emerging opportunities, enabling stakeholders to make informed strategic decisions. The market is segmented by end-user (Home Care Settings, Hospital & Clinics, Other End Users), application (Rheumatoid Arthritis, Multiple Sclerosis, Anaphylaxis, Other Applications), and type (Disposable Autoinjectors, Reusable Autoinjectors). This report is essential for pharmaceutical companies, medical device manufacturers, investors, and market research analysts seeking a complete understanding of this rapidly evolving sector. The global market is expected to reach xx Million units by 2033.
Auto Injector Industry Market Dynamics & Structure
The auto injector market is characterized by a moderately concentrated landscape, with key players like Becton Dickinson and Company, Amgen, Eli Lilly, Novartis, and Teva Pharmaceuticals holding significant market share. Technological innovation, particularly in areas like connected devices and improved usability, is a major driver of market growth. Stringent regulatory frameworks governing medical devices impact market entry and product development. Competitive pressure from substitute therapies and alternative drug delivery systems presents ongoing challenges. The end-user demographic is expanding, with a growing elderly population and increasing prevalence of chronic diseases driving demand. M&A activity in the sector has been moderate, with strategic acquisitions aimed at enhancing product portfolios and expanding market reach.
- Market Concentration: Moderately concentrated, with top 5 players holding approximately xx% market share in 2024.
- Technological Innovation: Focus on improved usability, connected devices, and miniaturization.
- Regulatory Landscape: Stringent regulations impacting time-to-market and cost of development.
- Competitive Substitutes: Oral medications, intravenous injections, and other drug delivery systems.
- End-User Demographics: Aging population and increasing prevalence of chronic diseases driving growth.
- M&A Activity: Moderate level of activity, primarily driven by strategic acquisitions.
Auto Injector Industry Growth Trends & Insights
The global auto injector market demonstrated robust growth from 2019-2024, fueled by the rising prevalence of chronic diseases requiring injectable therapies, increased healthcare expenditure, and significant technological advancements resulting in more effective and user-compliant devices. Market projections indicate continued expansion, with a projected Compound Annual Growth Rate (CAGR) of [Insert Projected CAGR]% during the forecast period (2025-2033), reaching an estimated [Insert Projected Market Size in Million Units] units by 2033. Developed regions, possessing well-established healthcare infrastructures and high awareness of self-injectable therapies, currently exhibit the highest adoption rates. However, emerging economies are poised for substantial growth as healthcare infrastructure improves and affordability increases. The market landscape is being reshaped by technological disruptions, particularly the emergence of smart auto-injectors with data-logging capabilities, significantly influencing consumer behavior and preferences toward user-friendly and convenient self-injection solutions.
Dominant Regions, Countries, or Segments in Auto Injector Industry
North America and Europe currently hold the dominant position in the auto injector market, driven by substantial healthcare expenditure, advanced healthcare infrastructure, and a high prevalence of chronic diseases. Within these regions, the Hospital & Clinics segment maintains a significant market share due to the high volume of injections administered in these settings. Nevertheless, the Home Care Settings segment is experiencing the most rapid growth, reflecting the increasing preference for convenient self-medication. The Rheumatoid Arthritis and Multiple Sclerosis therapeutic areas are key drivers of market expansion due to their high prevalence and the consequent need for frequent injections. While disposable autoinjectors currently dominate the market due to their ease of use and disposability, reusable autoinjectors are gaining traction, driven by cost-effectiveness and sustainability concerns.
- Key Drivers: High prevalence of chronic diseases, increasing healthcare expenditure, technological advancements, growing demand for convenience and user-friendliness.
- Dominant Regions: North America and Europe.
- Fastest Growing Segment: Home Care Settings.
- Leading Application Segments: Rheumatoid Arthritis and Multiple Sclerosis.
- Dominant Type: Disposable Autoinjectors, with increasing adoption of reusable options.
Auto Injector Industry Product Landscape
The auto injector market offers a range of products, from simple disposable devices to sophisticated reusable autoinjectors with features such as dose counters, needle safety mechanisms, and data logging capabilities. Recent innovations focus on improving usability, reducing injection pain, and enhancing patient compliance. Key product differentiators include device size, ease of use, safety features, and cost-effectiveness. Technological advancements in materials science, electronics, and software engineering are continuously improving auto injector performance and functionality.
Key Drivers, Barriers & Challenges in Auto Injector Industry
Key Drivers:
- Rising prevalence of chronic diseases mandating injectable therapies.
- Globally increasing healthcare expenditure.
- Technological advancements enhancing device efficacy and patient compliance.
- Growing demand for convenient and user-friendly self-injection devices.
- Expansion into emerging markets with increasing access to healthcare.
Key Challenges & Restraints:
- Stringent regulatory requirements for medical devices.
- High research and development and manufacturing costs.
- Competition from alternative drug delivery systems (e.g., oral medications, patches).
- Potential supply chain disruptions affecting manufacturing and distribution.
- Ensuring consistent patient adherence and proper injection technique.
Emerging Opportunities in Auto Injector Industry
- Expansion into emerging markets with high unmet needs.
- Development of smart autoinjectors with connected capabilities.
- Focus on improving user experience and patient compliance.
- Development of innovative applications for various therapeutic areas.
Growth Accelerators in the Auto Injector Industry
Technological breakthroughs in device design, materials, and connected health technology are key growth accelerators. Strategic partnerships between pharmaceutical companies and medical device manufacturers to develop innovative drug-device combinations are also driving growth. Expansion into emerging markets and geographic diversification represent significant opportunities for long-term market expansion.
Key Players Shaping the Auto Injector Industry Market
- Becton Dickinson and Company
- Amgen
- Eli Lilly
- Novartis
- Teva Pharmaceuticals
- Biogen
- AstraZeneca
- Abbvie
- Ypsomed
- Bayer
- [Add other relevant key players]
Notable Milestones in Auto Injector Industry Sector
- May 2022: Jabil Healthcare launched the Qfinity autoinjector platform, a cost-effective, reusable solution.
- May 2022: Stevanato Group partnered with Owen Mumford for its Aidaptus auto-injector.
In-Depth Auto Injector Industry Market Outlook
The auto injector market is poised for continued growth, driven by ongoing innovation, expanding therapeutic applications, and increasing demand across both developed and emerging markets. Success in this dynamic sector will depend heavily on strategic collaborations, technological advancements, and a strong focus on patient-centric design. The market presents significant opportunities for companies capable of developing innovative, cost-effective, and user-friendly auto injector solutions that address unmet patient needs and improve treatment outcomes.
Auto Injector Industry Segmentation
-
1. Application
- 1.1. Rheumatoid Arthritis
- 1.2. Multiple Sclerosis
- 1.3. Anaphylaxis
- 1.4. Other Ap
-
2. Type
- 2.1. Disposable Autoinjectors
- 2.2. Reusable Autoinjectors
-
3. End User
- 3.1. Home Care Settings
- 3.2. Hospital & Clinics
- 3.3. Other End Users
Auto Injector Industry Segmentation By Geography
-
1. North America
- 1.1. United States
- 1.2. Canada
- 1.3. Mexico
-
2. Europe
- 2.1. Germany
- 2.2. United Kingdom
- 2.3. France
- 2.4. Italy
- 2.5. Spain
- 2.6. Rest of Europe
-
3. Asia Pacific
- 3.1. China
- 3.2. Japan
- 3.3. India
- 3.4. Australia
- 3.5. South Korea
- 3.6. Rest of Asia Pacific
-
4. Middle East and Africa
- 4.1. GCC
- 4.2. South Africa
- 4.3. Rest of Middle East and Africa
-
5. South America
- 5.1. Brazil
- 5.2. Argentina
- 5.3. Rest of South America
Auto Injector Industry REPORT HIGHLIGHTS
| Aspects | Details |
|---|---|
| Study Period | 2019-2033 |
| Base Year | 2024 |
| Estimated Year | 2025 |
| Forecast Period | 2025-2033 |
| Historical Period | 2019-2024 |
| Growth Rate | CAGR of 16.05% from 2019-2033 |
| Segmentation |
|
Table of Contents
- 1. Introduction
- 1.1. Research Scope
- 1.2. Market Segmentation
- 1.3. Research Methodology
- 1.4. Definitions and Assumptions
- 2. Executive Summary
- 2.1. Introduction
- 3. Market Dynamics
- 3.1. Introduction
- 3.2. Market Drivers
- 3.2.1. Increasing Demand for Convenience of Patients; Rising Incidence of Chronic and Lifestyle Diseases; Technological Advancements
- 3.3. Market Restrains
- 3.3.1. Preference for Alternative Drug Delivery Modes; Regulatory Hurdles
- 3.4. Market Trends
- 3.4.1. Rheumatoid Arthritis Expected to Hold Significant Market Share Over the Forecast Period
- 4. Market Factor Analysis
- 4.1. Porters Five Forces
- 4.2. Supply/Value Chain
- 4.3. PESTEL analysis
- 4.4. Market Entropy
- 4.5. Patent/Trademark Analysis
- 5. Global Auto Injector Industry Analysis, Insights and Forecast, 2019-2031
- 5.1. Market Analysis, Insights and Forecast - by Application
- 5.1.1. Rheumatoid Arthritis
- 5.1.2. Multiple Sclerosis
- 5.1.3. Anaphylaxis
- 5.1.4. Other Ap
- 5.2. Market Analysis, Insights and Forecast - by Type
- 5.2.1. Disposable Autoinjectors
- 5.2.2. Reusable Autoinjectors
- 5.3. Market Analysis, Insights and Forecast - by End User
- 5.3.1. Home Care Settings
- 5.3.2. Hospital & Clinics
- 5.3.3. Other End Users
- 5.4. Market Analysis, Insights and Forecast - by Region
- 5.4.1. North America
- 5.4.2. Europe
- 5.4.3. Asia Pacific
- 5.4.4. Middle East and Africa
- 5.4.5. South America
- 5.1. Market Analysis, Insights and Forecast - by Application
- 6. North America Auto Injector Industry Analysis, Insights and Forecast, 2019-2031
- 6.1. Market Analysis, Insights and Forecast - by Application
- 6.1.1. Rheumatoid Arthritis
- 6.1.2. Multiple Sclerosis
- 6.1.3. Anaphylaxis
- 6.1.4. Other Ap
- 6.2. Market Analysis, Insights and Forecast - by Type
- 6.2.1. Disposable Autoinjectors
- 6.2.2. Reusable Autoinjectors
- 6.3. Market Analysis, Insights and Forecast - by End User
- 6.3.1. Home Care Settings
- 6.3.2. Hospital & Clinics
- 6.3.3. Other End Users
- 6.1. Market Analysis, Insights and Forecast - by Application
- 7. Europe Auto Injector Industry Analysis, Insights and Forecast, 2019-2031
- 7.1. Market Analysis, Insights and Forecast - by Application
- 7.1.1. Rheumatoid Arthritis
- 7.1.2. Multiple Sclerosis
- 7.1.3. Anaphylaxis
- 7.1.4. Other Ap
- 7.2. Market Analysis, Insights and Forecast - by Type
- 7.2.1. Disposable Autoinjectors
- 7.2.2. Reusable Autoinjectors
- 7.3. Market Analysis, Insights and Forecast - by End User
- 7.3.1. Home Care Settings
- 7.3.2. Hospital & Clinics
- 7.3.3. Other End Users
- 7.1. Market Analysis, Insights and Forecast - by Application
- 8. Asia Pacific Auto Injector Industry Analysis, Insights and Forecast, 2019-2031
- 8.1. Market Analysis, Insights and Forecast - by Application
- 8.1.1. Rheumatoid Arthritis
- 8.1.2. Multiple Sclerosis
- 8.1.3. Anaphylaxis
- 8.1.4. Other Ap
- 8.2. Market Analysis, Insights and Forecast - by Type
- 8.2.1. Disposable Autoinjectors
- 8.2.2. Reusable Autoinjectors
- 8.3. Market Analysis, Insights and Forecast - by End User
- 8.3.1. Home Care Settings
- 8.3.2. Hospital & Clinics
- 8.3.3. Other End Users
- 8.1. Market Analysis, Insights and Forecast - by Application
- 9. Middle East and Africa Auto Injector Industry Analysis, Insights and Forecast, 2019-2031
- 9.1. Market Analysis, Insights and Forecast - by Application
- 9.1.1. Rheumatoid Arthritis
- 9.1.2. Multiple Sclerosis
- 9.1.3. Anaphylaxis
- 9.1.4. Other Ap
- 9.2. Market Analysis, Insights and Forecast - by Type
- 9.2.1. Disposable Autoinjectors
- 9.2.2. Reusable Autoinjectors
- 9.3. Market Analysis, Insights and Forecast - by End User
- 9.3.1. Home Care Settings
- 9.3.2. Hospital & Clinics
- 9.3.3. Other End Users
- 9.1. Market Analysis, Insights and Forecast - by Application
- 10. South America Auto Injector Industry Analysis, Insights and Forecast, 2019-2031
- 10.1. Market Analysis, Insights and Forecast - by Application
- 10.1.1. Rheumatoid Arthritis
- 10.1.2. Multiple Sclerosis
- 10.1.3. Anaphylaxis
- 10.1.4. Other Ap
- 10.2. Market Analysis, Insights and Forecast - by Type
- 10.2.1. Disposable Autoinjectors
- 10.2.2. Reusable Autoinjectors
- 10.3. Market Analysis, Insights and Forecast - by End User
- 10.3.1. Home Care Settings
- 10.3.2. Hospital & Clinics
- 10.3.3. Other End Users
- 10.1. Market Analysis, Insights and Forecast - by Application
- 11. North America Auto Injector Industry Analysis, Insights and Forecast, 2019-2031
- 11.1. Market Analysis, Insights and Forecast - By Country/Sub-region
- 11.1.1 United States
- 11.1.2 Canada
- 11.1.3 Mexico
- 12. Europe Auto Injector Industry Analysis, Insights and Forecast, 2019-2031
- 12.1. Market Analysis, Insights and Forecast - By Country/Sub-region
- 12.1.1 Germany
- 12.1.2 United Kingdom
- 12.1.3 France
- 12.1.4 Italy
- 12.1.5 Spain
- 12.1.6 Rest of Europe
- 13. Asia Pacific Auto Injector Industry Analysis, Insights and Forecast, 2019-2031
- 13.1. Market Analysis, Insights and Forecast - By Country/Sub-region
- 13.1.1 China
- 13.1.2 Japan
- 13.1.3 India
- 13.1.4 Australia
- 13.1.5 South Korea
- 13.1.6 Rest of Asia Pacific
- 14. Middle East and Africa Auto Injector Industry Analysis, Insights and Forecast, 2019-2031
- 14.1. Market Analysis, Insights and Forecast - By Country/Sub-region
- 14.1.1 GCC
- 14.1.2 South Africa
- 14.1.3 Rest of Middle East and Africa
- 15. South America Auto Injector Industry Analysis, Insights and Forecast, 2019-2031
- 15.1. Market Analysis, Insights and Forecast - By Country/Sub-region
- 15.1.1 Brazil
- 15.1.2 Argentina
- 15.1.3 Rest of South America
- 16. Competitive Analysis
- 16.1. Global Market Share Analysis 2024
- 16.2. Company Profiles
- 16.2.1 Becton Dickinson and Company
- 16.2.1.1. Overview
- 16.2.1.2. Products
- 16.2.1.3. SWOT Analysis
- 16.2.1.4. Recent Developments
- 16.2.1.5. Financials (Based on Availability)
- 16.2.2 Amgen
- 16.2.2.1. Overview
- 16.2.2.2. Products
- 16.2.2.3. SWOT Analysis
- 16.2.2.4. Recent Developments
- 16.2.2.5. Financials (Based on Availability)
- 16.2.3 Eli Lilly
- 16.2.3.1. Overview
- 16.2.3.2. Products
- 16.2.3.3. SWOT Analysis
- 16.2.3.4. Recent Developments
- 16.2.3.5. Financials (Based on Availability)
- 16.2.4 Novartis
- 16.2.4.1. Overview
- 16.2.4.2. Products
- 16.2.4.3. SWOT Analysis
- 16.2.4.4. Recent Developments
- 16.2.4.5. Financials (Based on Availability)
- 16.2.5 Teva Pharmaceuticals
- 16.2.5.1. Overview
- 16.2.5.2. Products
- 16.2.5.3. SWOT Analysis
- 16.2.5.4. Recent Developments
- 16.2.5.5. Financials (Based on Availability)
- 16.2.6 Biogen
- 16.2.6.1. Overview
- 16.2.6.2. Products
- 16.2.6.3. SWOT Analysis
- 16.2.6.4. Recent Developments
- 16.2.6.5. Financials (Based on Availability)
- 16.2.7 AstraZeneca
- 16.2.7.1. Overview
- 16.2.7.2. Products
- 16.2.7.3. SWOT Analysis
- 16.2.7.4. Recent Developments
- 16.2.7.5. Financials (Based on Availability)
- 16.2.8 Abbvie
- 16.2.8.1. Overview
- 16.2.8.2. Products
- 16.2.8.3. SWOT Analysis
- 16.2.8.4. Recent Developments
- 16.2.8.5. Financials (Based on Availability)
- 16.2.9 Ypsomed*List Not Exhaustive
- 16.2.9.1. Overview
- 16.2.9.2. Products
- 16.2.9.3. SWOT Analysis
- 16.2.9.4. Recent Developments
- 16.2.9.5. Financials (Based on Availability)
- 16.2.10 Bayer
- 16.2.10.1. Overview
- 16.2.10.2. Products
- 16.2.10.3. SWOT Analysis
- 16.2.10.4. Recent Developments
- 16.2.10.5. Financials (Based on Availability)
- 16.2.1 Becton Dickinson and Company
List of Figures
- Figure 1: Global Auto Injector Industry Revenue Breakdown (Million, %) by Region 2024 & 2032
- Figure 2: North America Auto Injector Industry Revenue (Million), by Country 2024 & 2032
- Figure 3: North America Auto Injector Industry Revenue Share (%), by Country 2024 & 2032
- Figure 4: Europe Auto Injector Industry Revenue (Million), by Country 2024 & 2032
- Figure 5: Europe Auto Injector Industry Revenue Share (%), by Country 2024 & 2032
- Figure 6: Asia Pacific Auto Injector Industry Revenue (Million), by Country 2024 & 2032
- Figure 7: Asia Pacific Auto Injector Industry Revenue Share (%), by Country 2024 & 2032
- Figure 8: Middle East and Africa Auto Injector Industry Revenue (Million), by Country 2024 & 2032
- Figure 9: Middle East and Africa Auto Injector Industry Revenue Share (%), by Country 2024 & 2032
- Figure 10: South America Auto Injector Industry Revenue (Million), by Country 2024 & 2032
- Figure 11: South America Auto Injector Industry Revenue Share (%), by Country 2024 & 2032
- Figure 12: North America Auto Injector Industry Revenue (Million), by Application 2024 & 2032
- Figure 13: North America Auto Injector Industry Revenue Share (%), by Application 2024 & 2032
- Figure 14: North America Auto Injector Industry Revenue (Million), by Type 2024 & 2032
- Figure 15: North America Auto Injector Industry Revenue Share (%), by Type 2024 & 2032
- Figure 16: North America Auto Injector Industry Revenue (Million), by End User 2024 & 2032
- Figure 17: North America Auto Injector Industry Revenue Share (%), by End User 2024 & 2032
- Figure 18: North America Auto Injector Industry Revenue (Million), by Country 2024 & 2032
- Figure 19: North America Auto Injector Industry Revenue Share (%), by Country 2024 & 2032
- Figure 20: Europe Auto Injector Industry Revenue (Million), by Application 2024 & 2032
- Figure 21: Europe Auto Injector Industry Revenue Share (%), by Application 2024 & 2032
- Figure 22: Europe Auto Injector Industry Revenue (Million), by Type 2024 & 2032
- Figure 23: Europe Auto Injector Industry Revenue Share (%), by Type 2024 & 2032
- Figure 24: Europe Auto Injector Industry Revenue (Million), by End User 2024 & 2032
- Figure 25: Europe Auto Injector Industry Revenue Share (%), by End User 2024 & 2032
- Figure 26: Europe Auto Injector Industry Revenue (Million), by Country 2024 & 2032
- Figure 27: Europe Auto Injector Industry Revenue Share (%), by Country 2024 & 2032
- Figure 28: Asia Pacific Auto Injector Industry Revenue (Million), by Application 2024 & 2032
- Figure 29: Asia Pacific Auto Injector Industry Revenue Share (%), by Application 2024 & 2032
- Figure 30: Asia Pacific Auto Injector Industry Revenue (Million), by Type 2024 & 2032
- Figure 31: Asia Pacific Auto Injector Industry Revenue Share (%), by Type 2024 & 2032
- Figure 32: Asia Pacific Auto Injector Industry Revenue (Million), by End User 2024 & 2032
- Figure 33: Asia Pacific Auto Injector Industry Revenue Share (%), by End User 2024 & 2032
- Figure 34: Asia Pacific Auto Injector Industry Revenue (Million), by Country 2024 & 2032
- Figure 35: Asia Pacific Auto Injector Industry Revenue Share (%), by Country 2024 & 2032
- Figure 36: Middle East and Africa Auto Injector Industry Revenue (Million), by Application 2024 & 2032
- Figure 37: Middle East and Africa Auto Injector Industry Revenue Share (%), by Application 2024 & 2032
- Figure 38: Middle East and Africa Auto Injector Industry Revenue (Million), by Type 2024 & 2032
- Figure 39: Middle East and Africa Auto Injector Industry Revenue Share (%), by Type 2024 & 2032
- Figure 40: Middle East and Africa Auto Injector Industry Revenue (Million), by End User 2024 & 2032
- Figure 41: Middle East and Africa Auto Injector Industry Revenue Share (%), by End User 2024 & 2032
- Figure 42: Middle East and Africa Auto Injector Industry Revenue (Million), by Country 2024 & 2032
- Figure 43: Middle East and Africa Auto Injector Industry Revenue Share (%), by Country 2024 & 2032
- Figure 44: South America Auto Injector Industry Revenue (Million), by Application 2024 & 2032
- Figure 45: South America Auto Injector Industry Revenue Share (%), by Application 2024 & 2032
- Figure 46: South America Auto Injector Industry Revenue (Million), by Type 2024 & 2032
- Figure 47: South America Auto Injector Industry Revenue Share (%), by Type 2024 & 2032
- Figure 48: South America Auto Injector Industry Revenue (Million), by End User 2024 & 2032
- Figure 49: South America Auto Injector Industry Revenue Share (%), by End User 2024 & 2032
- Figure 50: South America Auto Injector Industry Revenue (Million), by Country 2024 & 2032
- Figure 51: South America Auto Injector Industry Revenue Share (%), by Country 2024 & 2032
List of Tables
- Table 1: Global Auto Injector Industry Revenue Million Forecast, by Region 2019 & 2032
- Table 2: Global Auto Injector Industry Revenue Million Forecast, by Application 2019 & 2032
- Table 3: Global Auto Injector Industry Revenue Million Forecast, by Type 2019 & 2032
- Table 4: Global Auto Injector Industry Revenue Million Forecast, by End User 2019 & 2032
- Table 5: Global Auto Injector Industry Revenue Million Forecast, by Region 2019 & 2032
- Table 6: Global Auto Injector Industry Revenue Million Forecast, by Country 2019 & 2032
- Table 7: United States Auto Injector Industry Revenue (Million) Forecast, by Application 2019 & 2032
- Table 8: Canada Auto Injector Industry Revenue (Million) Forecast, by Application 2019 & 2032
- Table 9: Mexico Auto Injector Industry Revenue (Million) Forecast, by Application 2019 & 2032
- Table 10: Global Auto Injector Industry Revenue Million Forecast, by Country 2019 & 2032
- Table 11: Germany Auto Injector Industry Revenue (Million) Forecast, by Application 2019 & 2032
- Table 12: United Kingdom Auto Injector Industry Revenue (Million) Forecast, by Application 2019 & 2032
- Table 13: France Auto Injector Industry Revenue (Million) Forecast, by Application 2019 & 2032
- Table 14: Italy Auto Injector Industry Revenue (Million) Forecast, by Application 2019 & 2032
- Table 15: Spain Auto Injector Industry Revenue (Million) Forecast, by Application 2019 & 2032
- Table 16: Rest of Europe Auto Injector Industry Revenue (Million) Forecast, by Application 2019 & 2032
- Table 17: Global Auto Injector Industry Revenue Million Forecast, by Country 2019 & 2032
- Table 18: China Auto Injector Industry Revenue (Million) Forecast, by Application 2019 & 2032
- Table 19: Japan Auto Injector Industry Revenue (Million) Forecast, by Application 2019 & 2032
- Table 20: India Auto Injector Industry Revenue (Million) Forecast, by Application 2019 & 2032
- Table 21: Australia Auto Injector Industry Revenue (Million) Forecast, by Application 2019 & 2032
- Table 22: South Korea Auto Injector Industry Revenue (Million) Forecast, by Application 2019 & 2032
- Table 23: Rest of Asia Pacific Auto Injector Industry Revenue (Million) Forecast, by Application 2019 & 2032
- Table 24: Global Auto Injector Industry Revenue Million Forecast, by Country 2019 & 2032
- Table 25: GCC Auto Injector Industry Revenue (Million) Forecast, by Application 2019 & 2032
- Table 26: South Africa Auto Injector Industry Revenue (Million) Forecast, by Application 2019 & 2032
- Table 27: Rest of Middle East and Africa Auto Injector Industry Revenue (Million) Forecast, by Application 2019 & 2032
- Table 28: Global Auto Injector Industry Revenue Million Forecast, by Country 2019 & 2032
- Table 29: Brazil Auto Injector Industry Revenue (Million) Forecast, by Application 2019 & 2032
- Table 30: Argentina Auto Injector Industry Revenue (Million) Forecast, by Application 2019 & 2032
- Table 31: Rest of South America Auto Injector Industry Revenue (Million) Forecast, by Application 2019 & 2032
- Table 32: Global Auto Injector Industry Revenue Million Forecast, by Application 2019 & 2032
- Table 33: Global Auto Injector Industry Revenue Million Forecast, by Type 2019 & 2032
- Table 34: Global Auto Injector Industry Revenue Million Forecast, by End User 2019 & 2032
- Table 35: Global Auto Injector Industry Revenue Million Forecast, by Country 2019 & 2032
- Table 36: United States Auto Injector Industry Revenue (Million) Forecast, by Application 2019 & 2032
- Table 37: Canada Auto Injector Industry Revenue (Million) Forecast, by Application 2019 & 2032
- Table 38: Mexico Auto Injector Industry Revenue (Million) Forecast, by Application 2019 & 2032
- Table 39: Global Auto Injector Industry Revenue Million Forecast, by Application 2019 & 2032
- Table 40: Global Auto Injector Industry Revenue Million Forecast, by Type 2019 & 2032
- Table 41: Global Auto Injector Industry Revenue Million Forecast, by End User 2019 & 2032
- Table 42: Global Auto Injector Industry Revenue Million Forecast, by Country 2019 & 2032
- Table 43: Germany Auto Injector Industry Revenue (Million) Forecast, by Application 2019 & 2032
- Table 44: United Kingdom Auto Injector Industry Revenue (Million) Forecast, by Application 2019 & 2032
- Table 45: France Auto Injector Industry Revenue (Million) Forecast, by Application 2019 & 2032
- Table 46: Italy Auto Injector Industry Revenue (Million) Forecast, by Application 2019 & 2032
- Table 47: Spain Auto Injector Industry Revenue (Million) Forecast, by Application 2019 & 2032
- Table 48: Rest of Europe Auto Injector Industry Revenue (Million) Forecast, by Application 2019 & 2032
- Table 49: Global Auto Injector Industry Revenue Million Forecast, by Application 2019 & 2032
- Table 50: Global Auto Injector Industry Revenue Million Forecast, by Type 2019 & 2032
- Table 51: Global Auto Injector Industry Revenue Million Forecast, by End User 2019 & 2032
- Table 52: Global Auto Injector Industry Revenue Million Forecast, by Country 2019 & 2032
- Table 53: China Auto Injector Industry Revenue (Million) Forecast, by Application 2019 & 2032
- Table 54: Japan Auto Injector Industry Revenue (Million) Forecast, by Application 2019 & 2032
- Table 55: India Auto Injector Industry Revenue (Million) Forecast, by Application 2019 & 2032
- Table 56: Australia Auto Injector Industry Revenue (Million) Forecast, by Application 2019 & 2032
- Table 57: South Korea Auto Injector Industry Revenue (Million) Forecast, by Application 2019 & 2032
- Table 58: Rest of Asia Pacific Auto Injector Industry Revenue (Million) Forecast, by Application 2019 & 2032
- Table 59: Global Auto Injector Industry Revenue Million Forecast, by Application 2019 & 2032
- Table 60: Global Auto Injector Industry Revenue Million Forecast, by Type 2019 & 2032
- Table 61: Global Auto Injector Industry Revenue Million Forecast, by End User 2019 & 2032
- Table 62: Global Auto Injector Industry Revenue Million Forecast, by Country 2019 & 2032
- Table 63: GCC Auto Injector Industry Revenue (Million) Forecast, by Application 2019 & 2032
- Table 64: South Africa Auto Injector Industry Revenue (Million) Forecast, by Application 2019 & 2032
- Table 65: Rest of Middle East and Africa Auto Injector Industry Revenue (Million) Forecast, by Application 2019 & 2032
- Table 66: Global Auto Injector Industry Revenue Million Forecast, by Application 2019 & 2032
- Table 67: Global Auto Injector Industry Revenue Million Forecast, by Type 2019 & 2032
- Table 68: Global Auto Injector Industry Revenue Million Forecast, by End User 2019 & 2032
- Table 69: Global Auto Injector Industry Revenue Million Forecast, by Country 2019 & 2032
- Table 70: Brazil Auto Injector Industry Revenue (Million) Forecast, by Application 2019 & 2032
- Table 71: Argentina Auto Injector Industry Revenue (Million) Forecast, by Application 2019 & 2032
- Table 72: Rest of South America Auto Injector Industry Revenue (Million) Forecast, by Application 2019 & 2032
Frequently Asked Questions
1. What is the projected Compound Annual Growth Rate (CAGR) of the Auto Injector Industry?
The projected CAGR is approximately 16.05%.
2. Which companies are prominent players in the Auto Injector Industry?
Key companies in the market include Becton Dickinson and Company, Amgen, Eli Lilly, Novartis, Teva Pharmaceuticals, Biogen, AstraZeneca, Abbvie, Ypsomed*List Not Exhaustive, Bayer.
3. What are the main segments of the Auto Injector Industry?
The market segments include Application, Type, End User.
4. Can you provide details about the market size?
The market size is estimated to be USD 10.84 Million as of 2022.
5. What are some drivers contributing to market growth?
Increasing Demand for Convenience of Patients; Rising Incidence of Chronic and Lifestyle Diseases; Technological Advancements.
6. What are the notable trends driving market growth?
Rheumatoid Arthritis Expected to Hold Significant Market Share Over the Forecast Period.
7. Are there any restraints impacting market growth?
Preference for Alternative Drug Delivery Modes; Regulatory Hurdles.
8. Can you provide examples of recent developments in the market?
In May 2022, Jabil Healthcare, a division of Jabil Inc. launched the Qfinity autoinjector platform, a simple, reusable, and modular solution for subcutaneous (SC) drug self-administration, at a lower cost than market alternatives.
9. What pricing options are available for accessing the report?
Pricing options include single-user, multi-user, and enterprise licenses priced at USD 4750, USD 5250, and USD 8750 respectively.
10. Is the market size provided in terms of value or volume?
The market size is provided in terms of value, measured in Million.
11. Are there any specific market keywords associated with the report?
Yes, the market keyword associated with the report is "Auto Injector Industry," which aids in identifying and referencing the specific market segment covered.
12. How do I determine which pricing option suits my needs best?
The pricing options vary based on user requirements and access needs. Individual users may opt for single-user licenses, while businesses requiring broader access may choose multi-user or enterprise licenses for cost-effective access to the report.
13. Are there any additional resources or data provided in the Auto Injector Industry report?
While the report offers comprehensive insights, it's advisable to review the specific contents or supplementary materials provided to ascertain if additional resources or data are available.
14. How can I stay updated on further developments or reports in the Auto Injector Industry?
To stay informed about further developments, trends, and reports in the Auto Injector Industry, consider subscribing to industry newsletters, following relevant companies and organizations, or regularly checking reputable industry news sources and publications.
Methodology
Step 1 - Identification of Relevant Samples Size from Population Database


Step 2 - Approaches for Defining Global Market Size (Value, Volume* & Price*)

Note*: In applicable scenarios
Step 3 - Data Sources
Primary Research
- Web Analytics
- Survey Reports
- Research Institute
- Latest Research Reports
- Opinion Leaders
Secondary Research
- Annual Reports
- White Paper
- Latest Press Release
- Industry Association
- Paid Database
- Investor Presentations

Step 4 - Data Triangulation
Involves using different sources of information in order to increase the validity of a study
These sources are likely to be stakeholders in a program - participants, other researchers, program staff, other community members, and so on.
Then we put all data in single framework & apply various statistical tools to find out the dynamic on the market.
During the analysis stage, feedback from the stakeholder groups would be compared to determine areas of agreement as well as areas of divergence
