

Key Insights
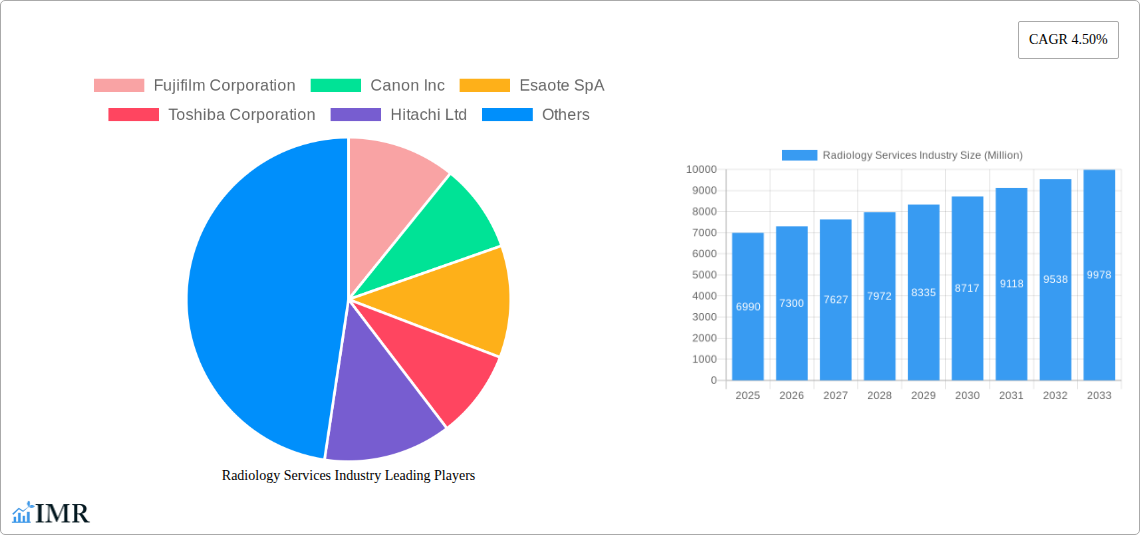
The global radiology services market, valued at $6.99 billion in 2025, is projected to experience robust growth, driven by a compound annual growth rate (CAGR) of 4.50% from 2025 to 2033. This expansion is fueled by several key factors. Technological advancements, such as the development of AI-powered diagnostic tools and minimally invasive procedures, are enhancing diagnostic accuracy and efficiency, leading to increased demand for radiology services. The aging global population, with its concomitant rise in chronic diseases requiring frequent imaging, further contributes to market growth. Moreover, the increasing prevalence of lifestyle-related diseases like cardiovascular conditions and cancer is driving the need for advanced imaging techniques. Expanding healthcare infrastructure in emerging economies, coupled with rising healthcare expenditure in developed nations, also plays a significant role. While challenges exist, such as high costs associated with advanced imaging technologies and the need for skilled professionals, the overall market outlook remains positive.
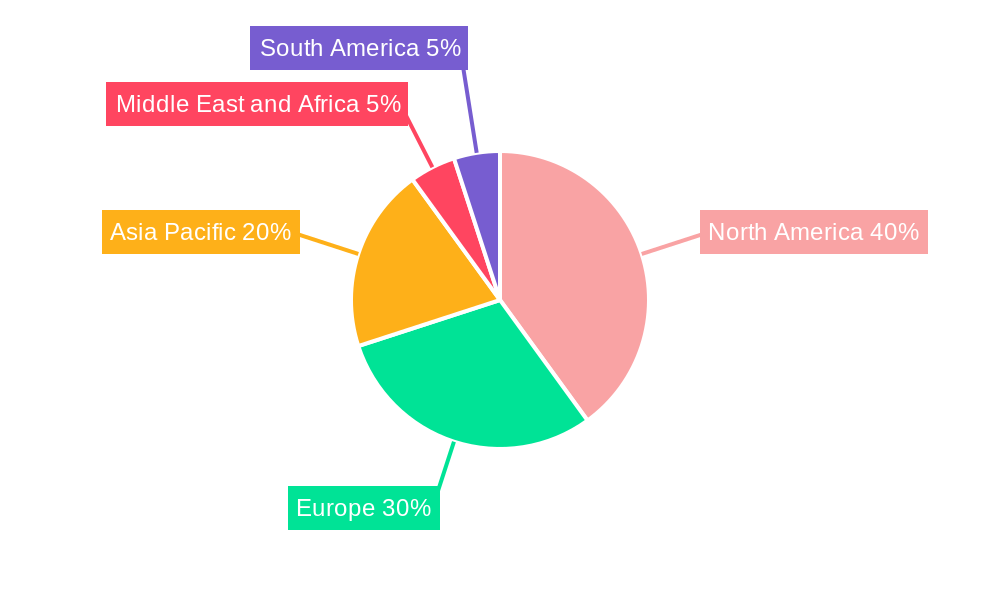
Growth is expected to be particularly strong in regions with developing healthcare systems and expanding populations. North America and Europe currently hold significant market shares, driven by established healthcare infrastructure and high adoption of advanced imaging technologies. However, Asia-Pacific is poised for substantial growth, fueled by rising disposable incomes, increasing awareness of preventive healthcare, and government initiatives to improve healthcare accessibility. The market segmentation reveals a diverse landscape. Computed tomography (CT) scanners and MRI machines represent substantial segments within the product type category, while standalone devices dominate the modality segment due to their versatility and ease of integration into various healthcare settings. Hospitals and diagnostic centers are the primary end-users, although the pediatric clinics segment shows significant growth potential. Key players like Fujifilm, Canon, Esaote, Toshiba, Philips, and Siemens are strategically investing in research and development to maintain their competitive edge, fostering innovation and driving the market forward.
Radiology Services Industry Market Report: 2019-2033
This comprehensive report provides a detailed analysis of the Radiology Services Industry, encompassing market dynamics, growth trends, competitive landscape, and future outlook. With a focus on key segments – Ultrasound, MRI, X-Ray, Computed Tomography Scanners, and other modalities – this report offers invaluable insights for industry professionals, investors, and strategic decision-makers. The study period covers 2019-2033, with 2025 as the base and estimated year.
Study Period: 2019-2033 Base Year: 2025 Estimated Year: 2025 Forecast Period: 2025-2033 Historical Period: 2019-2024
Radiology Services Industry Market Dynamics & Structure
The radiology services market is characterized by a moderately concentrated landscape, with key players like Fujifilm Corporation, Canon Inc, Esaote SpA, Toshiba Corporation, Hitachi Ltd, Koninklijke Philips N V, Samsung Medison Co Ltd, Analogic Corporation, Siemens AG, and General Electric Company competing for market share. The market size in 2025 is estimated at xx Million. Market concentration is influenced by technological innovation, particularly in AI-powered image analysis and minimally invasive procedures. Stringent regulatory frameworks concerning data privacy and device safety also shape market dynamics. Competitive pressures arise from the introduction of substitute technologies and alternative diagnostic methods.
- Market Concentration: Moderately concentrated, with top 10 players holding approximately 60% market share in 2025.
- Technological Innovation: AI-powered diagnostics, improved image resolution, and miniaturization of devices are key drivers.
- Regulatory Frameworks: Stringent regulations related to data privacy (GDPR, HIPAA) and device safety (FDA, CE mark) impact market access and growth.
- Competitive Substitutes: Advancements in nuclear medicine and other diagnostic techniques present competitive challenges.
- M&A Trends: A moderate level of mergers and acquisitions (M&A) activity observed, with xx deals concluded in the past 5 years, primarily focused on expanding product portfolios and geographical reach. The total value of these deals was approximately xx Million.
- End-User Demographics: Growing geriatric population and increasing prevalence of chronic diseases drive demand, particularly in developed economies.
Radiology Services Industry Growth Trends & Insights
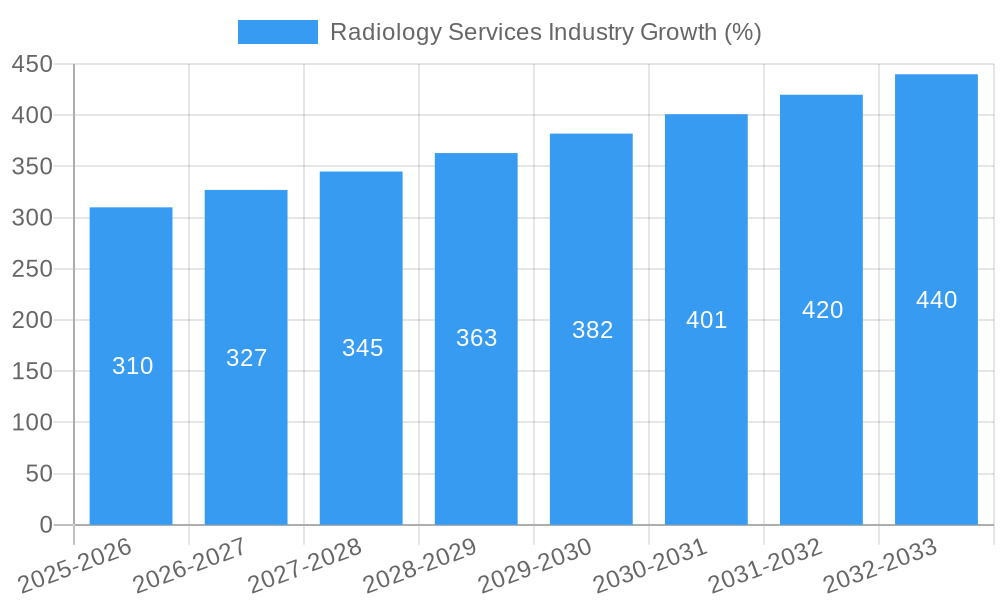
The global radiology services market experienced a CAGR of xx% during 2019-2024, driven by technological advancements, increasing adoption of advanced imaging techniques, and rising healthcare expenditure. The market size is projected to reach xx Million by 2033, exhibiting a CAGR of xx% during the forecast period (2025-2033). This growth is fueled by several factors including the rising prevalence of chronic diseases necessitating frequent diagnostic imaging, the growing adoption of minimally invasive procedures, and increasing investment in healthcare infrastructure, particularly in emerging economies. Technological advancements such as AI-powered image analysis and improved image quality further enhance market growth. Shifts in consumer behavior towards more convenient and accessible healthcare services are also contributing factors. Market penetration of advanced imaging technologies remains relatively high in developed regions, while emerging economies offer significant untapped potential for growth.
Dominant Regions, Countries, or Segments in Radiology Services Industry
North America currently holds the largest market share in the radiology services industry, driven by high healthcare expenditure, advanced healthcare infrastructure, and high adoption rates of advanced imaging technologies. Within product types, Computed Tomography (CT) scanners and MRI systems dominate the market due to their advanced diagnostic capabilities and wide-ranging applications. Hospitals remain the largest end-user segment, accounting for approximately 60% of market revenue in 2025. However, the diagnostic centers segment is expected to witness the fastest growth rate during the forecast period due to increasing demand for outpatient diagnostic services.
- Key Drivers:
- High healthcare expenditure in North America and Europe.
- Advanced healthcare infrastructure in developed regions.
- Growing adoption rates of advanced imaging technologies.
- Favorable government policies supporting healthcare infrastructure development.
- Dominance Factors:
- High prevalence of chronic diseases, driving diagnostic imaging demand.
- Strong presence of major players and robust healthcare systems in North America.
- Relatively high per capita healthcare expenditure.
- Growth Potential:
- Emerging markets in Asia-Pacific and Latin America exhibit significant untapped potential.
- Increasing healthcare awareness and improving affordability of advanced imaging services will drive growth.
Radiology Services Industry Product Landscape
The radiology services market showcases a diverse product landscape with continuous technological advancements. Recent innovations include AI-powered image analysis software for faster and more accurate diagnosis, portable ultrasound devices enhancing accessibility in remote areas, and improved MRI systems with higher resolution and faster scan times. These advancements are improving diagnostic accuracy, reducing procedure times, and improving patient comfort. Companies are focusing on unique selling propositions such as superior image quality, streamlined workflows, and integrated software solutions to gain a competitive edge.
Key Drivers, Barriers & Challenges in Radiology Services Industry
Key Drivers:
- Rising prevalence of chronic diseases.
- Technological advancements in imaging technologies.
- Increasing healthcare expenditure.
- Growing demand for minimally invasive procedures.
Challenges & Restraints:
- High cost of advanced imaging equipment.
- Stringent regulatory requirements.
- Skilled radiologist shortages in some regions.
- Reimbursement challenges and insurance coverage limitations impact affordability for patients. This accounts for approximately 15% of lost market potential, based on industry estimates.
Emerging Opportunities in Radiology Services Industry
- Tele-radiology: Expansion into remote areas via tele-radiology services.
- AI-powered diagnostics: Further development and integration of AI for improved accuracy and efficiency.
- Personalized medicine: Tailoring imaging strategies based on individual patient needs.
- Expansion into emerging markets: Untapped potential in developing countries.
Growth Accelerators in the Radiology Services Industry
Technological advancements, strategic partnerships to broaden market reach, and expansion into emerging markets are key long-term growth accelerators. Strategic alliances between device manufacturers and healthcare providers streamline workflow, improve service delivery and enhance patient care. Investments in research and development drive innovation, resulting in enhanced equipment capabilities and improved diagnostic accuracy, fueling market growth.
Key Players Shaping the Radiology Services Industry Market
- Fujifilm Corporation
- Canon Inc
- Esaote SpA
- Toshiba Corporation
- Hitachi Ltd
- Koninklijke Philips N V
- Samsung Medison Co Ltd
- Analogic Corporation
- Siemens AG
- General Electric Company
Notable Milestones in Radiology Services Industry Sector
- August 2022: Children's Hospital New Orleans and Cleveland Clinic announced a new affiliation to expand access to board-certified pediatric radiology experts. This significantly improves access to specialized care, potentially increasing the demand for pediatric radiology services.
- February 2022: The LEGO Foundation donated 600 LEGO MRI Scanners to hospitals worldwide. This initiative aims to reduce anxiety in children undergoing MRI scans, indirectly promoting wider acceptance and use of MRI technology.
In-Depth Radiology Services Industry Market Outlook
The radiology services market is poised for sustained growth, driven by technological advancements, increasing healthcare expenditure, and the growing prevalence of chronic diseases. Strategic partnerships, expansion into emerging markets, and the adoption of AI-powered diagnostics will continue to shape the market landscape. The focus will shift toward enhancing accessibility, affordability, and efficiency of radiology services, creating opportunities for innovation and market expansion. Significant growth is anticipated in emerging economies, offering substantial untapped potential for market players.
Radiology Services Industry Segmentation
-
1. Product Type
- 1.1. Ultrasound
- 1.2. MRI
- 1.3. X-ray
- 1.4. Computed Tomography Scanner
- 1.5. Other Product Types
-
2. Modality
- 2.1. Standalone Devices
- 2.2. Table-top Devices
- 2.3. Portable Devices
-
3. End User
- 3.1. Pediatric Clinics
- 3.2. Diagnostic Centers
- 3.3. Hospitals
- 3.4. Other End Users
Radiology Services Industry Segmentation By Geography
-
1. North America
- 1.1. United States
- 1.2. Canada
- 1.3. Mexico
-
2. Europe
- 2.1. Germany
- 2.2. United Kingdom
- 2.3. France
- 2.4. Italy
- 2.5. Spain
- 2.6. Rest of Europe
-
3. Asia Pacific
- 3.1. China
- 3.2. Japan
- 3.3. India
- 3.4. Australia
- 3.5. South Korea
- 3.6. Rest of Asia Pacific
-
4. Middle East and Africa
- 4.1. GCC
- 4.2. South Africa
- 4.3. Rest of Middle East and Africa
-
5. South America
- 5.1. Brazil
- 5.2. Argentina
- 5.3. Rest of South America
Radiology Services Industry REPORT HIGHLIGHTS
| Aspects | Details |
|---|---|
| Study Period | 2019-2033 |
| Base Year | 2024 |
| Estimated Year | 2025 |
| Forecast Period | 2025-2033 |
| Historical Period | 2019-2024 |
| Growth Rate | CAGR of 4.50% from 2019-2033 |
| Segmentation |
|
Table of Contents
- 1. Introduction
- 1.1. Research Scope
- 1.2. Market Segmentation
- 1.3. Research Methodology
- 1.4. Definitions and Assumptions
- 2. Executive Summary
- 2.1. Introduction
- 3. Market Dynamics
- 3.1. Introduction
- 3.2. Market Drivers
- 3.2.1 Increasing Burden of Pediatric Diseases
- 3.2.2 such as Coronary Heart Failures
- 3.2.3 Pneumonia
- 3.2.4 and Rise in Affordability; Increased Government Initiatives and R&D Activities to Develop Advanced Pediatric Radiology Devices
- 3.3. Market Restrains
- 3.3.1. Ethical Issues in Pediatric Research; Lack of Skilled Healthcare Professionals
- 3.4. Market Trends
- 3.4.1. Magnetic Resonance Imaging (MRI) Segment is Expected to Hold the Major Market Share in the Pediatric Radiology Market
- 4. Market Factor Analysis
- 4.1. Porters Five Forces
- 4.2. Supply/Value Chain
- 4.3. PESTEL analysis
- 4.4. Market Entropy
- 4.5. Patent/Trademark Analysis
- 5. Global Radiology Services Industry Analysis, Insights and Forecast, 2019-2031
- 5.1. Market Analysis, Insights and Forecast - by Product Type
- 5.1.1. Ultrasound
- 5.1.2. MRI
- 5.1.3. X-ray
- 5.1.4. Computed Tomography Scanner
- 5.1.5. Other Product Types
- 5.2. Market Analysis, Insights and Forecast - by Modality
- 5.2.1. Standalone Devices
- 5.2.2. Table-top Devices
- 5.2.3. Portable Devices
- 5.3. Market Analysis, Insights and Forecast - by End User
- 5.3.1. Pediatric Clinics
- 5.3.2. Diagnostic Centers
- 5.3.3. Hospitals
- 5.3.4. Other End Users
- 5.4. Market Analysis, Insights and Forecast - by Region
- 5.4.1. North America
- 5.4.2. Europe
- 5.4.3. Asia Pacific
- 5.4.4. Middle East and Africa
- 5.4.5. South America
- 5.1. Market Analysis, Insights and Forecast - by Product Type
- 6. North America Radiology Services Industry Analysis, Insights and Forecast, 2019-2031
- 6.1. Market Analysis, Insights and Forecast - by Product Type
- 6.1.1. Ultrasound
- 6.1.2. MRI
- 6.1.3. X-ray
- 6.1.4. Computed Tomography Scanner
- 6.1.5. Other Product Types
- 6.2. Market Analysis, Insights and Forecast - by Modality
- 6.2.1. Standalone Devices
- 6.2.2. Table-top Devices
- 6.2.3. Portable Devices
- 6.3. Market Analysis, Insights and Forecast - by End User
- 6.3.1. Pediatric Clinics
- 6.3.2. Diagnostic Centers
- 6.3.3. Hospitals
- 6.3.4. Other End Users
- 6.1. Market Analysis, Insights and Forecast - by Product Type
- 7. Europe Radiology Services Industry Analysis, Insights and Forecast, 2019-2031
- 7.1. Market Analysis, Insights and Forecast - by Product Type
- 7.1.1. Ultrasound
- 7.1.2. MRI
- 7.1.3. X-ray
- 7.1.4. Computed Tomography Scanner
- 7.1.5. Other Product Types
- 7.2. Market Analysis, Insights and Forecast - by Modality
- 7.2.1. Standalone Devices
- 7.2.2. Table-top Devices
- 7.2.3. Portable Devices
- 7.3. Market Analysis, Insights and Forecast - by End User
- 7.3.1. Pediatric Clinics
- 7.3.2. Diagnostic Centers
- 7.3.3. Hospitals
- 7.3.4. Other End Users
- 7.1. Market Analysis, Insights and Forecast - by Product Type
- 8. Asia Pacific Radiology Services Industry Analysis, Insights and Forecast, 2019-2031
- 8.1. Market Analysis, Insights and Forecast - by Product Type
- 8.1.1. Ultrasound
- 8.1.2. MRI
- 8.1.3. X-ray
- 8.1.4. Computed Tomography Scanner
- 8.1.5. Other Product Types
- 8.2. Market Analysis, Insights and Forecast - by Modality
- 8.2.1. Standalone Devices
- 8.2.2. Table-top Devices
- 8.2.3. Portable Devices
- 8.3. Market Analysis, Insights and Forecast - by End User
- 8.3.1. Pediatric Clinics
- 8.3.2. Diagnostic Centers
- 8.3.3. Hospitals
- 8.3.4. Other End Users
- 8.1. Market Analysis, Insights and Forecast - by Product Type
- 9. Middle East and Africa Radiology Services Industry Analysis, Insights and Forecast, 2019-2031
- 9.1. Market Analysis, Insights and Forecast - by Product Type
- 9.1.1. Ultrasound
- 9.1.2. MRI
- 9.1.3. X-ray
- 9.1.4. Computed Tomography Scanner
- 9.1.5. Other Product Types
- 9.2. Market Analysis, Insights and Forecast - by Modality
- 9.2.1. Standalone Devices
- 9.2.2. Table-top Devices
- 9.2.3. Portable Devices
- 9.3. Market Analysis, Insights and Forecast - by End User
- 9.3.1. Pediatric Clinics
- 9.3.2. Diagnostic Centers
- 9.3.3. Hospitals
- 9.3.4. Other End Users
- 9.1. Market Analysis, Insights and Forecast - by Product Type
- 10. South America Radiology Services Industry Analysis, Insights and Forecast, 2019-2031
- 10.1. Market Analysis, Insights and Forecast - by Product Type
- 10.1.1. Ultrasound
- 10.1.2. MRI
- 10.1.3. X-ray
- 10.1.4. Computed Tomography Scanner
- 10.1.5. Other Product Types
- 10.2. Market Analysis, Insights and Forecast - by Modality
- 10.2.1. Standalone Devices
- 10.2.2. Table-top Devices
- 10.2.3. Portable Devices
- 10.3. Market Analysis, Insights and Forecast - by End User
- 10.3.1. Pediatric Clinics
- 10.3.2. Diagnostic Centers
- 10.3.3. Hospitals
- 10.3.4. Other End Users
- 10.1. Market Analysis, Insights and Forecast - by Product Type
- 11. North America Radiology Services Industry Analysis, Insights and Forecast, 2019-2031
- 11.1. Market Analysis, Insights and Forecast - By Country/Sub-region
- 11.1.1 United States
- 11.1.2 Canada
- 11.1.3 Mexico
- 12. Europe Radiology Services Industry Analysis, Insights and Forecast, 2019-2031
- 12.1. Market Analysis, Insights and Forecast - By Country/Sub-region
- 12.1.1 Germany
- 12.1.2 United Kingdom
- 12.1.3 France
- 12.1.4 Italy
- 12.1.5 Spain
- 12.1.6 Rest of Europe
- 13. Asia Pacific Radiology Services Industry Analysis, Insights and Forecast, 2019-2031
- 13.1. Market Analysis, Insights and Forecast - By Country/Sub-region
- 13.1.1 China
- 13.1.2 Japan
- 13.1.3 India
- 13.1.4 Australia
- 13.1.5 South Korea
- 13.1.6 Rest of Asia Pacific
- 14. Middle East and Africa Radiology Services Industry Analysis, Insights and Forecast, 2019-2031
- 14.1. Market Analysis, Insights and Forecast - By Country/Sub-region
- 14.1.1 GCC
- 14.1.2 South Africa
- 14.1.3 Rest of Middle East and Africa
- 15. South America Radiology Services Industry Analysis, Insights and Forecast, 2019-2031
- 15.1. Market Analysis, Insights and Forecast - By Country/Sub-region
- 15.1.1 Brazil
- 15.1.2 Argentina
- 15.1.3 Rest of South America
- 16. Competitive Analysis
- 16.1. Global Market Share Analysis 2024
- 16.2. Company Profiles
- 16.2.1 Fujifilm Corporation
- 16.2.1.1. Overview
- 16.2.1.2. Products
- 16.2.1.3. SWOT Analysis
- 16.2.1.4. Recent Developments
- 16.2.1.5. Financials (Based on Availability)
- 16.2.2 Canon Inc
- 16.2.2.1. Overview
- 16.2.2.2. Products
- 16.2.2.3. SWOT Analysis
- 16.2.2.4. Recent Developments
- 16.2.2.5. Financials (Based on Availability)
- 16.2.3 Esaote SpA
- 16.2.3.1. Overview
- 16.2.3.2. Products
- 16.2.3.3. SWOT Analysis
- 16.2.3.4. Recent Developments
- 16.2.3.5. Financials (Based on Availability)
- 16.2.4 Toshiba Corporation
- 16.2.4.1. Overview
- 16.2.4.2. Products
- 16.2.4.3. SWOT Analysis
- 16.2.4.4. Recent Developments
- 16.2.4.5. Financials (Based on Availability)
- 16.2.5 Hitachi Ltd
- 16.2.5.1. Overview
- 16.2.5.2. Products
- 16.2.5.3. SWOT Analysis
- 16.2.5.4. Recent Developments
- 16.2.5.5. Financials (Based on Availability)
- 16.2.6 Koninklijke Philips N V
- 16.2.6.1. Overview
- 16.2.6.2. Products
- 16.2.6.3. SWOT Analysis
- 16.2.6.4. Recent Developments
- 16.2.6.5. Financials (Based on Availability)
- 16.2.7 Samsung Medison Co Ltd
- 16.2.7.1. Overview
- 16.2.7.2. Products
- 16.2.7.3. SWOT Analysis
- 16.2.7.4. Recent Developments
- 16.2.7.5. Financials (Based on Availability)
- 16.2.8 Analogic Corporation
- 16.2.8.1. Overview
- 16.2.8.2. Products
- 16.2.8.3. SWOT Analysis
- 16.2.8.4. Recent Developments
- 16.2.8.5. Financials (Based on Availability)
- 16.2.9 Siemens AG
- 16.2.9.1. Overview
- 16.2.9.2. Products
- 16.2.9.3. SWOT Analysis
- 16.2.9.4. Recent Developments
- 16.2.9.5. Financials (Based on Availability)
- 16.2.10 General Electric Company
- 16.2.10.1. Overview
- 16.2.10.2. Products
- 16.2.10.3. SWOT Analysis
- 16.2.10.4. Recent Developments
- 16.2.10.5. Financials (Based on Availability)
- 16.2.1 Fujifilm Corporation
List of Figures
- Figure 1: Global Radiology Services Industry Revenue Breakdown (Million, %) by Region 2024 & 2032
- Figure 2: North America Radiology Services Industry Revenue (Million), by Country 2024 & 2032
- Figure 3: North America Radiology Services Industry Revenue Share (%), by Country 2024 & 2032
- Figure 4: Europe Radiology Services Industry Revenue (Million), by Country 2024 & 2032
- Figure 5: Europe Radiology Services Industry Revenue Share (%), by Country 2024 & 2032
- Figure 6: Asia Pacific Radiology Services Industry Revenue (Million), by Country 2024 & 2032
- Figure 7: Asia Pacific Radiology Services Industry Revenue Share (%), by Country 2024 & 2032
- Figure 8: Middle East and Africa Radiology Services Industry Revenue (Million), by Country 2024 & 2032
- Figure 9: Middle East and Africa Radiology Services Industry Revenue Share (%), by Country 2024 & 2032
- Figure 10: South America Radiology Services Industry Revenue (Million), by Country 2024 & 2032
- Figure 11: South America Radiology Services Industry Revenue Share (%), by Country 2024 & 2032
- Figure 12: North America Radiology Services Industry Revenue (Million), by Product Type 2024 & 2032
- Figure 13: North America Radiology Services Industry Revenue Share (%), by Product Type 2024 & 2032
- Figure 14: North America Radiology Services Industry Revenue (Million), by Modality 2024 & 2032
- Figure 15: North America Radiology Services Industry Revenue Share (%), by Modality 2024 & 2032
- Figure 16: North America Radiology Services Industry Revenue (Million), by End User 2024 & 2032
- Figure 17: North America Radiology Services Industry Revenue Share (%), by End User 2024 & 2032
- Figure 18: North America Radiology Services Industry Revenue (Million), by Country 2024 & 2032
- Figure 19: North America Radiology Services Industry Revenue Share (%), by Country 2024 & 2032
- Figure 20: Europe Radiology Services Industry Revenue (Million), by Product Type 2024 & 2032
- Figure 21: Europe Radiology Services Industry Revenue Share (%), by Product Type 2024 & 2032
- Figure 22: Europe Radiology Services Industry Revenue (Million), by Modality 2024 & 2032
- Figure 23: Europe Radiology Services Industry Revenue Share (%), by Modality 2024 & 2032
- Figure 24: Europe Radiology Services Industry Revenue (Million), by End User 2024 & 2032
- Figure 25: Europe Radiology Services Industry Revenue Share (%), by End User 2024 & 2032
- Figure 26: Europe Radiology Services Industry Revenue (Million), by Country 2024 & 2032
- Figure 27: Europe Radiology Services Industry Revenue Share (%), by Country 2024 & 2032
- Figure 28: Asia Pacific Radiology Services Industry Revenue (Million), by Product Type 2024 & 2032
- Figure 29: Asia Pacific Radiology Services Industry Revenue Share (%), by Product Type 2024 & 2032
- Figure 30: Asia Pacific Radiology Services Industry Revenue (Million), by Modality 2024 & 2032
- Figure 31: Asia Pacific Radiology Services Industry Revenue Share (%), by Modality 2024 & 2032
- Figure 32: Asia Pacific Radiology Services Industry Revenue (Million), by End User 2024 & 2032
- Figure 33: Asia Pacific Radiology Services Industry Revenue Share (%), by End User 2024 & 2032
- Figure 34: Asia Pacific Radiology Services Industry Revenue (Million), by Country 2024 & 2032
- Figure 35: Asia Pacific Radiology Services Industry Revenue Share (%), by Country 2024 & 2032
- Figure 36: Middle East and Africa Radiology Services Industry Revenue (Million), by Product Type 2024 & 2032
- Figure 37: Middle East and Africa Radiology Services Industry Revenue Share (%), by Product Type 2024 & 2032
- Figure 38: Middle East and Africa Radiology Services Industry Revenue (Million), by Modality 2024 & 2032
- Figure 39: Middle East and Africa Radiology Services Industry Revenue Share (%), by Modality 2024 & 2032
- Figure 40: Middle East and Africa Radiology Services Industry Revenue (Million), by End User 2024 & 2032
- Figure 41: Middle East and Africa Radiology Services Industry Revenue Share (%), by End User 2024 & 2032
- Figure 42: Middle East and Africa Radiology Services Industry Revenue (Million), by Country 2024 & 2032
- Figure 43: Middle East and Africa Radiology Services Industry Revenue Share (%), by Country 2024 & 2032
- Figure 44: South America Radiology Services Industry Revenue (Million), by Product Type 2024 & 2032
- Figure 45: South America Radiology Services Industry Revenue Share (%), by Product Type 2024 & 2032
- Figure 46: South America Radiology Services Industry Revenue (Million), by Modality 2024 & 2032
- Figure 47: South America Radiology Services Industry Revenue Share (%), by Modality 2024 & 2032
- Figure 48: South America Radiology Services Industry Revenue (Million), by End User 2024 & 2032
- Figure 49: South America Radiology Services Industry Revenue Share (%), by End User 2024 & 2032
- Figure 50: South America Radiology Services Industry Revenue (Million), by Country 2024 & 2032
- Figure 51: South America Radiology Services Industry Revenue Share (%), by Country 2024 & 2032
List of Tables
- Table 1: Global Radiology Services Industry Revenue Million Forecast, by Region 2019 & 2032
- Table 2: Global Radiology Services Industry Revenue Million Forecast, by Product Type 2019 & 2032
- Table 3: Global Radiology Services Industry Revenue Million Forecast, by Modality 2019 & 2032
- Table 4: Global Radiology Services Industry Revenue Million Forecast, by End User 2019 & 2032
- Table 5: Global Radiology Services Industry Revenue Million Forecast, by Region 2019 & 2032
- Table 6: Global Radiology Services Industry Revenue Million Forecast, by Country 2019 & 2032
- Table 7: United States Radiology Services Industry Revenue (Million) Forecast, by Application 2019 & 2032
- Table 8: Canada Radiology Services Industry Revenue (Million) Forecast, by Application 2019 & 2032
- Table 9: Mexico Radiology Services Industry Revenue (Million) Forecast, by Application 2019 & 2032
- Table 10: Global Radiology Services Industry Revenue Million Forecast, by Country 2019 & 2032
- Table 11: Germany Radiology Services Industry Revenue (Million) Forecast, by Application 2019 & 2032
- Table 12: United Kingdom Radiology Services Industry Revenue (Million) Forecast, by Application 2019 & 2032
- Table 13: France Radiology Services Industry Revenue (Million) Forecast, by Application 2019 & 2032
- Table 14: Italy Radiology Services Industry Revenue (Million) Forecast, by Application 2019 & 2032
- Table 15: Spain Radiology Services Industry Revenue (Million) Forecast, by Application 2019 & 2032
- Table 16: Rest of Europe Radiology Services Industry Revenue (Million) Forecast, by Application 2019 & 2032
- Table 17: Global Radiology Services Industry Revenue Million Forecast, by Country 2019 & 2032
- Table 18: China Radiology Services Industry Revenue (Million) Forecast, by Application 2019 & 2032
- Table 19: Japan Radiology Services Industry Revenue (Million) Forecast, by Application 2019 & 2032
- Table 20: India Radiology Services Industry Revenue (Million) Forecast, by Application 2019 & 2032
- Table 21: Australia Radiology Services Industry Revenue (Million) Forecast, by Application 2019 & 2032
- Table 22: South Korea Radiology Services Industry Revenue (Million) Forecast, by Application 2019 & 2032
- Table 23: Rest of Asia Pacific Radiology Services Industry Revenue (Million) Forecast, by Application 2019 & 2032
- Table 24: Global Radiology Services Industry Revenue Million Forecast, by Country 2019 & 2032
- Table 25: GCC Radiology Services Industry Revenue (Million) Forecast, by Application 2019 & 2032
- Table 26: South Africa Radiology Services Industry Revenue (Million) Forecast, by Application 2019 & 2032
- Table 27: Rest of Middle East and Africa Radiology Services Industry Revenue (Million) Forecast, by Application 2019 & 2032
- Table 28: Global Radiology Services Industry Revenue Million Forecast, by Country 2019 & 2032
- Table 29: Brazil Radiology Services Industry Revenue (Million) Forecast, by Application 2019 & 2032
- Table 30: Argentina Radiology Services Industry Revenue (Million) Forecast, by Application 2019 & 2032
- Table 31: Rest of South America Radiology Services Industry Revenue (Million) Forecast, by Application 2019 & 2032
- Table 32: Global Radiology Services Industry Revenue Million Forecast, by Product Type 2019 & 2032
- Table 33: Global Radiology Services Industry Revenue Million Forecast, by Modality 2019 & 2032
- Table 34: Global Radiology Services Industry Revenue Million Forecast, by End User 2019 & 2032
- Table 35: Global Radiology Services Industry Revenue Million Forecast, by Country 2019 & 2032
- Table 36: United States Radiology Services Industry Revenue (Million) Forecast, by Application 2019 & 2032
- Table 37: Canada Radiology Services Industry Revenue (Million) Forecast, by Application 2019 & 2032
- Table 38: Mexico Radiology Services Industry Revenue (Million) Forecast, by Application 2019 & 2032
- Table 39: Global Radiology Services Industry Revenue Million Forecast, by Product Type 2019 & 2032
- Table 40: Global Radiology Services Industry Revenue Million Forecast, by Modality 2019 & 2032
- Table 41: Global Radiology Services Industry Revenue Million Forecast, by End User 2019 & 2032
- Table 42: Global Radiology Services Industry Revenue Million Forecast, by Country 2019 & 2032
- Table 43: Germany Radiology Services Industry Revenue (Million) Forecast, by Application 2019 & 2032
- Table 44: United Kingdom Radiology Services Industry Revenue (Million) Forecast, by Application 2019 & 2032
- Table 45: France Radiology Services Industry Revenue (Million) Forecast, by Application 2019 & 2032
- Table 46: Italy Radiology Services Industry Revenue (Million) Forecast, by Application 2019 & 2032
- Table 47: Spain Radiology Services Industry Revenue (Million) Forecast, by Application 2019 & 2032
- Table 48: Rest of Europe Radiology Services Industry Revenue (Million) Forecast, by Application 2019 & 2032
- Table 49: Global Radiology Services Industry Revenue Million Forecast, by Product Type 2019 & 2032
- Table 50: Global Radiology Services Industry Revenue Million Forecast, by Modality 2019 & 2032
- Table 51: Global Radiology Services Industry Revenue Million Forecast, by End User 2019 & 2032
- Table 52: Global Radiology Services Industry Revenue Million Forecast, by Country 2019 & 2032
- Table 53: China Radiology Services Industry Revenue (Million) Forecast, by Application 2019 & 2032
- Table 54: Japan Radiology Services Industry Revenue (Million) Forecast, by Application 2019 & 2032
- Table 55: India Radiology Services Industry Revenue (Million) Forecast, by Application 2019 & 2032
- Table 56: Australia Radiology Services Industry Revenue (Million) Forecast, by Application 2019 & 2032
- Table 57: South Korea Radiology Services Industry Revenue (Million) Forecast, by Application 2019 & 2032
- Table 58: Rest of Asia Pacific Radiology Services Industry Revenue (Million) Forecast, by Application 2019 & 2032
- Table 59: Global Radiology Services Industry Revenue Million Forecast, by Product Type 2019 & 2032
- Table 60: Global Radiology Services Industry Revenue Million Forecast, by Modality 2019 & 2032
- Table 61: Global Radiology Services Industry Revenue Million Forecast, by End User 2019 & 2032
- Table 62: Global Radiology Services Industry Revenue Million Forecast, by Country 2019 & 2032
- Table 63: GCC Radiology Services Industry Revenue (Million) Forecast, by Application 2019 & 2032
- Table 64: South Africa Radiology Services Industry Revenue (Million) Forecast, by Application 2019 & 2032
- Table 65: Rest of Middle East and Africa Radiology Services Industry Revenue (Million) Forecast, by Application 2019 & 2032
- Table 66: Global Radiology Services Industry Revenue Million Forecast, by Product Type 2019 & 2032
- Table 67: Global Radiology Services Industry Revenue Million Forecast, by Modality 2019 & 2032
- Table 68: Global Radiology Services Industry Revenue Million Forecast, by End User 2019 & 2032
- Table 69: Global Radiology Services Industry Revenue Million Forecast, by Country 2019 & 2032
- Table 70: Brazil Radiology Services Industry Revenue (Million) Forecast, by Application 2019 & 2032
- Table 71: Argentina Radiology Services Industry Revenue (Million) Forecast, by Application 2019 & 2032
- Table 72: Rest of South America Radiology Services Industry Revenue (Million) Forecast, by Application 2019 & 2032
Frequently Asked Questions
1. What is the projected Compound Annual Growth Rate (CAGR) of the Radiology Services Industry?
The projected CAGR is approximately 4.50%.
2. Which companies are prominent players in the Radiology Services Industry?
Key companies in the market include Fujifilm Corporation, Canon Inc, Esaote SpA, Toshiba Corporation, Hitachi Ltd, Koninklijke Philips N V, Samsung Medison Co Ltd, Analogic Corporation, Siemens AG, General Electric Company.
3. What are the main segments of the Radiology Services Industry?
The market segments include Product Type, Modality, End User.
4. Can you provide details about the market size?
The market size is estimated to be USD 6.99 Million as of 2022.
5. What are some drivers contributing to market growth?
Increasing Burden of Pediatric Diseases. such as Coronary Heart Failures. Pneumonia. and Rise in Affordability; Increased Government Initiatives and R&D Activities to Develop Advanced Pediatric Radiology Devices.
6. What are the notable trends driving market growth?
Magnetic Resonance Imaging (MRI) Segment is Expected to Hold the Major Market Share in the Pediatric Radiology Market.
7. Are there any restraints impacting market growth?
Ethical Issues in Pediatric Research; Lack of Skilled Healthcare Professionals.
8. Can you provide examples of recent developments in the market?
August 2022: Children's Hospital New Orleans and Cleveland Clinic announced a new affiliation to expand access to board-certified pediatric radiology experts for children and families in New Orleans and Louisiana.
9. What pricing options are available for accessing the report?
Pricing options include single-user, multi-user, and enterprise licenses priced at USD 4750, USD 5250, and USD 8750 respectively.
10. Is the market size provided in terms of value or volume?
The market size is provided in terms of value, measured in Million.
11. Are there any specific market keywords associated with the report?
Yes, the market keyword associated with the report is "Radiology Services Industry," which aids in identifying and referencing the specific market segment covered.
12. How do I determine which pricing option suits my needs best?
The pricing options vary based on user requirements and access needs. Individual users may opt for single-user licenses, while businesses requiring broader access may choose multi-user or enterprise licenses for cost-effective access to the report.
13. Are there any additional resources or data provided in the Radiology Services Industry report?
While the report offers comprehensive insights, it's advisable to review the specific contents or supplementary materials provided to ascertain if additional resources or data are available.
14. How can I stay updated on further developments or reports in the Radiology Services Industry?
To stay informed about further developments, trends, and reports in the Radiology Services Industry, consider subscribing to industry newsletters, following relevant companies and organizations, or regularly checking reputable industry news sources and publications.
Methodology
Step 1 - Identification of Relevant Samples Size from Population Database


Step 2 - Approaches for Defining Global Market Size (Value, Volume* & Price*)

Note*: In applicable scenarios
Step 3 - Data Sources
Primary Research
- Web Analytics
- Survey Reports
- Research Institute
- Latest Research Reports
- Opinion Leaders
Secondary Research
- Annual Reports
- White Paper
- Latest Press Release
- Industry Association
- Paid Database
- Investor Presentations

Step 4 - Data Triangulation
Involves using different sources of information in order to increase the validity of a study
These sources are likely to be stakeholders in a program - participants, other researchers, program staff, other community members, and so on.
Then we put all data in single framework & apply various statistical tools to find out the dynamic on the market.
During the analysis stage, feedback from the stakeholder groups would be compared to determine areas of agreement as well as areas of divergence
