

Key Insights
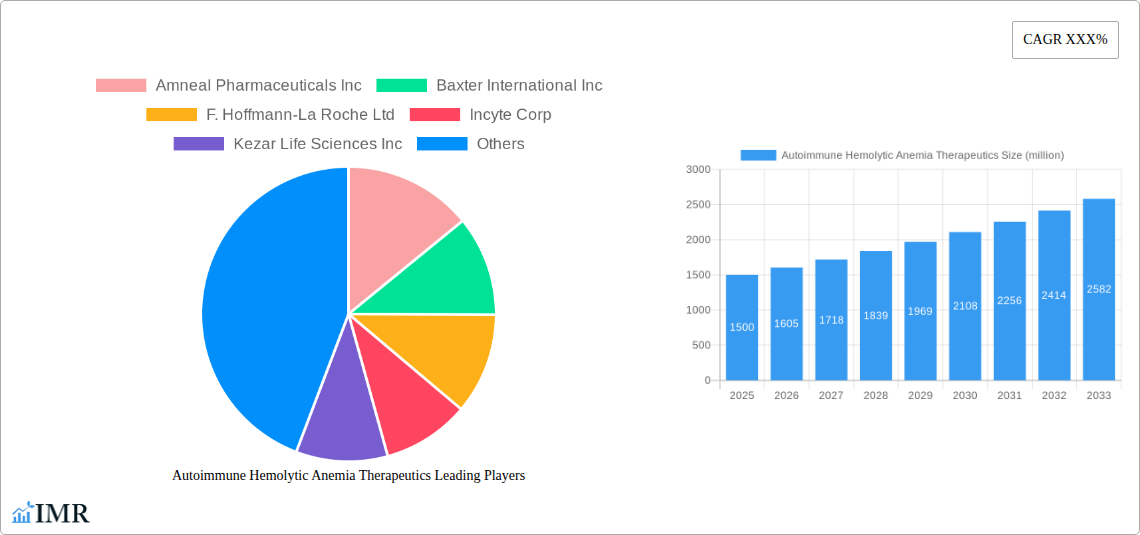
The Autoimmune Hemolytic Anemia (AIHA) therapeutics market is experiencing robust growth, driven by increasing prevalence of AIHA, advancements in treatment modalities, and a rising awareness among healthcare professionals and patients. The market, estimated at $1.5 billion in 2025, is projected to exhibit a Compound Annual Growth Rate (CAGR) of 7% from 2025 to 2033, reaching approximately $2.7 billion by 2033. This growth is fueled by several key factors. Firstly, the aging global population contributes significantly to the increasing incidence of AIHA, as age is a primary risk factor. Secondly, the development and market entry of novel therapies, including targeted biologics and immunomodulators, offer improved efficacy and safety profiles compared to traditional treatments, thereby driving market expansion. Furthermore, ongoing research and development efforts are focused on personalized medicine approaches, leading to more effective and less toxic treatment options tailored to individual patient needs. However, the market faces challenges such as high treatment costs, potential side effects associated with some therapies, and variations in healthcare access across different regions. The competitive landscape is marked by the presence of both established pharmaceutical companies like Pfizer and Sanofi, and emerging biotech companies such as Kezar Life Sciences, reflecting a dynamic market characterized by both innovation and competition.
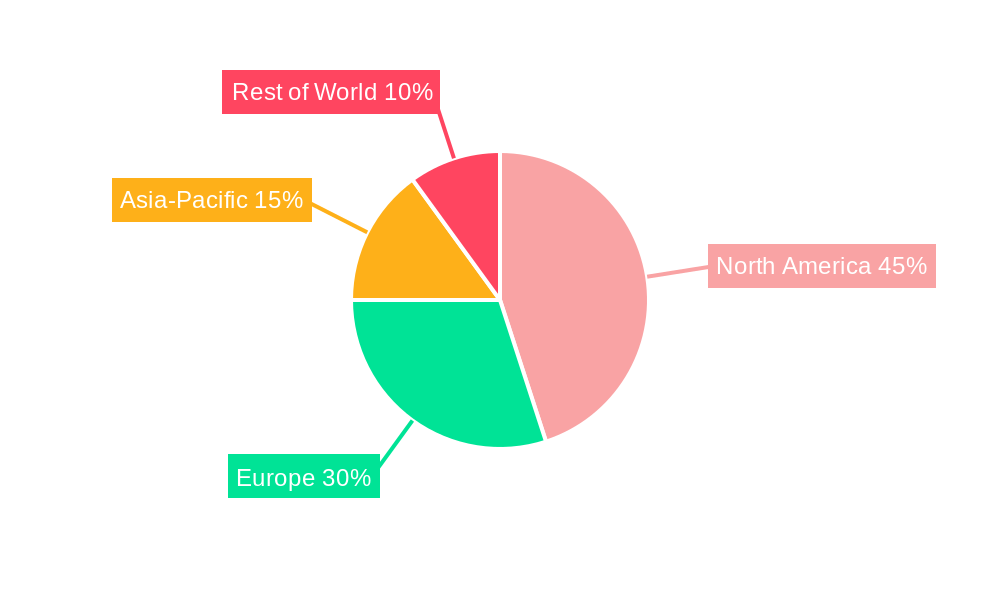
The market segmentation reflects the diverse approaches to AIHA treatment. While corticosteroids remain a cornerstone of initial management, the market is witnessing a shift towards more targeted therapies. This is driving demand for biologics, like Rituximab and other newer agents, addressing specific disease mechanisms. Geographic segmentation reveals variations in market size and growth potential, with North America and Europe currently dominating due to higher healthcare expenditure and established healthcare infrastructure. However, emerging markets in Asia-Pacific and Latin America are anticipated to show substantial growth in the forecast period due to increasing healthcare awareness and improved access to advanced medical technologies. The leading companies are actively engaged in expanding their product portfolios, pursuing strategic partnerships, and focusing on clinical trials to strengthen their market positions. The continued focus on innovation and improved patient outcomes will be crucial for sustaining the future growth of the AIHA therapeutics market.
Autoimmune Hemolytic Anemia Therapeutics Market Report: 2019-2033
This comprehensive report provides an in-depth analysis of the Autoimmune Hemolytic Anemia (AIHA) Therapeutics market, encompassing market dynamics, growth trends, regional analysis, product landscape, key players, and future outlook. The study period covers 2019-2033, with 2025 as the base and estimated year, and a forecast period of 2025-2033. This report is crucial for pharmaceutical companies, investors, researchers, and healthcare professionals seeking a detailed understanding of this vital therapeutic area. The parent market is the Hematological Diseases Therapeutics Market, and the child market is specifically AIHA treatments.
Autoimmune Hemolytic Anemia Therapeutics Market Dynamics & Structure
This section analyzes the competitive landscape, technological advancements, regulatory influences, and market trends within the AIHA therapeutics market. The market exhibits a moderately concentrated structure, with a few major players holding significant market share. Technological innovation, particularly in targeted therapies and biologics, is a key driver. Stringent regulatory approvals and reimbursement policies impact market entry and growth. The emergence of biosimilars presents both opportunities and challenges. Mergers and acquisitions (M&A) activity has been moderate, with strategic partnerships shaping the competitive landscape.
- Market Concentration: Moderately concentrated, with the top 5 players holding approximately xx% of the market share in 2025.
- Technological Innovation: Focus on targeted therapies, antibody-drug conjugates, and gene therapies are driving innovation.
- Regulatory Framework: Stringent regulatory approvals and pricing policies impact market access.
- Competitive Landscape: Intense competition among established players and emerging biotech companies.
- M&A Activity: xx major M&A deals in the AIHA therapeutics space between 2019 and 2024, totaling approximately $xx million.
Autoimmune Hemolytic Anemia Therapeutics Growth Trends & Insights
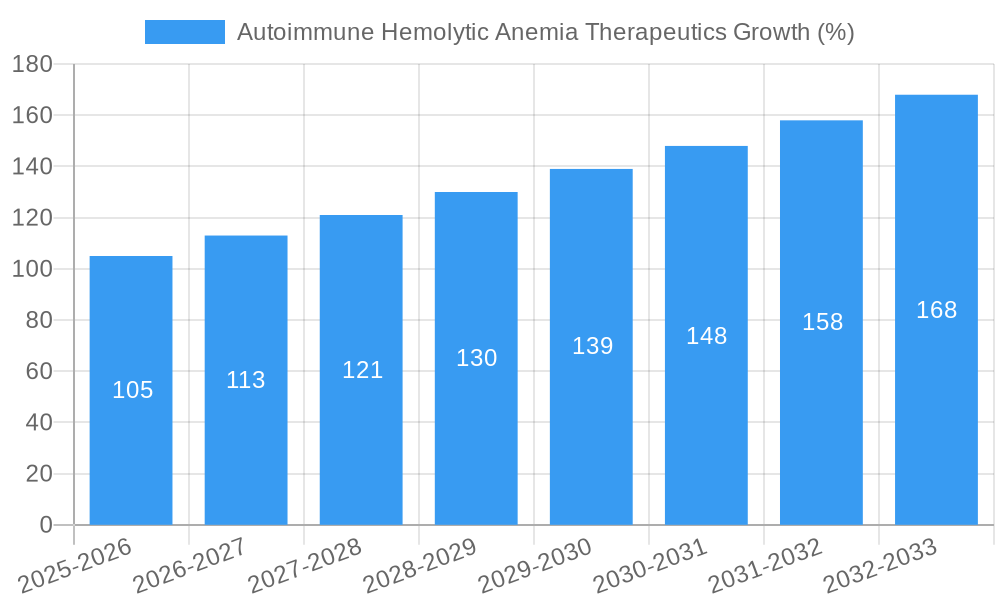
The AIHA therapeutics market is projected to experience significant growth during the forecast period (2025-2033). Increased prevalence of AIHA, coupled with the rising demand for effective therapies, is a primary driver. Technological advancements leading to the development of novel therapies, along with improvements in diagnostics, contribute to this growth. The market witnessed a CAGR of xx% during the historical period (2019-2024) and is projected to grow at a CAGR of xx% during the forecast period (2025-2033), reaching a market value of $xx million by 2033. This growth is largely driven by increasing awareness, improved diagnostic tools, and the introduction of newer treatment options. The market penetration rate is expected to increase from xx% in 2025 to xx% by 2033.
Dominant Regions, Countries, or Segments in Autoimmune Hemolytic Anemia Therapeutics
North America currently dominates the AIHA therapeutics market, driven by high healthcare expenditure, advanced healthcare infrastructure, and a large patient population. Europe follows as a significant market, while Asia-Pacific is projected to witness substantial growth in the coming years due to increasing healthcare investments and rising awareness.
- North America: High healthcare expenditure, advanced infrastructure, and a significant patient pool contribute to market dominance.
- Europe: Established healthcare systems and growing awareness of AIHA contribute to market growth.
- Asia-Pacific: Emerging economies with rising healthcare expenditure are expected to drive future growth.
Autoimmune Hemolytic Anemia Therapeutics Product Landscape
The AIHA therapeutics market offers a range of treatment options, including corticosteroids, immunosuppressants, and targeted therapies. Recent innovations focus on improving efficacy, reducing side effects, and providing targeted treatment approaches. The development of novel biologics and personalized medicine approaches is transforming the treatment landscape. Key performance metrics include response rates, remission duration, and overall survival.
Key Drivers, Barriers & Challenges in Autoimmune Hemolytic Anemia Therapeutics
Key Drivers:
- Increased prevalence of AIHA.
- Technological advancements leading to novel therapies.
- Rising healthcare expenditure and improved access to healthcare.
Key Barriers and Challenges:
- High cost of treatment limiting accessibility.
- Potential side effects associated with certain therapies.
- Limited availability of effective treatment options in certain regions.
- Regulatory hurdles in obtaining approvals for new drugs.
Emerging Opportunities in Autoimmune Hemolytic Anemia Therapeutics
- Development of personalized medicine approaches targeting specific patient subgroups.
- Exploration of novel therapeutic targets and mechanisms of action.
- Expansion into untapped markets in developing countries.
Growth Accelerators in the Autoimmune Hemolytic Anemia Therapeutics Industry
Technological breakthroughs in targeted therapies and the development of biosimilars are key growth accelerators. Strategic partnerships between pharmaceutical companies and research institutions are fostering innovation. Expansion into emerging markets and growing awareness among healthcare professionals are also contributing to market growth.
Key Players Shaping the Autoimmune Hemolytic Anemia Therapeutics Market
- Amneal Pharmaceuticals Inc
- Baxter International Inc
- F. Hoffmann-La Roche Ltd
- Incyte Corp
- Kezar Life Sciences Inc
- Pfizer Inc
- Rigel Pharmaceuticals Inc
- Sanofi
- Teva Pharmaceutical Industries Ltd
- Horizon
- Genentech
- Zydus Cadila
- Concord Biotech
Notable Milestones in Autoimmune Hemolytic Anemia Therapeutics Sector
- 2021: Launch of [Drug Name] by [Company Name].
- 2022: FDA approval of [Drug Name] for AIHA treatment.
- 2023: Acquisition of [Company A] by [Company B].
- 2024: Publication of pivotal clinical trial data demonstrating efficacy of [Drug Name].
In-Depth Autoimmune Hemolytic Anemia Therapeutics Market Outlook
The AIHA therapeutics market is poised for significant growth, driven by continued innovation and increasing demand. Strategic partnerships, investments in R&D, and the expansion into new therapeutic areas promise substantial future market potential. Companies focusing on personalized medicine approaches and targeted therapies are well-positioned to capture significant market share.
Autoimmune Hemolytic Anemia Therapeutics Segmentation
-
1. Application
- 1.1. Hospital Pharmacies
- 1.2. Retail Pharmacies
- 1.3. Online Pharmacies
-
2. Type
- 2.1. By Drug Class
- 2.2. By Disease Type
Autoimmune Hemolytic Anemia Therapeutics Segmentation By Geography
-
1. North America
- 1.1. United States
- 1.2. Canada
- 1.3. Mexico
-
2. South America
- 2.1. Brazil
- 2.2. Argentina
- 2.3. Rest of South America
-
3. Europe
- 3.1. United Kingdom
- 3.2. Germany
- 3.3. France
- 3.4. Italy
- 3.5. Spain
- 3.6. Russia
- 3.7. Benelux
- 3.8. Nordics
- 3.9. Rest of Europe
-
4. Middle East & Africa
- 4.1. Turkey
- 4.2. Israel
- 4.3. GCC
- 4.4. North Africa
- 4.5. South Africa
- 4.6. Rest of Middle East & Africa
-
5. Asia Pacific
- 5.1. China
- 5.2. India
- 5.3. Japan
- 5.4. South Korea
- 5.5. ASEAN
- 5.6. Oceania
- 5.7. Rest of Asia Pacific
Autoimmune Hemolytic Anemia Therapeutics REPORT HIGHLIGHTS
| Aspects | Details |
|---|---|
| Study Period | 2019-2033 |
| Base Year | 2024 |
| Estimated Year | 2025 |
| Forecast Period | 2025-2033 |
| Historical Period | 2019-2024 |
| Growth Rate | CAGR of XXX% from 2019-2033 |
| Segmentation |
|
Table of Contents
- 1. Introduction
- 1.1. Research Scope
- 1.2. Market Segmentation
- 1.3. Research Methodology
- 1.4. Definitions and Assumptions
- 2. Executive Summary
- 2.1. Introduction
- 3. Market Dynamics
- 3.1. Introduction
- 3.2. Market Drivers
- 3.3. Market Restrains
- 3.4. Market Trends
- 4. Market Factor Analysis
- 4.1. Porters Five Forces
- 4.2. Supply/Value Chain
- 4.3. PESTEL analysis
- 4.4. Market Entropy
- 4.5. Patent/Trademark Analysis
- 5. Global Autoimmune Hemolytic Anemia Therapeutics Analysis, Insights and Forecast, 2019-2031
- 5.1. Market Analysis, Insights and Forecast - by Application
- 5.1.1. Hospital Pharmacies
- 5.1.2. Retail Pharmacies
- 5.1.3. Online Pharmacies
- 5.2. Market Analysis, Insights and Forecast - by Type
- 5.2.1. By Drug Class
- 5.2.2. By Disease Type
- 5.3. Market Analysis, Insights and Forecast - by Region
- 5.3.1. North America
- 5.3.2. South America
- 5.3.3. Europe
- 5.3.4. Middle East & Africa
- 5.3.5. Asia Pacific
- 5.1. Market Analysis, Insights and Forecast - by Application
- 6. North America Autoimmune Hemolytic Anemia Therapeutics Analysis, Insights and Forecast, 2019-2031
- 6.1. Market Analysis, Insights and Forecast - by Application
- 6.1.1. Hospital Pharmacies
- 6.1.2. Retail Pharmacies
- 6.1.3. Online Pharmacies
- 6.2. Market Analysis, Insights and Forecast - by Type
- 6.2.1. By Drug Class
- 6.2.2. By Disease Type
- 6.1. Market Analysis, Insights and Forecast - by Application
- 7. South America Autoimmune Hemolytic Anemia Therapeutics Analysis, Insights and Forecast, 2019-2031
- 7.1. Market Analysis, Insights and Forecast - by Application
- 7.1.1. Hospital Pharmacies
- 7.1.2. Retail Pharmacies
- 7.1.3. Online Pharmacies
- 7.2. Market Analysis, Insights and Forecast - by Type
- 7.2.1. By Drug Class
- 7.2.2. By Disease Type
- 7.1. Market Analysis, Insights and Forecast - by Application
- 8. Europe Autoimmune Hemolytic Anemia Therapeutics Analysis, Insights and Forecast, 2019-2031
- 8.1. Market Analysis, Insights and Forecast - by Application
- 8.1.1. Hospital Pharmacies
- 8.1.2. Retail Pharmacies
- 8.1.3. Online Pharmacies
- 8.2. Market Analysis, Insights and Forecast - by Type
- 8.2.1. By Drug Class
- 8.2.2. By Disease Type
- 8.1. Market Analysis, Insights and Forecast - by Application
- 9. Middle East & Africa Autoimmune Hemolytic Anemia Therapeutics Analysis, Insights and Forecast, 2019-2031
- 9.1. Market Analysis, Insights and Forecast - by Application
- 9.1.1. Hospital Pharmacies
- 9.1.2. Retail Pharmacies
- 9.1.3. Online Pharmacies
- 9.2. Market Analysis, Insights and Forecast - by Type
- 9.2.1. By Drug Class
- 9.2.2. By Disease Type
- 9.1. Market Analysis, Insights and Forecast - by Application
- 10. Asia Pacific Autoimmune Hemolytic Anemia Therapeutics Analysis, Insights and Forecast, 2019-2031
- 10.1. Market Analysis, Insights and Forecast - by Application
- 10.1.1. Hospital Pharmacies
- 10.1.2. Retail Pharmacies
- 10.1.3. Online Pharmacies
- 10.2. Market Analysis, Insights and Forecast - by Type
- 10.2.1. By Drug Class
- 10.2.2. By Disease Type
- 10.1. Market Analysis, Insights and Forecast - by Application
- 11. Competitive Analysis
- 11.1. Global Market Share Analysis 2024
- 11.2. Company Profiles
- 11.2.1 Amneal Pharmaceuticals Inc
- 11.2.1.1. Overview
- 11.2.1.2. Products
- 11.2.1.3. SWOT Analysis
- 11.2.1.4. Recent Developments
- 11.2.1.5. Financials (Based on Availability)
- 11.2.2 Baxter International Inc
- 11.2.2.1. Overview
- 11.2.2.2. Products
- 11.2.2.3. SWOT Analysis
- 11.2.2.4. Recent Developments
- 11.2.2.5. Financials (Based on Availability)
- 11.2.3 F. Hoffmann-La Roche Ltd
- 11.2.3.1. Overview
- 11.2.3.2. Products
- 11.2.3.3. SWOT Analysis
- 11.2.3.4. Recent Developments
- 11.2.3.5. Financials (Based on Availability)
- 11.2.4 Incyte Corp
- 11.2.4.1. Overview
- 11.2.4.2. Products
- 11.2.4.3. SWOT Analysis
- 11.2.4.4. Recent Developments
- 11.2.4.5. Financials (Based on Availability)
- 11.2.5 Kezar Life Sciences Inc
- 11.2.5.1. Overview
- 11.2.5.2. Products
- 11.2.5.3. SWOT Analysis
- 11.2.5.4. Recent Developments
- 11.2.5.5. Financials (Based on Availability)
- 11.2.6 Pfizer Inc
- 11.2.6.1. Overview
- 11.2.6.2. Products
- 11.2.6.3. SWOT Analysis
- 11.2.6.4. Recent Developments
- 11.2.6.5. Financials (Based on Availability)
- 11.2.7 Rigel Pharmaceuticals Inc
- 11.2.7.1. Overview
- 11.2.7.2. Products
- 11.2.7.3. SWOT Analysis
- 11.2.7.4. Recent Developments
- 11.2.7.5. Financials (Based on Availability)
- 11.2.8 Sanofi
- 11.2.8.1. Overview
- 11.2.8.2. Products
- 11.2.8.3. SWOT Analysis
- 11.2.8.4. Recent Developments
- 11.2.8.5. Financials (Based on Availability)
- 11.2.9 Teva Pharmaceutical Industries Ltd
- 11.2.9.1. Overview
- 11.2.9.2. Products
- 11.2.9.3. SWOT Analysis
- 11.2.9.4. Recent Developments
- 11.2.9.5. Financials (Based on Availability)
- 11.2.10 Horizon
- 11.2.10.1. Overview
- 11.2.10.2. Products
- 11.2.10.3. SWOT Analysis
- 11.2.10.4. Recent Developments
- 11.2.10.5. Financials (Based on Availability)
- 11.2.11 Genentech
- 11.2.11.1. Overview
- 11.2.11.2. Products
- 11.2.11.3. SWOT Analysis
- 11.2.11.4. Recent Developments
- 11.2.11.5. Financials (Based on Availability)
- 11.2.12 Zydus Cadila
- 11.2.12.1. Overview
- 11.2.12.2. Products
- 11.2.12.3. SWOT Analysis
- 11.2.12.4. Recent Developments
- 11.2.12.5. Financials (Based on Availability)
- 11.2.13 Concord Biotech
- 11.2.13.1. Overview
- 11.2.13.2. Products
- 11.2.13.3. SWOT Analysis
- 11.2.13.4. Recent Developments
- 11.2.13.5. Financials (Based on Availability)
- 11.2.1 Amneal Pharmaceuticals Inc
List of Figures
- Figure 1: Global Autoimmune Hemolytic Anemia Therapeutics Revenue Breakdown (million, %) by Region 2024 & 2032
- Figure 2: North America Autoimmune Hemolytic Anemia Therapeutics Revenue (million), by Application 2024 & 2032
- Figure 3: North America Autoimmune Hemolytic Anemia Therapeutics Revenue Share (%), by Application 2024 & 2032
- Figure 4: North America Autoimmune Hemolytic Anemia Therapeutics Revenue (million), by Type 2024 & 2032
- Figure 5: North America Autoimmune Hemolytic Anemia Therapeutics Revenue Share (%), by Type 2024 & 2032
- Figure 6: North America Autoimmune Hemolytic Anemia Therapeutics Revenue (million), by Country 2024 & 2032
- Figure 7: North America Autoimmune Hemolytic Anemia Therapeutics Revenue Share (%), by Country 2024 & 2032
- Figure 8: South America Autoimmune Hemolytic Anemia Therapeutics Revenue (million), by Application 2024 & 2032
- Figure 9: South America Autoimmune Hemolytic Anemia Therapeutics Revenue Share (%), by Application 2024 & 2032
- Figure 10: South America Autoimmune Hemolytic Anemia Therapeutics Revenue (million), by Type 2024 & 2032
- Figure 11: South America Autoimmune Hemolytic Anemia Therapeutics Revenue Share (%), by Type 2024 & 2032
- Figure 12: South America Autoimmune Hemolytic Anemia Therapeutics Revenue (million), by Country 2024 & 2032
- Figure 13: South America Autoimmune Hemolytic Anemia Therapeutics Revenue Share (%), by Country 2024 & 2032
- Figure 14: Europe Autoimmune Hemolytic Anemia Therapeutics Revenue (million), by Application 2024 & 2032
- Figure 15: Europe Autoimmune Hemolytic Anemia Therapeutics Revenue Share (%), by Application 2024 & 2032
- Figure 16: Europe Autoimmune Hemolytic Anemia Therapeutics Revenue (million), by Type 2024 & 2032
- Figure 17: Europe Autoimmune Hemolytic Anemia Therapeutics Revenue Share (%), by Type 2024 & 2032
- Figure 18: Europe Autoimmune Hemolytic Anemia Therapeutics Revenue (million), by Country 2024 & 2032
- Figure 19: Europe Autoimmune Hemolytic Anemia Therapeutics Revenue Share (%), by Country 2024 & 2032
- Figure 20: Middle East & Africa Autoimmune Hemolytic Anemia Therapeutics Revenue (million), by Application 2024 & 2032
- Figure 21: Middle East & Africa Autoimmune Hemolytic Anemia Therapeutics Revenue Share (%), by Application 2024 & 2032
- Figure 22: Middle East & Africa Autoimmune Hemolytic Anemia Therapeutics Revenue (million), by Type 2024 & 2032
- Figure 23: Middle East & Africa Autoimmune Hemolytic Anemia Therapeutics Revenue Share (%), by Type 2024 & 2032
- Figure 24: Middle East & Africa Autoimmune Hemolytic Anemia Therapeutics Revenue (million), by Country 2024 & 2032
- Figure 25: Middle East & Africa Autoimmune Hemolytic Anemia Therapeutics Revenue Share (%), by Country 2024 & 2032
- Figure 26: Asia Pacific Autoimmune Hemolytic Anemia Therapeutics Revenue (million), by Application 2024 & 2032
- Figure 27: Asia Pacific Autoimmune Hemolytic Anemia Therapeutics Revenue Share (%), by Application 2024 & 2032
- Figure 28: Asia Pacific Autoimmune Hemolytic Anemia Therapeutics Revenue (million), by Type 2024 & 2032
- Figure 29: Asia Pacific Autoimmune Hemolytic Anemia Therapeutics Revenue Share (%), by Type 2024 & 2032
- Figure 30: Asia Pacific Autoimmune Hemolytic Anemia Therapeutics Revenue (million), by Country 2024 & 2032
- Figure 31: Asia Pacific Autoimmune Hemolytic Anemia Therapeutics Revenue Share (%), by Country 2024 & 2032
List of Tables
- Table 1: Global Autoimmune Hemolytic Anemia Therapeutics Revenue million Forecast, by Region 2019 & 2032
- Table 2: Global Autoimmune Hemolytic Anemia Therapeutics Revenue million Forecast, by Application 2019 & 2032
- Table 3: Global Autoimmune Hemolytic Anemia Therapeutics Revenue million Forecast, by Type 2019 & 2032
- Table 4: Global Autoimmune Hemolytic Anemia Therapeutics Revenue million Forecast, by Region 2019 & 2032
- Table 5: Global Autoimmune Hemolytic Anemia Therapeutics Revenue million Forecast, by Application 2019 & 2032
- Table 6: Global Autoimmune Hemolytic Anemia Therapeutics Revenue million Forecast, by Type 2019 & 2032
- Table 7: Global Autoimmune Hemolytic Anemia Therapeutics Revenue million Forecast, by Country 2019 & 2032
- Table 8: United States Autoimmune Hemolytic Anemia Therapeutics Revenue (million) Forecast, by Application 2019 & 2032
- Table 9: Canada Autoimmune Hemolytic Anemia Therapeutics Revenue (million) Forecast, by Application 2019 & 2032
- Table 10: Mexico Autoimmune Hemolytic Anemia Therapeutics Revenue (million) Forecast, by Application 2019 & 2032
- Table 11: Global Autoimmune Hemolytic Anemia Therapeutics Revenue million Forecast, by Application 2019 & 2032
- Table 12: Global Autoimmune Hemolytic Anemia Therapeutics Revenue million Forecast, by Type 2019 & 2032
- Table 13: Global Autoimmune Hemolytic Anemia Therapeutics Revenue million Forecast, by Country 2019 & 2032
- Table 14: Brazil Autoimmune Hemolytic Anemia Therapeutics Revenue (million) Forecast, by Application 2019 & 2032
- Table 15: Argentina Autoimmune Hemolytic Anemia Therapeutics Revenue (million) Forecast, by Application 2019 & 2032
- Table 16: Rest of South America Autoimmune Hemolytic Anemia Therapeutics Revenue (million) Forecast, by Application 2019 & 2032
- Table 17: Global Autoimmune Hemolytic Anemia Therapeutics Revenue million Forecast, by Application 2019 & 2032
- Table 18: Global Autoimmune Hemolytic Anemia Therapeutics Revenue million Forecast, by Type 2019 & 2032
- Table 19: Global Autoimmune Hemolytic Anemia Therapeutics Revenue million Forecast, by Country 2019 & 2032
- Table 20: United Kingdom Autoimmune Hemolytic Anemia Therapeutics Revenue (million) Forecast, by Application 2019 & 2032
- Table 21: Germany Autoimmune Hemolytic Anemia Therapeutics Revenue (million) Forecast, by Application 2019 & 2032
- Table 22: France Autoimmune Hemolytic Anemia Therapeutics Revenue (million) Forecast, by Application 2019 & 2032
- Table 23: Italy Autoimmune Hemolytic Anemia Therapeutics Revenue (million) Forecast, by Application 2019 & 2032
- Table 24: Spain Autoimmune Hemolytic Anemia Therapeutics Revenue (million) Forecast, by Application 2019 & 2032
- Table 25: Russia Autoimmune Hemolytic Anemia Therapeutics Revenue (million) Forecast, by Application 2019 & 2032
- Table 26: Benelux Autoimmune Hemolytic Anemia Therapeutics Revenue (million) Forecast, by Application 2019 & 2032
- Table 27: Nordics Autoimmune Hemolytic Anemia Therapeutics Revenue (million) Forecast, by Application 2019 & 2032
- Table 28: Rest of Europe Autoimmune Hemolytic Anemia Therapeutics Revenue (million) Forecast, by Application 2019 & 2032
- Table 29: Global Autoimmune Hemolytic Anemia Therapeutics Revenue million Forecast, by Application 2019 & 2032
- Table 30: Global Autoimmune Hemolytic Anemia Therapeutics Revenue million Forecast, by Type 2019 & 2032
- Table 31: Global Autoimmune Hemolytic Anemia Therapeutics Revenue million Forecast, by Country 2019 & 2032
- Table 32: Turkey Autoimmune Hemolytic Anemia Therapeutics Revenue (million) Forecast, by Application 2019 & 2032
- Table 33: Israel Autoimmune Hemolytic Anemia Therapeutics Revenue (million) Forecast, by Application 2019 & 2032
- Table 34: GCC Autoimmune Hemolytic Anemia Therapeutics Revenue (million) Forecast, by Application 2019 & 2032
- Table 35: North Africa Autoimmune Hemolytic Anemia Therapeutics Revenue (million) Forecast, by Application 2019 & 2032
- Table 36: South Africa Autoimmune Hemolytic Anemia Therapeutics Revenue (million) Forecast, by Application 2019 & 2032
- Table 37: Rest of Middle East & Africa Autoimmune Hemolytic Anemia Therapeutics Revenue (million) Forecast, by Application 2019 & 2032
- Table 38: Global Autoimmune Hemolytic Anemia Therapeutics Revenue million Forecast, by Application 2019 & 2032
- Table 39: Global Autoimmune Hemolytic Anemia Therapeutics Revenue million Forecast, by Type 2019 & 2032
- Table 40: Global Autoimmune Hemolytic Anemia Therapeutics Revenue million Forecast, by Country 2019 & 2032
- Table 41: China Autoimmune Hemolytic Anemia Therapeutics Revenue (million) Forecast, by Application 2019 & 2032
- Table 42: India Autoimmune Hemolytic Anemia Therapeutics Revenue (million) Forecast, by Application 2019 & 2032
- Table 43: Japan Autoimmune Hemolytic Anemia Therapeutics Revenue (million) Forecast, by Application 2019 & 2032
- Table 44: South Korea Autoimmune Hemolytic Anemia Therapeutics Revenue (million) Forecast, by Application 2019 & 2032
- Table 45: ASEAN Autoimmune Hemolytic Anemia Therapeutics Revenue (million) Forecast, by Application 2019 & 2032
- Table 46: Oceania Autoimmune Hemolytic Anemia Therapeutics Revenue (million) Forecast, by Application 2019 & 2032
- Table 47: Rest of Asia Pacific Autoimmune Hemolytic Anemia Therapeutics Revenue (million) Forecast, by Application 2019 & 2032
Frequently Asked Questions
1. What is the projected Compound Annual Growth Rate (CAGR) of the Autoimmune Hemolytic Anemia Therapeutics?
The projected CAGR is approximately XXX%.
2. Which companies are prominent players in the Autoimmune Hemolytic Anemia Therapeutics?
Key companies in the market include Amneal Pharmaceuticals Inc, Baxter International Inc, F. Hoffmann-La Roche Ltd, Incyte Corp, Kezar Life Sciences Inc, Pfizer Inc, Rigel Pharmaceuticals Inc, Sanofi, Teva Pharmaceutical Industries Ltd, Horizon, Genentech, Zydus Cadila, Concord Biotech.
3. What are the main segments of the Autoimmune Hemolytic Anemia Therapeutics?
The market segments include Application, Type.
4. Can you provide details about the market size?
The market size is estimated to be USD XXX million as of 2022.
5. What are some drivers contributing to market growth?
N/A
6. What are the notable trends driving market growth?
N/A
7. Are there any restraints impacting market growth?
N/A
8. Can you provide examples of recent developments in the market?
N/A
9. What pricing options are available for accessing the report?
Pricing options include single-user, multi-user, and enterprise licenses priced at USD 3950.00, USD 5925.00, and USD 7900.00 respectively.
10. Is the market size provided in terms of value or volume?
The market size is provided in terms of value, measured in million.
11. Are there any specific market keywords associated with the report?
Yes, the market keyword associated with the report is "Autoimmune Hemolytic Anemia Therapeutics," which aids in identifying and referencing the specific market segment covered.
12. How do I determine which pricing option suits my needs best?
The pricing options vary based on user requirements and access needs. Individual users may opt for single-user licenses, while businesses requiring broader access may choose multi-user or enterprise licenses for cost-effective access to the report.
13. Are there any additional resources or data provided in the Autoimmune Hemolytic Anemia Therapeutics report?
While the report offers comprehensive insights, it's advisable to review the specific contents or supplementary materials provided to ascertain if additional resources or data are available.
14. How can I stay updated on further developments or reports in the Autoimmune Hemolytic Anemia Therapeutics?
To stay informed about further developments, trends, and reports in the Autoimmune Hemolytic Anemia Therapeutics, consider subscribing to industry newsletters, following relevant companies and organizations, or regularly checking reputable industry news sources and publications.
Methodology
Step 1 - Identification of Relevant Samples Size from Population Database


Step 2 - Approaches for Defining Global Market Size (Value, Volume* & Price*)

Note*: In applicable scenarios
Step 3 - Data Sources
Primary Research
- Web Analytics
- Survey Reports
- Research Institute
- Latest Research Reports
- Opinion Leaders
Secondary Research
- Annual Reports
- White Paper
- Latest Press Release
- Industry Association
- Paid Database
- Investor Presentations

Step 4 - Data Triangulation
Involves using different sources of information in order to increase the validity of a study
These sources are likely to be stakeholders in a program - participants, other researchers, program staff, other community members, and so on.
Then we put all data in single framework & apply various statistical tools to find out the dynamic on the market.
During the analysis stage, feedback from the stakeholder groups would be compared to determine areas of agreement as well as areas of divergence
