

Key Insights
The automotive appearance chemicals market, valued at $1.19 billion in 2025, is projected to experience steady growth, driven by a rising number of vehicles globally and a growing consumer preference for enhanced vehicle aesthetics. The market's Compound Annual Growth Rate (CAGR) of 3.34% from 2019 to 2024 indicates a consistent demand for products like waxes, polishes, protectants, and cleaning solutions. Key growth drivers include the increasing popularity of detailing and car care services, the introduction of innovative, eco-friendly formulations, and the expanding automotive aftermarket. The passenger car segment dominates the application market, followed by light commercial vehicles. Geographically, the Asia-Pacific region, particularly China and India, are expected to show significant growth due to expanding middle classes and increasing car ownership. However, fluctuating raw material prices and environmental regulations pose challenges to market expansion. The market is fragmented, with several major international players such as 3M, Turtle Wax, and SONAX competing alongside numerous regional brands. Product innovation focusing on advanced features such as long-lasting protection, ease of use, and environmentally friendly compositions will be crucial for achieving higher market share in the coming years. The forecast period of 2025-2033 anticipates continued growth, influenced by factors such as rising disposable incomes in emerging economies and increasing consumer awareness of vehicle maintenance.
The competitive landscape is characterized by a mix of large multinational corporations and smaller, specialized players. Established brands leverage their strong distribution networks and brand recognition, while smaller companies focus on niche products or regional markets. Future growth will likely be shaped by technological advancements, the development of sustainable and biodegradable products, and shifts in consumer preferences. Further market segmentation based on product features (e.g., hydrophobic properties, UV protection) and distribution channels (online retail vs. brick-and-mortar stores) will provide a more granular understanding of market dynamics and growth opportunities. The market's projected growth trajectory necessitates a focus on strategic partnerships, product differentiation, and effective marketing strategies to capitalize on the burgeoning demand. Expansion into untapped markets and diversification of product offerings will be critical for sustained success within this competitive landscape.

Automotive Appearance Chemicals Market: A Comprehensive Report (2019-2033)
This in-depth report provides a comprehensive analysis of the Automotive Appearance Chemicals Market, encompassing market dynamics, growth trends, regional dominance, product landscape, key players, and future outlook. The study period covers 2019-2033, with 2025 as the base and estimated year. The report segments the market by product type (waxes, polishes, protectants, wheel and tire cleaners, windshield washer fluids, leather care products, others) and application (passenger cars, light commercial vehicles, heavy commercial vehicles, others), providing granular insights into this dynamic sector. The global market size is projected to reach xx Million units by 2033.
Automotive Appearance Chemicals Market Market Dynamics & Structure
The Automotive Appearance Chemicals Market exhibits a moderately consolidated structure, with key players such as 3M, Turtle Wax Inc, and SONAX GmbH holding significant market share. Technological innovation, particularly in eco-friendly formulations and advanced polymer technologies, is a major driver. Stringent environmental regulations concerning VOC emissions are shaping product development, pushing manufacturers towards sustainable alternatives. The market also faces competitive pressure from substitute products, including DIY detailing kits and professional detailing services. M&A activity in the sector is moderate, with a recorded xx number of deals in the past five years, primarily focused on expanding product portfolios and geographical reach. End-user demographics are shifting towards younger consumers who prioritize convenience and eco-consciousness.
- Market Concentration: Moderately consolidated, with top 5 players holding xx% market share in 2025.
- Technological Innovation: Focus on eco-friendly formulations, advanced polymers, and enhanced performance characteristics.
- Regulatory Framework: Stringent VOC emission standards driving innovation in sustainable products.
- Competitive Substitutes: DIY detailing kits and professional detailing services pose a competitive threat.
- M&A Trends: Moderate activity, driven by portfolio expansion and geographic reach. xx M&A deals between 2020-2024.
- End-User Demographics: Shifting towards younger, environmentally conscious consumers.
Automotive Appearance Chemicals Market Growth Trends & Insights
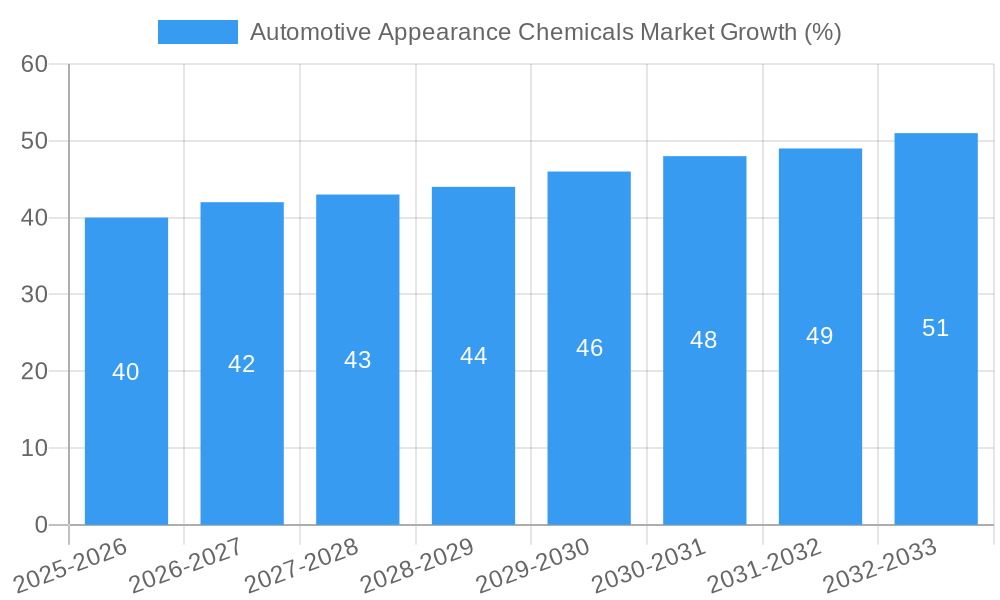
The Automotive Appearance Chemicals Market has witnessed steady growth over the historical period (2019-2024), driven by rising vehicle ownership, increasing consumer disposable incomes, and a growing preference for enhanced vehicle aesthetics. The market is expected to register a CAGR of xx% during the forecast period (2025-2033), reaching a projected xx Million units by 2033. Technological disruptions, such as the introduction of hydrophobic coatings and self-cleaning technologies, are accelerating market expansion. Consumer behavior is shifting towards premium and specialized products, driving growth in high-margin segments like leather care and advanced protectants. Market penetration remains relatively high in developed regions, while emerging markets offer significant growth potential.
Dominant Regions, Countries, or Segments in Automotive Appearance Chemicals Market
North America currently holds the largest market share, driven by high vehicle ownership rates and a strong aftermarket for automotive appearance products. However, the Asia-Pacific region exhibits the highest growth potential, fueled by rapid economic expansion and increasing urbanization. Within product types, polishes and protectants dominate, accounting for xx% of the market in 2025. Passenger cars constitute the largest application segment, reflecting the high volume of passenger vehicles globally.
- Key Drivers (North America): High vehicle ownership, developed aftermarket, consumer preference for premium products.
- Key Drivers (Asia-Pacific): Rapid economic growth, increasing urbanization, rising disposable incomes.
- Dominant Product Type: Polishes and protectants (xx% market share in 2025).
- Dominant Application Segment: Passenger cars (xx% market share in 2025).
- Growth Potential: Asia-Pacific region shows the highest growth potential.
Automotive Appearance Chemicals Market Product Landscape
The market offers a diverse range of products, from traditional waxes and polishes to advanced protectants, wheel cleaners, and leather care products. Recent innovations focus on enhanced durability, ease of application, and environmentally friendly formulations. Unique selling propositions include hydrophobic coatings that repel water and dirt, self-cleaning technologies, and UV protection to prevent fading and damage. Technological advancements are continuously improving product performance and consumer experience.
Key Drivers, Barriers & Challenges in Automotive Appearance Chemicals Market
Key Drivers: Rising vehicle ownership, increasing consumer disposable incomes, growing preference for vehicle aesthetics, technological advancements in product formulations.
Challenges: Stringent environmental regulations limiting the use of certain chemicals, increasing raw material costs, intense competition from substitute products, and supply chain disruptions impacting product availability and cost. The impact of these challenges could potentially reduce market growth by xx% by 2033.
Emerging Opportunities in Automotive Appearance Chemicals Market
Untapped markets in developing economies present significant growth opportunities. The rising demand for eco-friendly and sustainable products creates a niche for bio-based and biodegradable automotive appearance chemicals. Innovative applications, such as ceramic coatings and nano-technology based protectants, offer high-value opportunities. Evolving consumer preferences towards convenience and ease of use are driving demand for ready-to-use products and application services.
Growth Accelerators in the Automotive Appearance Chemicals Market Industry
Technological breakthroughs, particularly in nanotechnology and bio-based materials, are crucial growth accelerators. Strategic partnerships between chemical manufacturers and automotive companies can drive product integration and market penetration. Expanding into emerging markets and focusing on digital marketing to reach a wider consumer base can significantly accelerate growth.
Key Players Shaping the Automotive Appearance Chemicals Market Market
- 3M
- Turtle Wax Inc
- SONAX GmbH
- Niteo Products Inc
- Tetrosyl Ltd
- Nuvite Chemical Compounds
- Dow
- ITW Global Brands
- LIQUI MOLY GmbH
- Valvoline Chemicals
- Guangzhou Biaobang Car Care Industry Co Ltd
- General Chemical Corp
*List Not Exhaustive
Notable Milestones in Automotive Appearance Chemicals Market Sector
- 2021: Launch of a new generation of eco-friendly polishes by 3M.
- 2022: Acquisition of a smaller competitor by Turtle Wax Inc, expanding its product portfolio.
- 2023: Introduction of a biodegradable wheel cleaner by SONAX.
- 2024: New regulations implemented in Europe impacting the use of certain chemicals. (Further details on recent developments will be included in the complete report.)
In-Depth Automotive Appearance Chemicals Market Market Outlook
The Automotive Appearance Chemicals Market is poised for continued growth, driven by technological innovation, expanding applications, and the increasing consumer focus on vehicle aesthetics. Strategic partnerships, market expansion into developing regions, and a focus on sustainability will be key to unlocking future market potential. The market's long-term prospects remain positive, with substantial growth opportunities across various segments and regions.
Automotive Appearance Chemicals Market Segmentation
-
1. Product Type
- 1.1. Waxes
- 1.2. Polishes
- 1.3. Protectants
- 1.4. Wheel and Tire Cleaners
- 1.5. Windshield Washer Fluids
- 1.6. Leather Care Products
- 1.7. Others
-
2. Application
- 2.1. Passenger Cars
- 2.2. Light Commercial Vehicles
- 2.3. Heavy Commercial Vehicles
- 2.4. Others
Automotive Appearance Chemicals Market Segmentation By Geography
-
1. Asia Pacific
- 1.1. China
- 1.2. India
- 1.3. Japan
- 1.4. South Korea
- 1.5. Rest of Asia Pacific
-
2. North America
- 2.1. United States
- 2.2. Canada
- 2.3. Mexico
-
3. Europe
- 3.1. Germany
- 3.2. United Kingdom
- 3.3. France
- 3.4. Italy
- 3.5. Rest of Europe
-
4. South America
- 4.1. Brazil
- 4.2. Argentina
- 4.3. Rest of South America
-
5. Middle East and Africa
- 5.1. Saudi Arabia
- 5.2. South Africa
- 5.3. Rest of Middle East and Africa

Automotive Appearance Chemicals Market REPORT HIGHLIGHTS
| Aspects | Details |
|---|---|
| Study Period | 2019-2033 |
| Base Year | 2024 |
| Estimated Year | 2025 |
| Forecast Period | 2025-2033 |
| Historical Period | 2019-2024 |
| Growth Rate | CAGR of 3.34% from 2019-2033 |
| Segmentation |
|
Table of Contents
- 1. Introduction
- 1.1. Research Scope
- 1.2. Market Segmentation
- 1.3. Research Methodology
- 1.4. Definitions and Assumptions
- 2. Executive Summary
- 2.1. Introduction
- 3. Market Dynamics
- 3.1. Introduction
- 3.2. Market Drivers
- 3.2.1. Increase in the Production of Electric Vehicles (EV); Increase in Consumer Awareness Toward Vehicle Maintenance; Other Drivers
- 3.3. Market Restrains
- 3.3.1. Stringent Government Regulations on Petroleum Products like Waxes and Coatings; Other Restraints
- 3.4. Market Trends
- 3.4.1. Increase in the Production of Electric Vehicles
- 4. Market Factor Analysis
- 4.1. Porters Five Forces
- 4.2. Supply/Value Chain
- 4.3. PESTEL analysis
- 4.4. Market Entropy
- 4.5. Patent/Trademark Analysis
- 5. Global Automotive Appearance Chemicals Market Analysis, Insights and Forecast, 2019-2031
- 5.1. Market Analysis, Insights and Forecast - by Product Type
- 5.1.1. Waxes
- 5.1.2. Polishes
- 5.1.3. Protectants
- 5.1.4. Wheel and Tire Cleaners
- 5.1.5. Windshield Washer Fluids
- 5.1.6. Leather Care Products
- 5.1.7. Others
- 5.2. Market Analysis, Insights and Forecast - by Application
- 5.2.1. Passenger Cars
- 5.2.2. Light Commercial Vehicles
- 5.2.3. Heavy Commercial Vehicles
- 5.2.4. Others
- 5.3. Market Analysis, Insights and Forecast - by Region
- 5.3.1. Asia Pacific
- 5.3.2. North America
- 5.3.3. Europe
- 5.3.4. South America
- 5.3.5. Middle East and Africa
- 5.1. Market Analysis, Insights and Forecast - by Product Type
- 6. Asia Pacific Automotive Appearance Chemicals Market Analysis, Insights and Forecast, 2019-2031
- 6.1. Market Analysis, Insights and Forecast - by Product Type
- 6.1.1. Waxes
- 6.1.2. Polishes
- 6.1.3. Protectants
- 6.1.4. Wheel and Tire Cleaners
- 6.1.5. Windshield Washer Fluids
- 6.1.6. Leather Care Products
- 6.1.7. Others
- 6.2. Market Analysis, Insights and Forecast - by Application
- 6.2.1. Passenger Cars
- 6.2.2. Light Commercial Vehicles
- 6.2.3. Heavy Commercial Vehicles
- 6.2.4. Others
- 6.1. Market Analysis, Insights and Forecast - by Product Type
- 7. North America Automotive Appearance Chemicals Market Analysis, Insights and Forecast, 2019-2031
- 7.1. Market Analysis, Insights and Forecast - by Product Type
- 7.1.1. Waxes
- 7.1.2. Polishes
- 7.1.3. Protectants
- 7.1.4. Wheel and Tire Cleaners
- 7.1.5. Windshield Washer Fluids
- 7.1.6. Leather Care Products
- 7.1.7. Others
- 7.2. Market Analysis, Insights and Forecast - by Application
- 7.2.1. Passenger Cars
- 7.2.2. Light Commercial Vehicles
- 7.2.3. Heavy Commercial Vehicles
- 7.2.4. Others
- 7.1. Market Analysis, Insights and Forecast - by Product Type
- 8. Europe Automotive Appearance Chemicals Market Analysis, Insights and Forecast, 2019-2031
- 8.1. Market Analysis, Insights and Forecast - by Product Type
- 8.1.1. Waxes
- 8.1.2. Polishes
- 8.1.3. Protectants
- 8.1.4. Wheel and Tire Cleaners
- 8.1.5. Windshield Washer Fluids
- 8.1.6. Leather Care Products
- 8.1.7. Others
- 8.2. Market Analysis, Insights and Forecast - by Application
- 8.2.1. Passenger Cars
- 8.2.2. Light Commercial Vehicles
- 8.2.3. Heavy Commercial Vehicles
- 8.2.4. Others
- 8.1. Market Analysis, Insights and Forecast - by Product Type
- 9. South America Automotive Appearance Chemicals Market Analysis, Insights and Forecast, 2019-2031
- 9.1. Market Analysis, Insights and Forecast - by Product Type
- 9.1.1. Waxes
- 9.1.2. Polishes
- 9.1.3. Protectants
- 9.1.4. Wheel and Tire Cleaners
- 9.1.5. Windshield Washer Fluids
- 9.1.6. Leather Care Products
- 9.1.7. Others
- 9.2. Market Analysis, Insights and Forecast - by Application
- 9.2.1. Passenger Cars
- 9.2.2. Light Commercial Vehicles
- 9.2.3. Heavy Commercial Vehicles
- 9.2.4. Others
- 9.1. Market Analysis, Insights and Forecast - by Product Type
- 10. Middle East and Africa Automotive Appearance Chemicals Market Analysis, Insights and Forecast, 2019-2031
- 10.1. Market Analysis, Insights and Forecast - by Product Type
- 10.1.1. Waxes
- 10.1.2. Polishes
- 10.1.3. Protectants
- 10.1.4. Wheel and Tire Cleaners
- 10.1.5. Windshield Washer Fluids
- 10.1.6. Leather Care Products
- 10.1.7. Others
- 10.2. Market Analysis, Insights and Forecast - by Application
- 10.2.1. Passenger Cars
- 10.2.2. Light Commercial Vehicles
- 10.2.3. Heavy Commercial Vehicles
- 10.2.4. Others
- 10.1. Market Analysis, Insights and Forecast - by Product Type
- 11. Asia Pacific Automotive Appearance Chemicals Market Analysis, Insights and Forecast, 2019-2031
- 11.1. Market Analysis, Insights and Forecast - By Country/Sub-region
- 11.1.1 China
- 11.1.2 India
- 11.1.3 Japan
- 11.1.4 South Korea
- 11.1.5 Rest of Asia Pacific
- 12. North America Automotive Appearance Chemicals Market Analysis, Insights and Forecast, 2019-2031
- 12.1. Market Analysis, Insights and Forecast - By Country/Sub-region
- 12.1.1 United States
- 12.1.2 Canada
- 12.1.3 Mexico
- 13. Europe Automotive Appearance Chemicals Market Analysis, Insights and Forecast, 2019-2031
- 13.1. Market Analysis, Insights and Forecast - By Country/Sub-region
- 13.1.1 Germany
- 13.1.2 United Kingdom
- 13.1.3 France
- 13.1.4 Italy
- 13.1.5 Rest of Europe
- 14. South America Automotive Appearance Chemicals Market Analysis, Insights and Forecast, 2019-2031
- 14.1. Market Analysis, Insights and Forecast - By Country/Sub-region
- 14.1.1 Brazil
- 14.1.2 Argentina
- 14.1.3 Rest of South America
- 15. Middle East and Africa Automotive Appearance Chemicals Market Analysis, Insights and Forecast, 2019-2031
- 15.1. Market Analysis, Insights and Forecast - By Country/Sub-region
- 15.1.1 Saudi Arabia
- 15.1.2 South Africa
- 15.1.3 Rest of Middle East and Africa
- 16. Competitive Analysis
- 16.1. Global Market Share Analysis 2024
- 16.2. Company Profiles
- 16.2.1 Niteo Products Inc
- 16.2.1.1. Overview
- 16.2.1.2. Products
- 16.2.1.3. SWOT Analysis
- 16.2.1.4. Recent Developments
- 16.2.1.5. Financials (Based on Availability)
- 16.2.2 SONAX GmbH
- 16.2.2.1. Overview
- 16.2.2.2. Products
- 16.2.2.3. SWOT Analysis
- 16.2.2.4. Recent Developments
- 16.2.2.5. Financials (Based on Availability)
- 16.2.3 Guangzhou Biaobang Car Care Industry Co Ltd
- 16.2.3.1. Overview
- 16.2.3.2. Products
- 16.2.3.3. SWOT Analysis
- 16.2.3.4. Recent Developments
- 16.2.3.5. Financials (Based on Availability)
- 16.2.4 3M
- 16.2.4.1. Overview
- 16.2.4.2. Products
- 16.2.4.3. SWOT Analysis
- 16.2.4.4. Recent Developments
- 16.2.4.5. Financials (Based on Availability)
- 16.2.5 Tetrosyl Ltd
- 16.2.5.1. Overview
- 16.2.5.2. Products
- 16.2.5.3. SWOT Analysis
- 16.2.5.4. Recent Developments
- 16.2.5.5. Financials (Based on Availability)
- 16.2.6 Nuvite Chemical Compounds
- 16.2.6.1. Overview
- 16.2.6.2. Products
- 16.2.6.3. SWOT Analysis
- 16.2.6.4. Recent Developments
- 16.2.6.5. Financials (Based on Availability)
- 16.2.7 Dow
- 16.2.7.1. Overview
- 16.2.7.2. Products
- 16.2.7.3. SWOT Analysis
- 16.2.7.4. Recent Developments
- 16.2.7.5. Financials (Based on Availability)
- 16.2.8 ITW Global Brands
- 16.2.8.1. Overview
- 16.2.8.2. Products
- 16.2.8.3. SWOT Analysis
- 16.2.8.4. Recent Developments
- 16.2.8.5. Financials (Based on Availability)
- 16.2.9 Turtle Wax Inc
- 16.2.9.1. Overview
- 16.2.9.2. Products
- 16.2.9.3. SWOT Analysis
- 16.2.9.4. Recent Developments
- 16.2.9.5. Financials (Based on Availability)
- 16.2.10 LIQUI MOLY GmbH
- 16.2.10.1. Overview
- 16.2.10.2. Products
- 16.2.10.3. SWOT Analysis
- 16.2.10.4. Recent Developments
- 16.2.10.5. Financials (Based on Availability)
- 16.2.11 Valvoline Chemicals*List Not Exhaustive
- 16.2.11.1. Overview
- 16.2.11.2. Products
- 16.2.11.3. SWOT Analysis
- 16.2.11.4. Recent Developments
- 16.2.11.5. Financials (Based on Availability)
- 16.2.12 General Chemical Corp
- 16.2.12.1. Overview
- 16.2.12.2. Products
- 16.2.12.3. SWOT Analysis
- 16.2.12.4. Recent Developments
- 16.2.12.5. Financials (Based on Availability)
- 16.2.1 Niteo Products Inc
List of Figures
- Figure 1: Global Automotive Appearance Chemicals Market Revenue Breakdown (Million, %) by Region 2024 & 2032
- Figure 2: Asia Pacific Automotive Appearance Chemicals Market Revenue (Million), by Country 2024 & 2032
- Figure 3: Asia Pacific Automotive Appearance Chemicals Market Revenue Share (%), by Country 2024 & 2032
- Figure 4: North America Automotive Appearance Chemicals Market Revenue (Million), by Country 2024 & 2032
- Figure 5: North America Automotive Appearance Chemicals Market Revenue Share (%), by Country 2024 & 2032
- Figure 6: Europe Automotive Appearance Chemicals Market Revenue (Million), by Country 2024 & 2032
- Figure 7: Europe Automotive Appearance Chemicals Market Revenue Share (%), by Country 2024 & 2032
- Figure 8: South America Automotive Appearance Chemicals Market Revenue (Million), by Country 2024 & 2032
- Figure 9: South America Automotive Appearance Chemicals Market Revenue Share (%), by Country 2024 & 2032
- Figure 10: Middle East and Africa Automotive Appearance Chemicals Market Revenue (Million), by Country 2024 & 2032
- Figure 11: Middle East and Africa Automotive Appearance Chemicals Market Revenue Share (%), by Country 2024 & 2032
- Figure 12: Asia Pacific Automotive Appearance Chemicals Market Revenue (Million), by Product Type 2024 & 2032
- Figure 13: Asia Pacific Automotive Appearance Chemicals Market Revenue Share (%), by Product Type 2024 & 2032
- Figure 14: Asia Pacific Automotive Appearance Chemicals Market Revenue (Million), by Application 2024 & 2032
- Figure 15: Asia Pacific Automotive Appearance Chemicals Market Revenue Share (%), by Application 2024 & 2032
- Figure 16: Asia Pacific Automotive Appearance Chemicals Market Revenue (Million), by Country 2024 & 2032
- Figure 17: Asia Pacific Automotive Appearance Chemicals Market Revenue Share (%), by Country 2024 & 2032
- Figure 18: North America Automotive Appearance Chemicals Market Revenue (Million), by Product Type 2024 & 2032
- Figure 19: North America Automotive Appearance Chemicals Market Revenue Share (%), by Product Type 2024 & 2032
- Figure 20: North America Automotive Appearance Chemicals Market Revenue (Million), by Application 2024 & 2032
- Figure 21: North America Automotive Appearance Chemicals Market Revenue Share (%), by Application 2024 & 2032
- Figure 22: North America Automotive Appearance Chemicals Market Revenue (Million), by Country 2024 & 2032
- Figure 23: North America Automotive Appearance Chemicals Market Revenue Share (%), by Country 2024 & 2032
- Figure 24: Europe Automotive Appearance Chemicals Market Revenue (Million), by Product Type 2024 & 2032
- Figure 25: Europe Automotive Appearance Chemicals Market Revenue Share (%), by Product Type 2024 & 2032
- Figure 26: Europe Automotive Appearance Chemicals Market Revenue (Million), by Application 2024 & 2032
- Figure 27: Europe Automotive Appearance Chemicals Market Revenue Share (%), by Application 2024 & 2032
- Figure 28: Europe Automotive Appearance Chemicals Market Revenue (Million), by Country 2024 & 2032
- Figure 29: Europe Automotive Appearance Chemicals Market Revenue Share (%), by Country 2024 & 2032
- Figure 30: South America Automotive Appearance Chemicals Market Revenue (Million), by Product Type 2024 & 2032
- Figure 31: South America Automotive Appearance Chemicals Market Revenue Share (%), by Product Type 2024 & 2032
- Figure 32: South America Automotive Appearance Chemicals Market Revenue (Million), by Application 2024 & 2032
- Figure 33: South America Automotive Appearance Chemicals Market Revenue Share (%), by Application 2024 & 2032
- Figure 34: South America Automotive Appearance Chemicals Market Revenue (Million), by Country 2024 & 2032
- Figure 35: South America Automotive Appearance Chemicals Market Revenue Share (%), by Country 2024 & 2032
- Figure 36: Middle East and Africa Automotive Appearance Chemicals Market Revenue (Million), by Product Type 2024 & 2032
- Figure 37: Middle East and Africa Automotive Appearance Chemicals Market Revenue Share (%), by Product Type 2024 & 2032
- Figure 38: Middle East and Africa Automotive Appearance Chemicals Market Revenue (Million), by Application 2024 & 2032
- Figure 39: Middle East and Africa Automotive Appearance Chemicals Market Revenue Share (%), by Application 2024 & 2032
- Figure 40: Middle East and Africa Automotive Appearance Chemicals Market Revenue (Million), by Country 2024 & 2032
- Figure 41: Middle East and Africa Automotive Appearance Chemicals Market Revenue Share (%), by Country 2024 & 2032
List of Tables
- Table 1: Global Automotive Appearance Chemicals Market Revenue Million Forecast, by Region 2019 & 2032
- Table 2: Global Automotive Appearance Chemicals Market Revenue Million Forecast, by Product Type 2019 & 2032
- Table 3: Global Automotive Appearance Chemicals Market Revenue Million Forecast, by Application 2019 & 2032
- Table 4: Global Automotive Appearance Chemicals Market Revenue Million Forecast, by Region 2019 & 2032
- Table 5: Global Automotive Appearance Chemicals Market Revenue Million Forecast, by Country 2019 & 2032
- Table 6: China Automotive Appearance Chemicals Market Revenue (Million) Forecast, by Application 2019 & 2032
- Table 7: India Automotive Appearance Chemicals Market Revenue (Million) Forecast, by Application 2019 & 2032
- Table 8: Japan Automotive Appearance Chemicals Market Revenue (Million) Forecast, by Application 2019 & 2032
- Table 9: South Korea Automotive Appearance Chemicals Market Revenue (Million) Forecast, by Application 2019 & 2032
- Table 10: Rest of Asia Pacific Automotive Appearance Chemicals Market Revenue (Million) Forecast, by Application 2019 & 2032
- Table 11: Global Automotive Appearance Chemicals Market Revenue Million Forecast, by Country 2019 & 2032
- Table 12: United States Automotive Appearance Chemicals Market Revenue (Million) Forecast, by Application 2019 & 2032
- Table 13: Canada Automotive Appearance Chemicals Market Revenue (Million) Forecast, by Application 2019 & 2032
- Table 14: Mexico Automotive Appearance Chemicals Market Revenue (Million) Forecast, by Application 2019 & 2032
- Table 15: Global Automotive Appearance Chemicals Market Revenue Million Forecast, by Country 2019 & 2032
- Table 16: Germany Automotive Appearance Chemicals Market Revenue (Million) Forecast, by Application 2019 & 2032
- Table 17: United Kingdom Automotive Appearance Chemicals Market Revenue (Million) Forecast, by Application 2019 & 2032
- Table 18: France Automotive Appearance Chemicals Market Revenue (Million) Forecast, by Application 2019 & 2032
- Table 19: Italy Automotive Appearance Chemicals Market Revenue (Million) Forecast, by Application 2019 & 2032
- Table 20: Rest of Europe Automotive Appearance Chemicals Market Revenue (Million) Forecast, by Application 2019 & 2032
- Table 21: Global Automotive Appearance Chemicals Market Revenue Million Forecast, by Country 2019 & 2032
- Table 22: Brazil Automotive Appearance Chemicals Market Revenue (Million) Forecast, by Application 2019 & 2032
- Table 23: Argentina Automotive Appearance Chemicals Market Revenue (Million) Forecast, by Application 2019 & 2032
- Table 24: Rest of South America Automotive Appearance Chemicals Market Revenue (Million) Forecast, by Application 2019 & 2032
- Table 25: Global Automotive Appearance Chemicals Market Revenue Million Forecast, by Country 2019 & 2032
- Table 26: Saudi Arabia Automotive Appearance Chemicals Market Revenue (Million) Forecast, by Application 2019 & 2032
- Table 27: South Africa Automotive Appearance Chemicals Market Revenue (Million) Forecast, by Application 2019 & 2032
- Table 28: Rest of Middle East and Africa Automotive Appearance Chemicals Market Revenue (Million) Forecast, by Application 2019 & 2032
- Table 29: Global Automotive Appearance Chemicals Market Revenue Million Forecast, by Product Type 2019 & 2032
- Table 30: Global Automotive Appearance Chemicals Market Revenue Million Forecast, by Application 2019 & 2032
- Table 31: Global Automotive Appearance Chemicals Market Revenue Million Forecast, by Country 2019 & 2032
- Table 32: China Automotive Appearance Chemicals Market Revenue (Million) Forecast, by Application 2019 & 2032
- Table 33: India Automotive Appearance Chemicals Market Revenue (Million) Forecast, by Application 2019 & 2032
- Table 34: Japan Automotive Appearance Chemicals Market Revenue (Million) Forecast, by Application 2019 & 2032
- Table 35: South Korea Automotive Appearance Chemicals Market Revenue (Million) Forecast, by Application 2019 & 2032
- Table 36: Rest of Asia Pacific Automotive Appearance Chemicals Market Revenue (Million) Forecast, by Application 2019 & 2032
- Table 37: Global Automotive Appearance Chemicals Market Revenue Million Forecast, by Product Type 2019 & 2032
- Table 38: Global Automotive Appearance Chemicals Market Revenue Million Forecast, by Application 2019 & 2032
- Table 39: Global Automotive Appearance Chemicals Market Revenue Million Forecast, by Country 2019 & 2032
- Table 40: United States Automotive Appearance Chemicals Market Revenue (Million) Forecast, by Application 2019 & 2032
- Table 41: Canada Automotive Appearance Chemicals Market Revenue (Million) Forecast, by Application 2019 & 2032
- Table 42: Mexico Automotive Appearance Chemicals Market Revenue (Million) Forecast, by Application 2019 & 2032
- Table 43: Global Automotive Appearance Chemicals Market Revenue Million Forecast, by Product Type 2019 & 2032
- Table 44: Global Automotive Appearance Chemicals Market Revenue Million Forecast, by Application 2019 & 2032
- Table 45: Global Automotive Appearance Chemicals Market Revenue Million Forecast, by Country 2019 & 2032
- Table 46: Germany Automotive Appearance Chemicals Market Revenue (Million) Forecast, by Application 2019 & 2032
- Table 47: United Kingdom Automotive Appearance Chemicals Market Revenue (Million) Forecast, by Application 2019 & 2032
- Table 48: France Automotive Appearance Chemicals Market Revenue (Million) Forecast, by Application 2019 & 2032
- Table 49: Italy Automotive Appearance Chemicals Market Revenue (Million) Forecast, by Application 2019 & 2032
- Table 50: Rest of Europe Automotive Appearance Chemicals Market Revenue (Million) Forecast, by Application 2019 & 2032
- Table 51: Global Automotive Appearance Chemicals Market Revenue Million Forecast, by Product Type 2019 & 2032
- Table 52: Global Automotive Appearance Chemicals Market Revenue Million Forecast, by Application 2019 & 2032
- Table 53: Global Automotive Appearance Chemicals Market Revenue Million Forecast, by Country 2019 & 2032
- Table 54: Brazil Automotive Appearance Chemicals Market Revenue (Million) Forecast, by Application 2019 & 2032
- Table 55: Argentina Automotive Appearance Chemicals Market Revenue (Million) Forecast, by Application 2019 & 2032
- Table 56: Rest of South America Automotive Appearance Chemicals Market Revenue (Million) Forecast, by Application 2019 & 2032
- Table 57: Global Automotive Appearance Chemicals Market Revenue Million Forecast, by Product Type 2019 & 2032
- Table 58: Global Automotive Appearance Chemicals Market Revenue Million Forecast, by Application 2019 & 2032
- Table 59: Global Automotive Appearance Chemicals Market Revenue Million Forecast, by Country 2019 & 2032
- Table 60: Saudi Arabia Automotive Appearance Chemicals Market Revenue (Million) Forecast, by Application 2019 & 2032
- Table 61: South Africa Automotive Appearance Chemicals Market Revenue (Million) Forecast, by Application 2019 & 2032
- Table 62: Rest of Middle East and Africa Automotive Appearance Chemicals Market Revenue (Million) Forecast, by Application 2019 & 2032
Frequently Asked Questions
1. What is the projected Compound Annual Growth Rate (CAGR) of the Automotive Appearance Chemicals Market?
The projected CAGR is approximately 3.34%.
2. Which companies are prominent players in the Automotive Appearance Chemicals Market?
Key companies in the market include Niteo Products Inc, SONAX GmbH, Guangzhou Biaobang Car Care Industry Co Ltd, 3M, Tetrosyl Ltd, Nuvite Chemical Compounds, Dow, ITW Global Brands, Turtle Wax Inc, LIQUI MOLY GmbH, Valvoline Chemicals*List Not Exhaustive, General Chemical Corp.
3. What are the main segments of the Automotive Appearance Chemicals Market?
The market segments include Product Type, Application.
4. Can you provide details about the market size?
The market size is estimated to be USD 1.19 Million as of 2022.
5. What are some drivers contributing to market growth?
Increase in the Production of Electric Vehicles (EV); Increase in Consumer Awareness Toward Vehicle Maintenance; Other Drivers.
6. What are the notable trends driving market growth?
Increase in the Production of Electric Vehicles.
7. Are there any restraints impacting market growth?
Stringent Government Regulations on Petroleum Products like Waxes and Coatings; Other Restraints.
8. Can you provide examples of recent developments in the market?
Recent developments in the market studied will be covered in the complete report.
9. What pricing options are available for accessing the report?
Pricing options include single-user, multi-user, and enterprise licenses priced at USD 4750, USD 5250, and USD 8750 respectively.
10. Is the market size provided in terms of value or volume?
The market size is provided in terms of value, measured in Million.
11. Are there any specific market keywords associated with the report?
Yes, the market keyword associated with the report is "Automotive Appearance Chemicals Market," which aids in identifying and referencing the specific market segment covered.
12. How do I determine which pricing option suits my needs best?
The pricing options vary based on user requirements and access needs. Individual users may opt for single-user licenses, while businesses requiring broader access may choose multi-user or enterprise licenses for cost-effective access to the report.
13. Are there any additional resources or data provided in the Automotive Appearance Chemicals Market report?
While the report offers comprehensive insights, it's advisable to review the specific contents or supplementary materials provided to ascertain if additional resources or data are available.
14. How can I stay updated on further developments or reports in the Automotive Appearance Chemicals Market?
To stay informed about further developments, trends, and reports in the Automotive Appearance Chemicals Market, consider subscribing to industry newsletters, following relevant companies and organizations, or regularly checking reputable industry news sources and publications.
Methodology
Step 1 - Identification of Relevant Samples Size from Population Database


Step 2 - Approaches for Defining Global Market Size (Value, Volume* & Price*)

Note*: In applicable scenarios
Step 3 - Data Sources
Primary Research
- Web Analytics
- Survey Reports
- Research Institute
- Latest Research Reports
- Opinion Leaders
Secondary Research
- Annual Reports
- White Paper
- Latest Press Release
- Industry Association
- Paid Database
- Investor Presentations

Step 4 - Data Triangulation
Involves using different sources of information in order to increase the validity of a study
These sources are likely to be stakeholders in a program - participants, other researchers, program staff, other community members, and so on.
Then we put all data in single framework & apply various statistical tools to find out the dynamic on the market.
During the analysis stage, feedback from the stakeholder groups would be compared to determine areas of agreement as well as areas of divergence
