

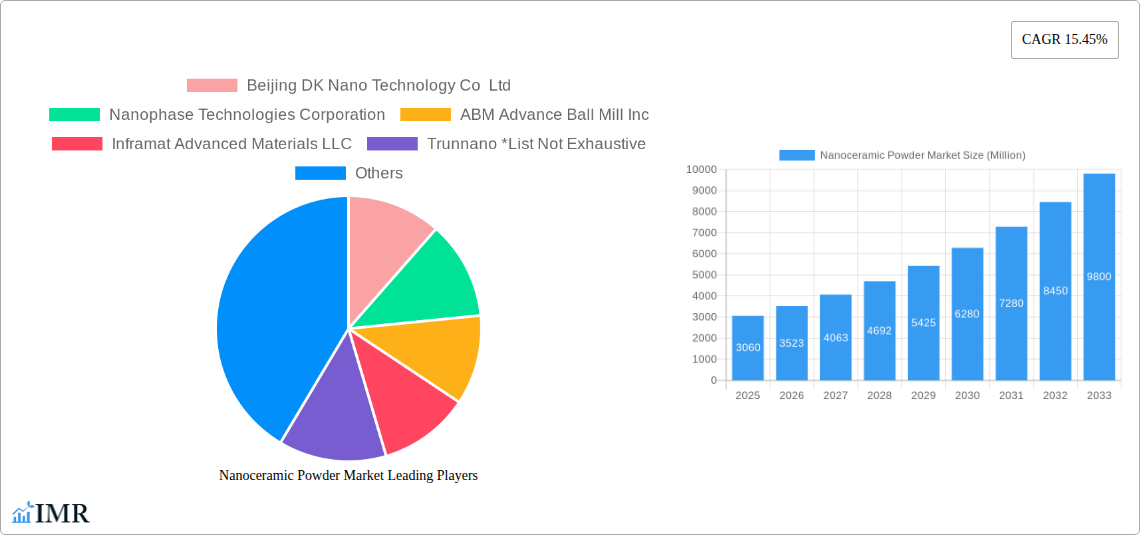
Key Insights
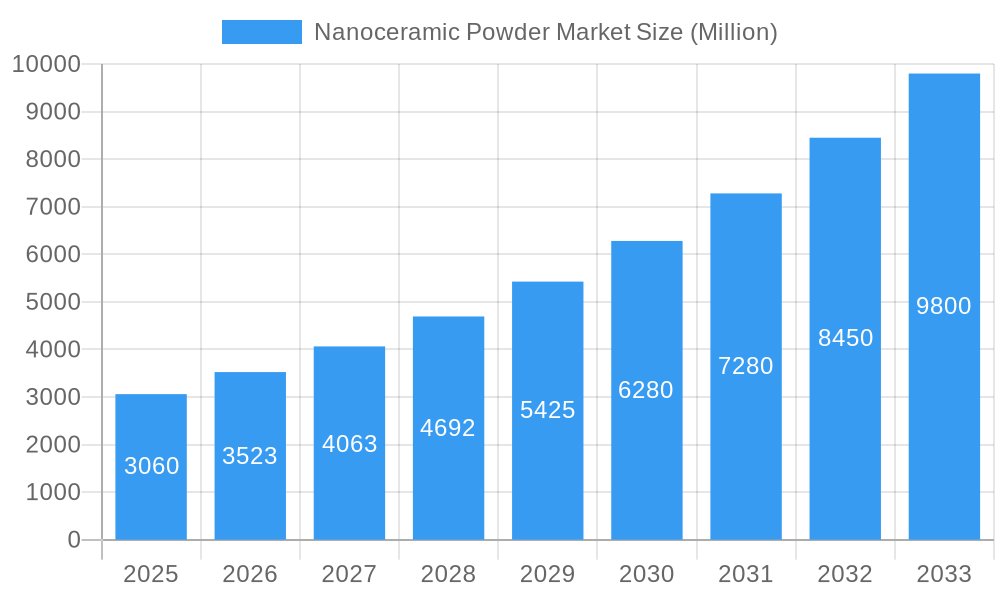
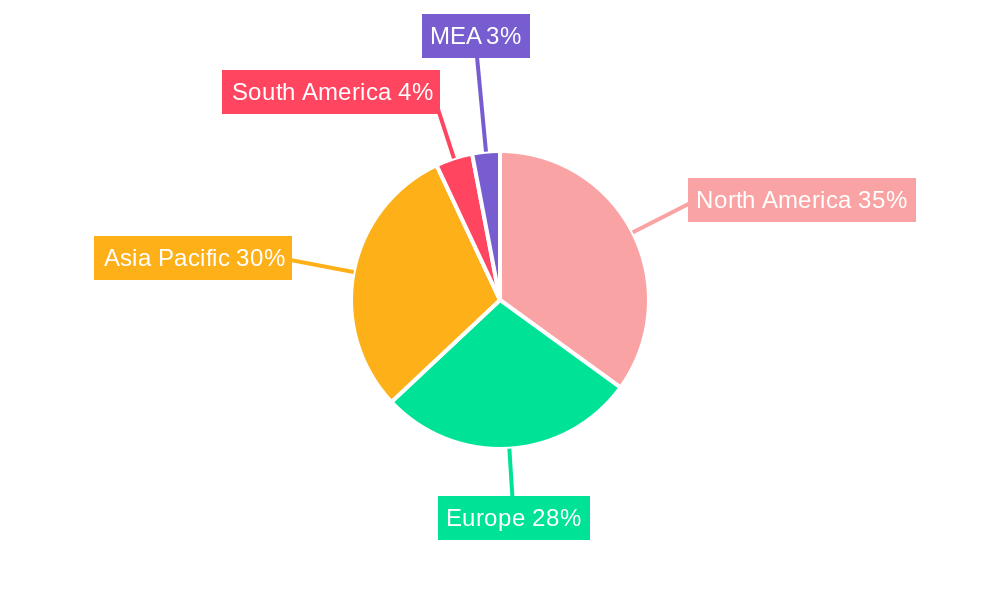
The nanoceramic powder market, valued at $3.06 billion in 2025, is projected to experience robust growth, driven by increasing demand across diverse sectors. A Compound Annual Growth Rate (CAGR) of 15.45% from 2025 to 2033 signifies a significant expansion, primarily fueled by the escalating adoption of nanoceramic powders in high-performance electronics, advanced materials, and biomedical applications. The market's segmentation reveals strong growth across various powder types, with oxide powders likely dominating due to their versatile properties and wide-ranging applications. The electrical and electronics sector is expected to be a major end-user, owing to the unique electrical and thermal properties of nanoceramic powders, crucial in miniaturization and improved performance of electronic components. The transportation industry's push for lighter, stronger, and more fuel-efficient vehicles further boosts demand, particularly for ceramic matrix composites. Similarly, the medical field's adoption of nanoceramic materials in biocompatible implants and drug delivery systems contributes significantly to market growth. While certain geographical regions like North America and Asia-Pacific currently hold larger market shares, the growth potential across emerging economies in regions like South America and the Middle East & Africa is noteworthy. However, the market's growth trajectory may encounter some challenges, including the high cost of production and potential environmental concerns associated with specific manufacturing processes.
Nanoceramic Powder Market Market Size (In Billion)
The competitive landscape features both established players and emerging companies, highlighting the market's dynamic nature. Companies like Nanophase Technologies Corporation and Tosoh Corporation leverage their technological advancements and strong distribution networks to maintain a competitive edge. However, the emergence of smaller, specialized companies offering niche products and innovative solutions presents a dynamic competitive environment. The ongoing research and development efforts focused on improving nanoceramic powder synthesis, enhancing properties, and exploring novel applications are key drivers propelling further market expansion. Future growth will be shaped by continued technological innovations, strategic collaborations between material suppliers and end-users, and the increasing focus on sustainable manufacturing practices. Regulatory landscapes and stringent safety standards related to nanomaterials will also play a significant role in shaping the market's future.
Nanoceramic Powder Market Company Market Share
Nanoceramic Powder Market: A Comprehensive Analysis (2019-2033)
This comprehensive report offers an in-depth analysis of the global Nanoceramic Powder Market, providing crucial insights for industry professionals, investors, and strategic decision-makers. The study period spans from 2019 to 2033, with 2025 serving as the base and estimated year. The report meticulously examines market dynamics, growth trends, regional dominance, and the competitive landscape, offering a granular view of this rapidly evolving sector. The market is segmented by type (Oxide Powder, Carbide Powder, Nitride Powder, Boron Powder, Other Types) and end-user industry (Electrical and Electronics, Industrial, Transportation, Medical, Chemical, Defense, Other End-user Industries). The report’s value is presented in million units.
Key Players Analyzed: Beijing DK Nano Technology Co Ltd, Nanophase Technologies Corporation, ABM Advance Ball Mill Inc, Inframat Advanced Materials LLC, Trunnano, Tosoh Corporation, Cerion LLC, NYACOL Nano Technologies Inc, Innovnano-materiais Avancados SA (List Not Exhaustive)
Nanoceramic Powder Market Market Dynamics & Structure
The Nanoceramic Powder market exhibits a moderately concentrated structure, with a few major players holding significant market share. Technological innovation, particularly in synthesis techniques and particle size control, is a key driver, fueling the development of advanced nanoceramic materials with enhanced properties. Stringent regulatory frameworks concerning material safety and environmental impact are shaping manufacturing practices. Competitive pressure from alternative materials, along with the increasing demand for high-performance ceramics in diverse applications, are crucial factors. Mergers and acquisitions (M&A) activity in the sector has been moderate, with xx deals recorded between 2019 and 2024, representing a xx% market share.
- Market Concentration: Moderately concentrated, with top 5 players holding approximately xx% market share in 2024.
- Technological Innovation: Focus on improved synthesis methods, particle size reduction, and functionalization.
- Regulatory Landscape: Stringent safety and environmental regulations impacting manufacturing processes.
- Competitive Substitutes: Competition from advanced polymers and other high-performance materials.
- M&A Activity: xx deals between 2019 and 2024, contributing to market consolidation.
- Innovation Barriers: High R&D costs and complex synthesis processes.
Nanoceramic Powder Market Growth Trends & Insights
The global nanoceramic powder market is experiencing robust growth, driven by increasing demand from various end-use sectors. The market size reached xx million units in 2024, exhibiting a CAGR of xx% during the historical period (2019-2024). This growth trajectory is projected to continue throughout the forecast period (2025-2033), with a projected CAGR of xx%, reaching an estimated xx million units by 2033. This expansion is fueled by technological advancements, leading to improved material properties and expanded applications. The adoption rate is increasing across key industries, driven by consumer preferences for lighter, stronger, and more energy-efficient products. Specific advancements in areas like 3D printing and additive manufacturing are further accelerating the adoption of nanoceramic powders.
Dominant Regions, Countries, or Segments in Nanoceramic Powder Market
The North American region currently dominates the nanoceramic powder market, driven by strong demand from the electronics and automotive industries. The strong presence of key players and robust research infrastructure are major contributing factors. Asia-Pacific shows promising growth potential, fueled by rapid industrialization and government initiatives promoting technological advancement. Within the segments, Oxide powders currently hold the largest market share, due to their versatility and broad applications. However, Carbide and Nitride powders are experiencing the fastest growth rates, primarily driven by their use in high-temperature and wear-resistant applications.
- Leading Region: North America (xx% market share in 2024)
- High-Growth Region: Asia-Pacific (projected CAGR of xx% during 2025-2033)
- Dominant Type: Oxide Powder (xx% market share in 2024)
- Fastest-Growing Type: Carbide and Nitride powders.
- Key Drivers: Government investment in R&D, technological advancements, increasing industrialization.
Nanoceramic Powder Market Product Landscape
Nanoceramic powder products are characterized by their unique particle size distribution, surface area, and morphology, impacting their performance across various applications. Recent innovations focus on tailoring the properties of the powder to meet the specific requirements of different industries. Unique selling propositions include enhanced mechanical strength, thermal conductivity, and chemical resistance. Advancements in production techniques are leading to improved consistency and reduced production costs. The market is seeing increasing focus on the development of specialized powders with enhanced properties for specific high-value applications.
Key Drivers, Barriers & Challenges in Nanoceramic Powder Market
Key Drivers: Rising demand from electronics and automotive industries; advancements in nanotechnology; government funding for research and development; growing need for high-performance materials.
Challenges: High production costs; complex synthesis processes; potential health and environmental concerns; competition from alternative materials; supply chain disruptions impacting material availability and pricing. The impact of these challenges is estimated to negatively influence market growth by approximately xx% by 2033.
Emerging Opportunities in Nanoceramic Powder Market
Untapped markets in emerging economies, particularly in Asia and Africa, represent significant opportunities for market expansion. The development of novel applications in energy storage, biomedical devices, and advanced sensors offers vast potential. The rising demand for sustainable and environmentally friendly materials is creating opportunities for biodegradable and recyclable nanoceramic powders.
Growth Accelerators in the Nanoceramic Powder Market Industry
Technological advancements in synthesis techniques, such as sol-gel and hydrothermal methods, are accelerating production efficiency and enabling the development of novel nanoceramic materials. Strategic partnerships between research institutions and manufacturers are fostering innovation. Market expansion strategies targeting emerging economies and niche applications are driving long-term growth.
Key Players Shaping the Nanoceramic Powder Market Market
- Nanophase Technologies Corporation
- ABM Advance Ball Mill Inc
- Inframat Advanced Materials LLC
- Trunnano
- Tosoh Corporation
- Cerion LLC
- NYACOL Nano Technologies Inc
- Innovnano-materiais Avancados SA
- Beijing DK Nano Technology Co Ltd
Notable Milestones in Nanoceramic Powder Market Sector
- 2021: Introduction of a new high-purity alumina nanoceramic powder by Nanophase Technologies Corporation.
- 2022: Strategic partnership between Inframat Advanced Materials LLC and a major automotive manufacturer.
- 2023: Acquisition of a smaller nanoceramic powder producer by Tosoh Corporation.
- 2024: Significant investment in R&D by Beijing DK Nano Technology Co Ltd, leading to novel material properties.
In-Depth Nanoceramic Powder Market Market Outlook
The nanoceramic powder market is poised for continued strong growth, driven by technological innovations and expanding applications across diverse sectors. Strategic investments in R&D and the development of new manufacturing processes will further propel the market. The focus on sustainability and the exploration of new applications in areas like energy storage and biomedicine will continue to shape the future of the market. The market is projected to reach xx million units by 2033, representing significant growth opportunities for key players and new entrants alike.
Nanoceramic Powder Market Segmentation
-
1. Type
- 1.1. Oxide Powder
- 1.2. Carbide Powder
- 1.3. Nitride Powder
- 1.4. Boron Powder
- 1.5. Other Types
-
2. End-user Industry
- 2.1. Electrical and Electronics
- 2.2. Industrial
- 2.3. Transportation
- 2.4. Medical
- 2.5. Chemical
- 2.6. Defense
- 2.7. Other End-user Industries
Nanoceramic Powder Market Segmentation By Geography
-
1. Asia Pacific
- 1.1. China
- 1.2. India
- 1.3. Japan
- 1.4. South Korea
- 1.5. Rest of Asia Pacific
-
2. Europe
- 2.1. Germany
- 2.2. United Kingdom
- 2.3. France
- 2.4. Italy
- 2.5. Rest of Europe
-
3. North America
- 3.1. United States
- 3.2. Canada
- 3.3. Mexico
- 4. Rest of the World
Nanoceramic Powder Market Regional Market Share
Geographic Coverage of Nanoceramic Powder Market
Nanoceramic Powder Market REPORT HIGHLIGHTS
| Aspects | Details |
|---|---|
| Study Period | 2020-2034 |
| Base Year | 2025 |
| Estimated Year | 2026 |
| Forecast Period | 2026-2034 |
| Historical Period | 2020-2025 |
| Growth Rate | CAGR of 15.45% from 2020-2034 |
| Segmentation |
|
Table of Contents
- 1. Introduction
- 1.1. Research Scope
- 1.2. Market Segmentation
- 1.3. Research Objective
- 1.4. Definitions and Assumptions
- 2. Executive Summary
- 2.1. Market Snapshot
- 3. Market Dynamics
- 3.1. Market Drivers
- 3.2. Market Restrains
- 3.3. Market Trends
- 3.4. Market Opportunities
- 4. Market Factor Analysis
- 4.1. Porters Five Forces
- 4.1.1. Bargaining Power of Suppliers
- 4.1.2. Bargaining Power of Buyers
- 4.1.3. Threat of New Entrants
- 4.1.4. Threat of Substitutes
- 4.1.5. Competitive Rivalry
- 4.2. PESTEL analysis
- 4.3. BCG Analysis
- 4.3.1. Stars (High Growth, High Market Share)
- 4.3.2. Cash Cows (Low Growth, High Market Share)
- 4.3.3. Question Mark (High Growth, Low Market Share)
- 4.3.4. Dogs (Low Growth, Low Market Share)
- 4.4. Ansoff Matrix Analysis
- 4.5. Supply Chain Analysis
- 4.6. Regulatory Landscape
- 4.7. Current Market Potential and Opportunity Assessment (TAM–SAM–SOM Framework)
- 4.8. IMR Analyst Note
- 4.1. Porters Five Forces
- 5. Market Analysis, Insights and Forecast 2021-2033
- 5.1. Market Analysis, Insights and Forecast - by Type
- 5.1.1. Oxide Powder
- 5.1.2. Carbide Powder
- 5.1.3. Nitride Powder
- 5.1.4. Boron Powder
- 5.1.5. Other Types
- 5.2. Market Analysis, Insights and Forecast - by End-user Industry
- 5.2.1. Electrical and Electronics
- 5.2.2. Industrial
- 5.2.3. Transportation
- 5.2.4. Medical
- 5.2.5. Chemical
- 5.2.6. Defense
- 5.2.7. Other End-user Industries
- 5.3. Market Analysis, Insights and Forecast - by Region
- 5.3.1. Asia Pacific
- 5.3.2. Europe
- 5.3.3. North America
- 5.3.4. Rest of the World
- 5.1. Market Analysis, Insights and Forecast - by Type
- 6. Global Nanoceramic Powder Market Analysis, Insights and Forecast, 2021-2033
- 6.1. Market Analysis, Insights and Forecast - by Type
- 6.1.1. Oxide Powder
- 6.1.2. Carbide Powder
- 6.1.3. Nitride Powder
- 6.1.4. Boron Powder
- 6.1.5. Other Types
- 6.2. Market Analysis, Insights and Forecast - by End-user Industry
- 6.2.1. Electrical and Electronics
- 6.2.2. Industrial
- 6.2.3. Transportation
- 6.2.4. Medical
- 6.2.5. Chemical
- 6.2.6. Defense
- 6.2.7. Other End-user Industries
- 6.1. Market Analysis, Insights and Forecast - by Type
- 7. Asia Pacific Nanoceramic Powder Market Analysis, Insights and Forecast, 2020-2032
- 7.1. Market Analysis, Insights and Forecast - by Type
- 7.1.1. Oxide Powder
- 7.1.2. Carbide Powder
- 7.1.3. Nitride Powder
- 7.1.4. Boron Powder
- 7.1.5. Other Types
- 7.2. Market Analysis, Insights and Forecast - by End-user Industry
- 7.2.1. Electrical and Electronics
- 7.2.2. Industrial
- 7.2.3. Transportation
- 7.2.4. Medical
- 7.2.5. Chemical
- 7.2.6. Defense
- 7.2.7. Other End-user Industries
- 7.1. Market Analysis, Insights and Forecast - by Type
- 8. Europe Nanoceramic Powder Market Analysis, Insights and Forecast, 2020-2032
- 8.1. Market Analysis, Insights and Forecast - by Type
- 8.1.1. Oxide Powder
- 8.1.2. Carbide Powder
- 8.1.3. Nitride Powder
- 8.1.4. Boron Powder
- 8.1.5. Other Types
- 8.2. Market Analysis, Insights and Forecast - by End-user Industry
- 8.2.1. Electrical and Electronics
- 8.2.2. Industrial
- 8.2.3. Transportation
- 8.2.4. Medical
- 8.2.5. Chemical
- 8.2.6. Defense
- 8.2.7. Other End-user Industries
- 8.1. Market Analysis, Insights and Forecast - by Type
- 9. North America Nanoceramic Powder Market Analysis, Insights and Forecast, 2020-2032
- 9.1. Market Analysis, Insights and Forecast - by Type
- 9.1.1. Oxide Powder
- 9.1.2. Carbide Powder
- 9.1.3. Nitride Powder
- 9.1.4. Boron Powder
- 9.1.5. Other Types
- 9.2. Market Analysis, Insights and Forecast - by End-user Industry
- 9.2.1. Electrical and Electronics
- 9.2.2. Industrial
- 9.2.3. Transportation
- 9.2.4. Medical
- 9.2.5. Chemical
- 9.2.6. Defense
- 9.2.7. Other End-user Industries
- 9.1. Market Analysis, Insights and Forecast - by Type
- 10. Rest of the World Nanoceramic Powder Market Analysis, Insights and Forecast, 2020-2032
- 10.1. Market Analysis, Insights and Forecast - by Type
- 10.1.1. Oxide Powder
- 10.1.2. Carbide Powder
- 10.1.3. Nitride Powder
- 10.1.4. Boron Powder
- 10.1.5. Other Types
- 10.2. Market Analysis, Insights and Forecast - by End-user Industry
- 10.2.1. Electrical and Electronics
- 10.2.2. Industrial
- 10.2.3. Transportation
- 10.2.4. Medical
- 10.2.5. Chemical
- 10.2.6. Defense
- 10.2.7. Other End-user Industries
- 10.1. Market Analysis, Insights and Forecast - by Type
- 11. Competitive Analysis
- 11.1. Company Profiles
- 11.1.1 Beijing DK Nano Technology Co Ltd
- 11.1.1.1. Company Overview
- 11.1.1.2. Products
- 11.1.1.3. Company Financials
- 11.1.1.4. SWOT Analysis
- 11.1.2 Nanophase Technologies Corporation
- 11.1.2.1. Company Overview
- 11.1.2.2. Products
- 11.1.2.3. Company Financials
- 11.1.2.4. SWOT Analysis
- 11.1.3 ABM Advance Ball Mill Inc
- 11.1.3.1. Company Overview
- 11.1.3.2. Products
- 11.1.3.3. Company Financials
- 11.1.3.4. SWOT Analysis
- 11.1.4 Inframat Advanced Materials LLC
- 11.1.4.1. Company Overview
- 11.1.4.2. Products
- 11.1.4.3. Company Financials
- 11.1.4.4. SWOT Analysis
- 11.1.5 Trunnano *List Not Exhaustive
- 11.1.5.1. Company Overview
- 11.1.5.2. Products
- 11.1.5.3. Company Financials
- 11.1.5.4. SWOT Analysis
- 11.1.6 Tosoh Corporation
- 11.1.6.1. Company Overview
- 11.1.6.2. Products
- 11.1.6.3. Company Financials
- 11.1.6.4. SWOT Analysis
- 11.1.7 Cerion LLC
- 11.1.7.1. Company Overview
- 11.1.7.2. Products
- 11.1.7.3. Company Financials
- 11.1.7.4. SWOT Analysis
- 11.1.8 NYACOL Nano Technologies Inc
- 11.1.8.1. Company Overview
- 11.1.8.2. Products
- 11.1.8.3. Company Financials
- 11.1.8.4. SWOT Analysis
- 11.1.9 Innovnano-materiais Avancados SA
- 11.1.9.1. Company Overview
- 11.1.9.2. Products
- 11.1.9.3. Company Financials
- 11.1.9.4. SWOT Analysis
- 11.1.1 Beijing DK Nano Technology Co Ltd
- 11.2. Market Entropy
- 11.2.1 Company's Key Areas Served
- 11.2.2 Recent Developments
- 11.3. Company Market Share Analysis 2025
- 11.3.1 Top 5 Companies Market Share Analysis
- 11.3.2 Top 3 Companies Market Share Analysis
- 11.4. List of Potential Customers
- 12. Research Methodology
List of Figures
- Figure 1: Global Nanoceramic Powder Market Revenue Breakdown (Million, %) by Region 2025 & 2033
- Figure 2: Asia Pacific Nanoceramic Powder Market Revenue (Million), by Type 2025 & 2033
- Figure 3: Asia Pacific Nanoceramic Powder Market Revenue Share (%), by Type 2025 & 2033
- Figure 4: Asia Pacific Nanoceramic Powder Market Revenue (Million), by End-user Industry 2025 & 2033
- Figure 5: Asia Pacific Nanoceramic Powder Market Revenue Share (%), by End-user Industry 2025 & 2033
- Figure 6: Asia Pacific Nanoceramic Powder Market Revenue (Million), by Country 2025 & 2033
- Figure 7: Asia Pacific Nanoceramic Powder Market Revenue Share (%), by Country 2025 & 2033
- Figure 8: Europe Nanoceramic Powder Market Revenue (Million), by Type 2025 & 2033
- Figure 9: Europe Nanoceramic Powder Market Revenue Share (%), by Type 2025 & 2033
- Figure 10: Europe Nanoceramic Powder Market Revenue (Million), by End-user Industry 2025 & 2033
- Figure 11: Europe Nanoceramic Powder Market Revenue Share (%), by End-user Industry 2025 & 2033
- Figure 12: Europe Nanoceramic Powder Market Revenue (Million), by Country 2025 & 2033
- Figure 13: Europe Nanoceramic Powder Market Revenue Share (%), by Country 2025 & 2033
- Figure 14: North America Nanoceramic Powder Market Revenue (Million), by Type 2025 & 2033
- Figure 15: North America Nanoceramic Powder Market Revenue Share (%), by Type 2025 & 2033
- Figure 16: North America Nanoceramic Powder Market Revenue (Million), by End-user Industry 2025 & 2033
- Figure 17: North America Nanoceramic Powder Market Revenue Share (%), by End-user Industry 2025 & 2033
- Figure 18: North America Nanoceramic Powder Market Revenue (Million), by Country 2025 & 2033
- Figure 19: North America Nanoceramic Powder Market Revenue Share (%), by Country 2025 & 2033
- Figure 20: Rest of the World Nanoceramic Powder Market Revenue (Million), by Type 2025 & 2033
- Figure 21: Rest of the World Nanoceramic Powder Market Revenue Share (%), by Type 2025 & 2033
- Figure 22: Rest of the World Nanoceramic Powder Market Revenue (Million), by End-user Industry 2025 & 2033
- Figure 23: Rest of the World Nanoceramic Powder Market Revenue Share (%), by End-user Industry 2025 & 2033
- Figure 24: Rest of the World Nanoceramic Powder Market Revenue (Million), by Country 2025 & 2033
- Figure 25: Rest of the World Nanoceramic Powder Market Revenue Share (%), by Country 2025 & 2033
List of Tables
- Table 1: Global Nanoceramic Powder Market Revenue Million Forecast, by Type 2020 & 2033
- Table 2: Global Nanoceramic Powder Market Revenue Million Forecast, by End-user Industry 2020 & 2033
- Table 3: Global Nanoceramic Powder Market Revenue Million Forecast, by Region 2020 & 2033
- Table 4: Global Nanoceramic Powder Market Revenue Million Forecast, by Type 2020 & 2033
- Table 5: Global Nanoceramic Powder Market Revenue Million Forecast, by End-user Industry 2020 & 2033
- Table 6: Global Nanoceramic Powder Market Revenue Million Forecast, by Country 2020 & 2033
- Table 7: China Nanoceramic Powder Market Revenue (Million) Forecast, by Application 2020 & 2033
- Table 8: India Nanoceramic Powder Market Revenue (Million) Forecast, by Application 2020 & 2033
- Table 9: Japan Nanoceramic Powder Market Revenue (Million) Forecast, by Application 2020 & 2033
- Table 10: South Korea Nanoceramic Powder Market Revenue (Million) Forecast, by Application 2020 & 2033
- Table 11: Rest of Asia Pacific Nanoceramic Powder Market Revenue (Million) Forecast, by Application 2020 & 2033
- Table 12: Global Nanoceramic Powder Market Revenue Million Forecast, by Type 2020 & 2033
- Table 13: Global Nanoceramic Powder Market Revenue Million Forecast, by End-user Industry 2020 & 2033
- Table 14: Global Nanoceramic Powder Market Revenue Million Forecast, by Country 2020 & 2033
- Table 15: Germany Nanoceramic Powder Market Revenue (Million) Forecast, by Application 2020 & 2033
- Table 16: United Kingdom Nanoceramic Powder Market Revenue (Million) Forecast, by Application 2020 & 2033
- Table 17: France Nanoceramic Powder Market Revenue (Million) Forecast, by Application 2020 & 2033
- Table 18: Italy Nanoceramic Powder Market Revenue (Million) Forecast, by Application 2020 & 2033
- Table 19: Rest of Europe Nanoceramic Powder Market Revenue (Million) Forecast, by Application 2020 & 2033
- Table 20: Global Nanoceramic Powder Market Revenue Million Forecast, by Type 2020 & 2033
- Table 21: Global Nanoceramic Powder Market Revenue Million Forecast, by End-user Industry 2020 & 2033
- Table 22: Global Nanoceramic Powder Market Revenue Million Forecast, by Country 2020 & 2033
- Table 23: United States Nanoceramic Powder Market Revenue (Million) Forecast, by Application 2020 & 2033
- Table 24: Canada Nanoceramic Powder Market Revenue (Million) Forecast, by Application 2020 & 2033
- Table 25: Mexico Nanoceramic Powder Market Revenue (Million) Forecast, by Application 2020 & 2033
- Table 26: Global Nanoceramic Powder Market Revenue Million Forecast, by Type 2020 & 2033
- Table 27: Global Nanoceramic Powder Market Revenue Million Forecast, by End-user Industry 2020 & 2033
- Table 28: Global Nanoceramic Powder Market Revenue Million Forecast, by Country 2020 & 2033
Frequently Asked Questions
1. What is the projected Compound Annual Growth Rate (CAGR) of the Nanoceramic Powder Market?
The projected CAGR is approximately 15.45%.
2. Which companies are prominent players in the Nanoceramic Powder Market?
Key companies in the market include Beijing DK Nano Technology Co Ltd, Nanophase Technologies Corporation, ABM Advance Ball Mill Inc, Inframat Advanced Materials LLC, Trunnano *List Not Exhaustive, Tosoh Corporation, Cerion LLC, NYACOL Nano Technologies Inc, Innovnano-materiais Avancados SA.
3. What are the main segments of the Nanoceramic Powder Market?
The market segments include Type, End-user Industry.
4. Can you provide details about the market size?
The market size is estimated to be USD 3.06 Million as of 2022.
5. What are some drivers contributing to market growth?
Widespread Use in the Electronics Industry; Increasing Demand from the Healthcare Sector; Increasing Demand for High-performance Ceramic Coatings.
6. What are the notable trends driving market growth?
Increasing Demand from the Electrical and Electronics Industry.
7. Are there any restraints impacting market growth?
High Processing Cost; Other Restraints.
8. Can you provide examples of recent developments in the market?
N/A
9. What pricing options are available for accessing the report?
Pricing options include single-user, multi-user, and enterprise licenses priced at USD 4750, USD 5250, and USD 8750 respectively.
10. Is the market size provided in terms of value or volume?
The market size is provided in terms of value, measured in Million.
11. Are there any specific market keywords associated with the report?
Yes, the market keyword associated with the report is "Nanoceramic Powder Market," which aids in identifying and referencing the specific market segment covered.
12. How do I determine which pricing option suits my needs best?
The pricing options vary based on user requirements and access needs. Individual users may opt for single-user licenses, while businesses requiring broader access may choose multi-user or enterprise licenses for cost-effective access to the report.
13. Are there any additional resources or data provided in the Nanoceramic Powder Market report?
While the report offers comprehensive insights, it's advisable to review the specific contents or supplementary materials provided to ascertain if additional resources or data are available.
14. How can I stay updated on further developments or reports in the Nanoceramic Powder Market?
To stay informed about further developments, trends, and reports in the Nanoceramic Powder Market, consider subscribing to industry newsletters, following relevant companies and organizations, or regularly checking reputable industry news sources and publications.
Methodology
Step 1 - Identification of Relevant Samples Size from Population Database


Step 2 - Approaches for Defining Global Market Size (Value, Volume* & Price*)

Note*: In applicable scenarios
Step 3 - Data Sources
Primary Research
- Web Analytics
- Survey Reports
- Research Institute
- Latest Research Reports
- Opinion Leaders
Secondary Research
- Annual Reports
- White Paper
- Latest Press Release
- Industry Association
- Paid Database
- Investor Presentations

Step 4 - Data Triangulation
Involves using different sources of information in order to increase the validity of a study
These sources are likely to be stakeholders in a program - participants, other researchers, program staff, other community members, and so on.
Then we put all data in single framework & apply various statistical tools to find out the dynamic on the market.
During the analysis stage, feedback from the stakeholder groups would be compared to determine areas of agreement as well as areas of divergence