

Key Insights
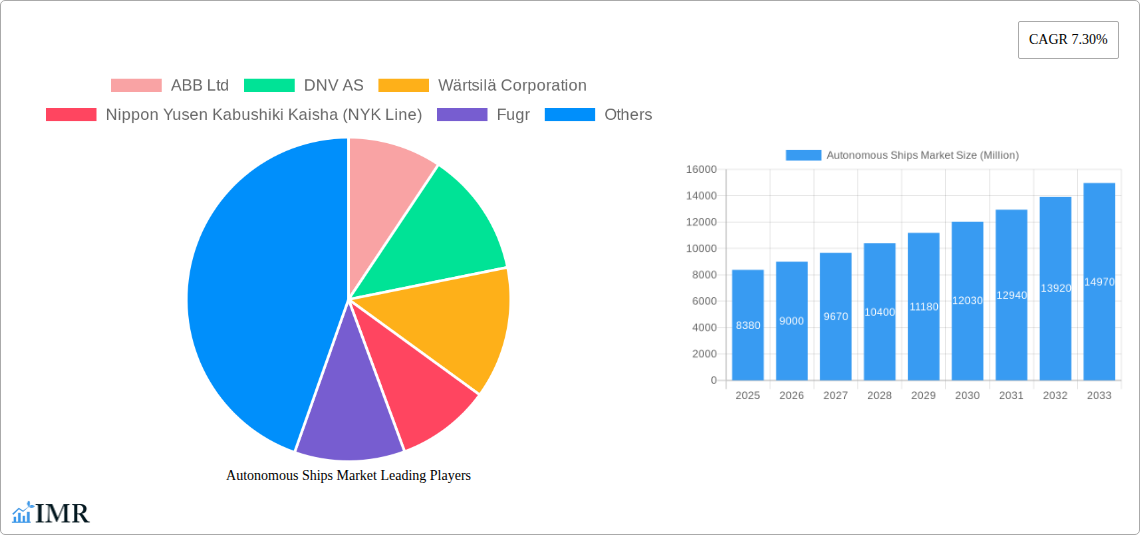
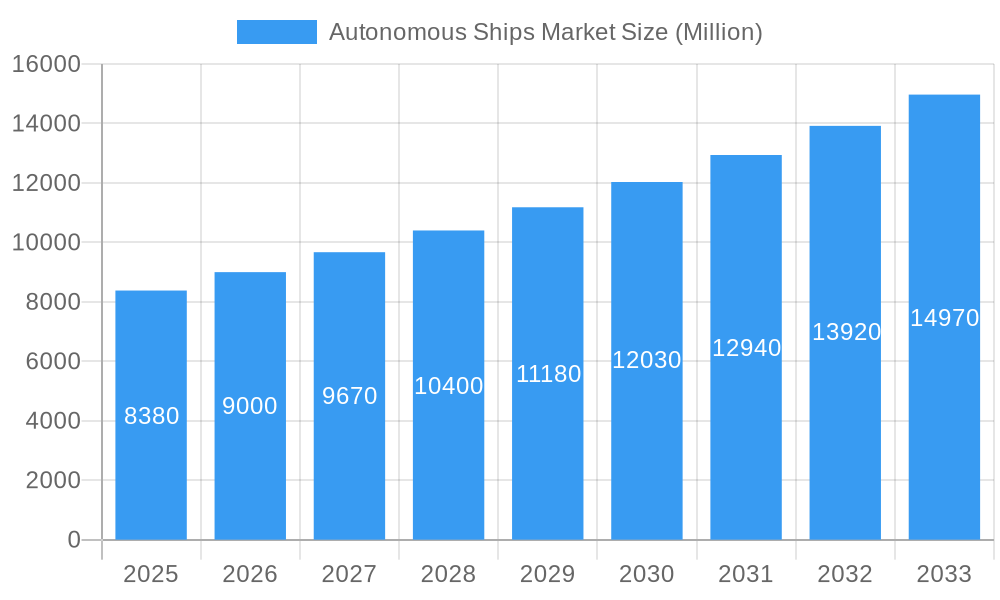
The autonomous ships market is experiencing significant growth, driven by increasing demand for enhanced safety, efficiency, and reduced operational costs within the maritime industry. The market, valued at $8.38 billion in 2025, is projected to expand at a Compound Annual Growth Rate (CAGR) of 7.30% from 2025 to 2033. Several factors contribute to this upward trajectory. Firstly, advancements in artificial intelligence (AI), sensor technologies, and automation are enabling the development of increasingly sophisticated autonomous vessel systems, capable of navigating complex maritime environments and performing various tasks with minimal human intervention. Secondly, the maritime industry faces persistent challenges related to crew shortages, rising labor costs, and safety concerns. Autonomous shipping presents a viable solution to address these issues, leading to increased adoption across commercial and military applications. The fully autonomous segment is expected to witness the most significant growth due to its potential to revolutionize long-haul shipping and reduce reliance on human crews. However, regulatory hurdles, cybersecurity risks, and the need for robust infrastructure development pose significant restraints to market expansion.
Autonomous Ships Market Market Size (In Billion)
Despite these challenges, the market's future prospects remain positive. The increasing focus on environmental sustainability and the need for reduced greenhouse gas emissions are further driving interest in autonomous vessels. These vessels can be designed for optimized fuel consumption and reduced environmental impact, aligning with global efforts to decarbonize the shipping sector. Furthermore, the continuous integration of digital technologies, such as remote monitoring and predictive maintenance, enhances operational efficiency and minimizes downtime, bolstering the overall appeal of autonomous shipping solutions. Regional growth will vary, with North America and Asia-Pacific expected to dominate the market due to robust technological infrastructure, significant investments in R&D, and a large number of key players in these regions. The commercial application segment holds a considerable market share, largely driven by the burgeoning e-commerce industry and the need for efficient global logistics. The ongoing evolution of autonomous ship technology and the gradual relaxation of regulatory frameworks will collectively contribute to sustained market growth in the coming years.
Autonomous Ships Market Company Market Share
Autonomous Ships Market: A Comprehensive Market Report (2019-2033)
This comprehensive report provides a detailed analysis of the Autonomous Ships Market, encompassing market dynamics, growth trends, regional dominance, product landscape, key players, and future outlook. The report covers the parent market of Maritime Transportation and the child market of Autonomous Vessel Technologies, providing a granular view of this rapidly evolving sector. The study period spans 2019-2033, with 2025 as the base and estimated year. The market size is projected in Million USD.
Autonomous Ships Market Dynamics & Structure
The autonomous ships market is characterized by a moderately concentrated landscape with key players such as ABB Ltd, DNV AS, Wärtsilä Corporation, and Kongsberg Gruppen ASA holding significant market share. Technological innovation, particularly in AI, sensor technology, and communication systems, is a primary growth driver. However, stringent regulatory frameworks and safety concerns pose significant barriers to widespread adoption. The market witnesses considerable M&A activity, with larger players acquiring smaller technology firms to bolster their capabilities. Substitute technologies, such as remotely operated vessels, currently coexist but are expected to converge with fully autonomous solutions over time. End-user demographics include commercial shipping companies, military organizations, and potentially offshore industries.
- Market Concentration: Moderately concentrated, with top 5 players holding approximately xx% market share in 2025.
- Technological Innovation: Rapid advancements in AI, sensor technology, and communication networks are key drivers.
- Regulatory Framework: Stringent safety regulations and evolving international standards influence market growth.
- Competitive Substitutes: Remotely operated vessels currently compete but will likely integrate with autonomous technologies.
- M&A Activity: Significant M&A activity observed, with xx deals recorded between 2019 and 2024. This is expected to increase to xx deals during the forecast period.
- End-User Demographics: Commercial shipping (xx%), Military (xx%), and other industries (xx%) represent the primary end-user segments.
Autonomous Ships Market Growth Trends & Insights
The autonomous ships market is experiencing robust and accelerating growth, propelled by the maritime sector's increasing demand for enhanced operational efficiency, unparalleled safety standards, and significant reductions in operational expenditures. The market size, estimated at [Insert Value] Million USD in 2025, is projected to expand to [Insert Value] Million USD by 2033, demonstrating a compelling Compound Annual Growth Rate (CAGR) of [Insert Percentage]% during the forecast period. Adoption rates are steadily climbing, with the commercial shipping segment emerging as a primary catalyst. While regulatory approvals and the complete maturation of certain technologies continue to present hurdles, ongoing technological breakthroughs, including the seamless integration of 5G communication networks and sophisticated Artificial Intelligence (AI) algorithms, are poised to dramatically accelerate market expansion. Furthermore, evolving consumer attitudes and a growing acceptance of autonomous technologies across various sectors are contributing to this upward trajectory. Pioneering companies are strategically adopting a phased approach, initially focusing on partially autonomous systems to gain valuable operational experience and mitigate early-stage risks before transitioning towards fully autonomous solutions.
Dominant Regions, Countries, or Segments in Autonomous Ships Market
The Asia-Pacific region is anticipated to lead the autonomous ships market, a position strengthened by substantial investments in cutting-edge port infrastructure and the concentrated presence of global shipbuilding and shipping industry leaders. Within this dynamic region, nations such as China, Japan, and South Korea are expected to exhibit particularly significant growth trajectories. Currently, the segment focusing on partially autonomous systems commands the leading market share, estimated at approximately [Insert Percentage]% in 2025. This is followed by remotely controlled ships (estimated at [Insert Percentage]%) and fully autonomous ships (estimated at [Insert Percentage]%). The commercial application segment holds the largest portion of the market share, accounting for [Insert Percentage]%. However, the military segment is projected to witness substantial and rapid growth, driven by an increasing imperative for advanced unmanned naval operations and enhanced defense capabilities.
- Key Drivers: Substantial investments in modern port infrastructure, a formidable base of shipbuilding and shipping enterprises, and proactive government support for technological advancements are critical drivers fueling the growth within the Asia-Pacific region.
- Dominance Factors: The high concentration of major shipping conglomerates and shipbuilding facilities, coupled with progressive government policies that actively foster technological innovation and research, significantly contribute to the region's dominant market position.
- Growth Potential: The widespread adoption of autonomous navigation and operational systems is expected to accelerate across all market segments, promising substantial overall growth across the entire Asia-Pacific region.
Autonomous Ships Market Product Landscape
The autonomous ships market offers a diverse range of solutions, including partially autonomous systems focusing on automated navigation and collision avoidance, remotely controlled ships managed from shore-based control centers, and fully autonomous vessels capable of independent operation. Recent innovations focus on enhancing safety features, integrating advanced AI for decision-making, and optimizing operational efficiency through data analytics. Unique selling propositions include improved safety, reduced operational costs, and enhanced efficiency. Technological advancements such as AI-powered navigation, predictive maintenance, and remote monitoring systems are driving product innovation.
Key Drivers, Barriers & Challenges in Autonomous Ships Market
Key Drivers:
- An escalating demand for demonstrably enhanced maritime safety and a significant reduction in human-related errors.
- A growing imperative for optimizing operational efficiencies and achieving substantial cost reductions in maritime logistics.
- Continuous and rapid technological advancements in critical areas such as Artificial Intelligence (AI), sophisticated sensor technologies, and robust communication systems.
- Proactive government support, including favorable policies and financial incentives, designed to encourage the widespread adoption of autonomous technologies within the maritime industry.
Challenges & Restraints:
- The presence of complex and stringent regulatory frameworks, coupled with rigorous safety certification processes that can slow down deployment.
- Pervasive concerns surrounding cybersecurity threats and the safeguarding of sensitive data privacy.
- The significant upfront capital investment required for the procurement and integration of advanced autonomous systems.
- Potential societal impacts, including concerns about job displacement within the traditional maritime workforce.
- Vulnerability to supply chain disruptions, which could lead to delays in the development and deployment of essential technological components and systems.
Emerging Opportunities in Autonomous Ships Market
Emerging opportunities include the expansion into new market segments such as offshore wind energy support, underwater exploration, and cargo transport in remote or hazardous environments. Innovative applications include integrated autonomous systems across different vessel types, as well as the development of advanced data analytics tools to improve operational efficiency. Evolving consumer preferences for increased safety and sustainability further drive opportunities for environmentally friendly autonomous ships.
Growth Accelerators in the Autonomous Ships Market Industry
Long-term growth will be accelerated by technological breakthroughs, including improved AI algorithms and sensor technologies, which will increase autonomy levels and enhance safety. Strategic partnerships between technology providers, shipping companies, and regulatory bodies will streamline the adoption process. Expansion into new markets, such as offshore energy and scientific research, will further drive market growth.
Key Players Shaping the Autonomous Ships Market Market
- ABB Ltd
- DNV AS
- Wärtsilä Corporation
- Nippon Yusen Kabushiki Kaisha (NYK Line)
- Fugr
- Kongsberg Gruppen ASA
- MITSUI E&S Co Ltd
- Vigor Industrial LLC
- Rolls-Royce plc
- Praxis Automation Technology B V
- Hanwha Corporation
- HD Hyundai Heavy Industries Co Ltd
Notable Milestones in Autonomous Ships Market Sector
- August 2022: Avikus, a subsidiary of HD Hyundai Heavy Industries, secured a significant order for its innovative HiNAS 2.0 autonomous navigation solution, destined for deployment on 23 vessels operated by SK Shipping and Sinokor Merchant Marine. This marked a substantial commercial endorsement of their technology.
- February 2023: Austal USA successfully delivered an autonomous-capable EPF 13 ship to the United States Navy. This vessel is equipped with advanced features including automated maintenance, comprehensive health monitoring systems, and enhanced mission readiness capabilities, signaling a key step in military applications.
In-Depth Autonomous Ships Market Market Outlook
The future trajectory of the autonomous ships market is exceptionally promising, characterized by substantial growth potential fueled by relentless technological innovation, a surging global demand for more efficient and secure maritime transportation, and the expansion of autonomous systems into novel and diverse applications. Strategic alliances and robust collaborations between leading technology providers, influential shipping companies, and key regulatory bodies will be paramount in accelerating market growth and effectively addressing and overcoming existing operational and regulatory challenges. The market is definitively poised for a period of significant expansion, with a pronounced emphasis on optimizing operational performance, bolstering safety protocols through advanced autonomy levels, and leveraging enhanced data analytics capabilities for smarter decision-making.
Autonomous Ships Market Segmentation
-
1. Type
- 1.1. Partially Autonomous
- 1.2. Remotely Controlled Ship
- 1.3. Fully Autonomous
-
2. Application
- 2.1. Commercial
- 2.2. Military
Autonomous Ships Market Segmentation By Geography
-
1. North America
- 1.1. United States
- 1.2. Canada
-
2. Europe
- 2.1. United Kingdom
- 2.2. Germany
- 2.3. France
- 2.4. Italy
- 2.5. Russia
- 2.6. Rest of Europe
-
3. Asia Pacific
- 3.1. China
- 3.2. India
- 3.3. Japan
- 3.4. South Korea
- 3.5. Australia
- 3.6. Rest of Asia Pacific
-
4. Latin America
- 4.1. Brazil
- 4.2. Rest of Latin America
-
5. Middle East and Africa
- 5.1. Saudi Arabia
- 5.2. United Arab Emirates
- 5.3. Qatar
- 5.4. Egypt
- 5.5. South Africa
- 5.6. Rest of Middle East and Africa
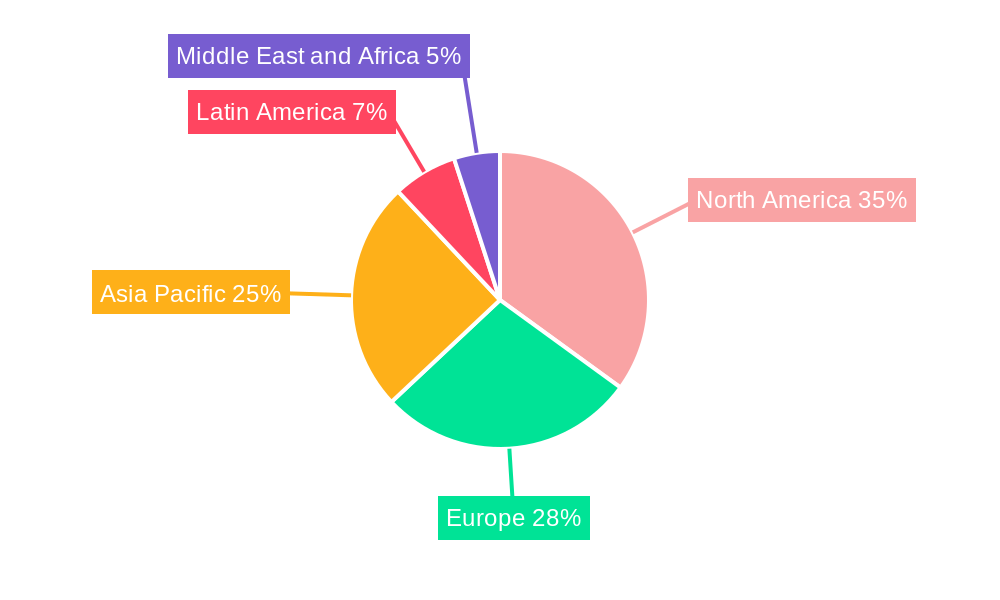
Autonomous Ships Market Regional Market Share
Geographic Coverage of Autonomous Ships Market
Autonomous Ships Market REPORT HIGHLIGHTS
| Aspects | Details |
|---|---|
| Study Period | 2020-2034 |
| Base Year | 2025 |
| Estimated Year | 2026 |
| Forecast Period | 2026-2034 |
| Historical Period | 2020-2025 |
| Growth Rate | CAGR of 7.30% from 2020-2034 |
| Segmentation |
|
Table of Contents
- 1. Introduction
- 1.1. Research Scope
- 1.2. Market Segmentation
- 1.3. Research Objective
- 1.4. Definitions and Assumptions
- 2. Executive Summary
- 2.1. Market Snapshot
- 3. Market Dynamics
- 3.1. Market Drivers
- 3.2. Market Restrains
- 3.3. Market Trends
- 3.4. Market Opportunities
- 4. Market Factor Analysis
- 4.1. Porters Five Forces
- 4.1.1. Bargaining Power of Suppliers
- 4.1.2. Bargaining Power of Buyers
- 4.1.3. Threat of New Entrants
- 4.1.4. Threat of Substitutes
- 4.1.5. Competitive Rivalry
- 4.2. PESTEL analysis
- 4.3. BCG Analysis
- 4.3.1. Stars (High Growth, High Market Share)
- 4.3.2. Cash Cows (Low Growth, High Market Share)
- 4.3.3. Question Mark (High Growth, Low Market Share)
- 4.3.4. Dogs (Low Growth, Low Market Share)
- 4.4. Ansoff Matrix Analysis
- 4.5. Supply Chain Analysis
- 4.6. Regulatory Landscape
- 4.7. Current Market Potential and Opportunity Assessment (TAM–SAM–SOM Framework)
- 4.8. IMR Analyst Note
- 4.1. Porters Five Forces
- 5. Market Analysis, Insights and Forecast 2021-2033
- 5.1. Market Analysis, Insights and Forecast - by Type
- 5.1.1. Partially Autonomous
- 5.1.2. Remotely Controlled Ship
- 5.1.3. Fully Autonomous
- 5.2. Market Analysis, Insights and Forecast - by Application
- 5.2.1. Commercial
- 5.2.2. Military
- 5.3. Market Analysis, Insights and Forecast - by Region
- 5.3.1. North America
- 5.3.2. Europe
- 5.3.3. Asia Pacific
- 5.3.4. Latin America
- 5.3.5. Middle East and Africa
- 5.1. Market Analysis, Insights and Forecast - by Type
- 6. Global Autonomous Ships Market Analysis, Insights and Forecast, 2021-2033
- 6.1. Market Analysis, Insights and Forecast - by Type
- 6.1.1. Partially Autonomous
- 6.1.2. Remotely Controlled Ship
- 6.1.3. Fully Autonomous
- 6.2. Market Analysis, Insights and Forecast - by Application
- 6.2.1. Commercial
- 6.2.2. Military
- 6.1. Market Analysis, Insights and Forecast - by Type
- 7. North America Autonomous Ships Market Analysis, Insights and Forecast, 2020-2032
- 7.1. Market Analysis, Insights and Forecast - by Type
- 7.1.1. Partially Autonomous
- 7.1.2. Remotely Controlled Ship
- 7.1.3. Fully Autonomous
- 7.2. Market Analysis, Insights and Forecast - by Application
- 7.2.1. Commercial
- 7.2.2. Military
- 7.1. Market Analysis, Insights and Forecast - by Type
- 8. Europe Autonomous Ships Market Analysis, Insights and Forecast, 2020-2032
- 8.1. Market Analysis, Insights and Forecast - by Type
- 8.1.1. Partially Autonomous
- 8.1.2. Remotely Controlled Ship
- 8.1.3. Fully Autonomous
- 8.2. Market Analysis, Insights and Forecast - by Application
- 8.2.1. Commercial
- 8.2.2. Military
- 8.1. Market Analysis, Insights and Forecast - by Type
- 9. Asia Pacific Autonomous Ships Market Analysis, Insights and Forecast, 2020-2032
- 9.1. Market Analysis, Insights and Forecast - by Type
- 9.1.1. Partially Autonomous
- 9.1.2. Remotely Controlled Ship
- 9.1.3. Fully Autonomous
- 9.2. Market Analysis, Insights and Forecast - by Application
- 9.2.1. Commercial
- 9.2.2. Military
- 9.1. Market Analysis, Insights and Forecast - by Type
- 10. Latin America Autonomous Ships Market Analysis, Insights and Forecast, 2020-2032
- 10.1. Market Analysis, Insights and Forecast - by Type
- 10.1.1. Partially Autonomous
- 10.1.2. Remotely Controlled Ship
- 10.1.3. Fully Autonomous
- 10.2. Market Analysis, Insights and Forecast - by Application
- 10.2.1. Commercial
- 10.2.2. Military
- 10.1. Market Analysis, Insights and Forecast - by Type
- 11. Middle East and Africa Autonomous Ships Market Analysis, Insights and Forecast, 2020-2032
- 11.1. Market Analysis, Insights and Forecast - by Type
- 11.1.1. Partially Autonomous
- 11.1.2. Remotely Controlled Ship
- 11.1.3. Fully Autonomous
- 11.2. Market Analysis, Insights and Forecast - by Application
- 11.2.1. Commercial
- 11.2.2. Military
- 11.1. Market Analysis, Insights and Forecast - by Type
- 12. Competitive Analysis
- 12.1. Company Profiles
- 12.1.1 ABB Ltd
- 12.1.1.1. Company Overview
- 12.1.1.2. Products
- 12.1.1.3. Company Financials
- 12.1.1.4. SWOT Analysis
- 12.1.2 DNV AS
- 12.1.2.1. Company Overview
- 12.1.2.2. Products
- 12.1.2.3. Company Financials
- 12.1.2.4. SWOT Analysis
- 12.1.3 Wärtsilä Corporation
- 12.1.3.1. Company Overview
- 12.1.3.2. Products
- 12.1.3.3. Company Financials
- 12.1.3.4. SWOT Analysis
- 12.1.4 Nippon Yusen Kabushiki Kaisha (NYK Line)
- 12.1.4.1. Company Overview
- 12.1.4.2. Products
- 12.1.4.3. Company Financials
- 12.1.4.4. SWOT Analysis
- 12.1.5 Fugr
- 12.1.5.1. Company Overview
- 12.1.5.2. Products
- 12.1.5.3. Company Financials
- 12.1.5.4. SWOT Analysis
- 12.1.6 Kongsberg Gruppen ASA
- 12.1.6.1. Company Overview
- 12.1.6.2. Products
- 12.1.6.3. Company Financials
- 12.1.6.4. SWOT Analysis
- 12.1.7 MITSUI E&S Co Ltd
- 12.1.7.1. Company Overview
- 12.1.7.2. Products
- 12.1.7.3. Company Financials
- 12.1.7.4. SWOT Analysis
- 12.1.8 Vigor Industrial LLC
- 12.1.8.1. Company Overview
- 12.1.8.2. Products
- 12.1.8.3. Company Financials
- 12.1.8.4. SWOT Analysis
- 12.1.9 Rolls-Royce plc
- 12.1.9.1. Company Overview
- 12.1.9.2. Products
- 12.1.9.3. Company Financials
- 12.1.9.4. SWOT Analysis
- 12.1.10 Praxis Automation Technology B V
- 12.1.10.1. Company Overview
- 12.1.10.2. Products
- 12.1.10.3. Company Financials
- 12.1.10.4. SWOT Analysis
- 12.1.11 Hanwha Corporation
- 12.1.11.1. Company Overview
- 12.1.11.2. Products
- 12.1.11.3. Company Financials
- 12.1.11.4. SWOT Analysis
- 12.1.12 HD Hyundai Heavy Industries Co Ltd
- 12.1.12.1. Company Overview
- 12.1.12.2. Products
- 12.1.12.3. Company Financials
- 12.1.12.4. SWOT Analysis
- 12.1.1 ABB Ltd
- 12.2. Market Entropy
- 12.2.1 Company's Key Areas Served
- 12.2.2 Recent Developments
- 12.3. Company Market Share Analysis 2025
- 12.3.1 Top 5 Companies Market Share Analysis
- 12.3.2 Top 3 Companies Market Share Analysis
- 12.4. List of Potential Customers
- 13. Research Methodology
List of Figures
- Figure 1: Global Autonomous Ships Market Revenue Breakdown (Million, %) by Region 2025 & 2033
- Figure 2: North America Autonomous Ships Market Revenue (Million), by Type 2025 & 2033
- Figure 3: North America Autonomous Ships Market Revenue Share (%), by Type 2025 & 2033
- Figure 4: North America Autonomous Ships Market Revenue (Million), by Application 2025 & 2033
- Figure 5: North America Autonomous Ships Market Revenue Share (%), by Application 2025 & 2033
- Figure 6: North America Autonomous Ships Market Revenue (Million), by Country 2025 & 2033
- Figure 7: North America Autonomous Ships Market Revenue Share (%), by Country 2025 & 2033
- Figure 8: Europe Autonomous Ships Market Revenue (Million), by Type 2025 & 2033
- Figure 9: Europe Autonomous Ships Market Revenue Share (%), by Type 2025 & 2033
- Figure 10: Europe Autonomous Ships Market Revenue (Million), by Application 2025 & 2033
- Figure 11: Europe Autonomous Ships Market Revenue Share (%), by Application 2025 & 2033
- Figure 12: Europe Autonomous Ships Market Revenue (Million), by Country 2025 & 2033
- Figure 13: Europe Autonomous Ships Market Revenue Share (%), by Country 2025 & 2033
- Figure 14: Asia Pacific Autonomous Ships Market Revenue (Million), by Type 2025 & 2033
- Figure 15: Asia Pacific Autonomous Ships Market Revenue Share (%), by Type 2025 & 2033
- Figure 16: Asia Pacific Autonomous Ships Market Revenue (Million), by Application 2025 & 2033
- Figure 17: Asia Pacific Autonomous Ships Market Revenue Share (%), by Application 2025 & 2033
- Figure 18: Asia Pacific Autonomous Ships Market Revenue (Million), by Country 2025 & 2033
- Figure 19: Asia Pacific Autonomous Ships Market Revenue Share (%), by Country 2025 & 2033
- Figure 20: Latin America Autonomous Ships Market Revenue (Million), by Type 2025 & 2033
- Figure 21: Latin America Autonomous Ships Market Revenue Share (%), by Type 2025 & 2033
- Figure 22: Latin America Autonomous Ships Market Revenue (Million), by Application 2025 & 2033
- Figure 23: Latin America Autonomous Ships Market Revenue Share (%), by Application 2025 & 2033
- Figure 24: Latin America Autonomous Ships Market Revenue (Million), by Country 2025 & 2033
- Figure 25: Latin America Autonomous Ships Market Revenue Share (%), by Country 2025 & 2033
- Figure 26: Middle East and Africa Autonomous Ships Market Revenue (Million), by Type 2025 & 2033
- Figure 27: Middle East and Africa Autonomous Ships Market Revenue Share (%), by Type 2025 & 2033
- Figure 28: Middle East and Africa Autonomous Ships Market Revenue (Million), by Application 2025 & 2033
- Figure 29: Middle East and Africa Autonomous Ships Market Revenue Share (%), by Application 2025 & 2033
- Figure 30: Middle East and Africa Autonomous Ships Market Revenue (Million), by Country 2025 & 2033
- Figure 31: Middle East and Africa Autonomous Ships Market Revenue Share (%), by Country 2025 & 2033
List of Tables
- Table 1: Global Autonomous Ships Market Revenue Million Forecast, by Type 2020 & 2033
- Table 2: Global Autonomous Ships Market Revenue Million Forecast, by Application 2020 & 2033
- Table 3: Global Autonomous Ships Market Revenue Million Forecast, by Region 2020 & 2033
- Table 4: Global Autonomous Ships Market Revenue Million Forecast, by Type 2020 & 2033
- Table 5: Global Autonomous Ships Market Revenue Million Forecast, by Application 2020 & 2033
- Table 6: Global Autonomous Ships Market Revenue Million Forecast, by Country 2020 & 2033
- Table 7: United States Autonomous Ships Market Revenue (Million) Forecast, by Application 2020 & 2033
- Table 8: Canada Autonomous Ships Market Revenue (Million) Forecast, by Application 2020 & 2033
- Table 9: Global Autonomous Ships Market Revenue Million Forecast, by Type 2020 & 2033
- Table 10: Global Autonomous Ships Market Revenue Million Forecast, by Application 2020 & 2033
- Table 11: Global Autonomous Ships Market Revenue Million Forecast, by Country 2020 & 2033
- Table 12: United Kingdom Autonomous Ships Market Revenue (Million) Forecast, by Application 2020 & 2033
- Table 13: Germany Autonomous Ships Market Revenue (Million) Forecast, by Application 2020 & 2033
- Table 14: France Autonomous Ships Market Revenue (Million) Forecast, by Application 2020 & 2033
- Table 15: Italy Autonomous Ships Market Revenue (Million) Forecast, by Application 2020 & 2033
- Table 16: Russia Autonomous Ships Market Revenue (Million) Forecast, by Application 2020 & 2033
- Table 17: Rest of Europe Autonomous Ships Market Revenue (Million) Forecast, by Application 2020 & 2033
- Table 18: Global Autonomous Ships Market Revenue Million Forecast, by Type 2020 & 2033
- Table 19: Global Autonomous Ships Market Revenue Million Forecast, by Application 2020 & 2033
- Table 20: Global Autonomous Ships Market Revenue Million Forecast, by Country 2020 & 2033
- Table 21: China Autonomous Ships Market Revenue (Million) Forecast, by Application 2020 & 2033
- Table 22: India Autonomous Ships Market Revenue (Million) Forecast, by Application 2020 & 2033
- Table 23: Japan Autonomous Ships Market Revenue (Million) Forecast, by Application 2020 & 2033
- Table 24: South Korea Autonomous Ships Market Revenue (Million) Forecast, by Application 2020 & 2033
- Table 25: Australia Autonomous Ships Market Revenue (Million) Forecast, by Application 2020 & 2033
- Table 26: Rest of Asia Pacific Autonomous Ships Market Revenue (Million) Forecast, by Application 2020 & 2033
- Table 27: Global Autonomous Ships Market Revenue Million Forecast, by Type 2020 & 2033
- Table 28: Global Autonomous Ships Market Revenue Million Forecast, by Application 2020 & 2033
- Table 29: Global Autonomous Ships Market Revenue Million Forecast, by Country 2020 & 2033
- Table 30: Brazil Autonomous Ships Market Revenue (Million) Forecast, by Application 2020 & 2033
- Table 31: Rest of Latin America Autonomous Ships Market Revenue (Million) Forecast, by Application 2020 & 2033
- Table 32: Global Autonomous Ships Market Revenue Million Forecast, by Type 2020 & 2033
- Table 33: Global Autonomous Ships Market Revenue Million Forecast, by Application 2020 & 2033
- Table 34: Global Autonomous Ships Market Revenue Million Forecast, by Country 2020 & 2033
- Table 35: Saudi Arabia Autonomous Ships Market Revenue (Million) Forecast, by Application 2020 & 2033
- Table 36: United Arab Emirates Autonomous Ships Market Revenue (Million) Forecast, by Application 2020 & 2033
- Table 37: Qatar Autonomous Ships Market Revenue (Million) Forecast, by Application 2020 & 2033
- Table 38: Egypt Autonomous Ships Market Revenue (Million) Forecast, by Application 2020 & 2033
- Table 39: South Africa Autonomous Ships Market Revenue (Million) Forecast, by Application 2020 & 2033
- Table 40: Rest of Middle East and Africa Autonomous Ships Market Revenue (Million) Forecast, by Application 2020 & 2033
Frequently Asked Questions
1. What is the projected Compound Annual Growth Rate (CAGR) of the Autonomous Ships Market?
The projected CAGR is approximately 7.30%.
2. Which companies are prominent players in the Autonomous Ships Market?
Key companies in the market include ABB Ltd, DNV AS, Wärtsilä Corporation, Nippon Yusen Kabushiki Kaisha (NYK Line), Fugr, Kongsberg Gruppen ASA, MITSUI E&S Co Ltd, Vigor Industrial LLC, Rolls-Royce plc, Praxis Automation Technology B V, Hanwha Corporation, HD Hyundai Heavy Industries Co Ltd.
3. What are the main segments of the Autonomous Ships Market?
The market segments include Type, Application.
4. Can you provide details about the market size?
The market size is estimated to be USD 8.38 Million as of 2022.
5. What are some drivers contributing to market growth?
N/A
6. What are the notable trends driving market growth?
The Commercial Segment of the Market is Anticipated to Register the Highest Growth During the Forecast Period.
7. Are there any restraints impacting market growth?
N/A
8. Can you provide examples of recent developments in the market?
February 2023: Austal USA delivered the US Navy its autonomous capable EPF 13 ship. Austal integrated an automated maintenance, health monitoring, and mission readiness capability into EPF 13. It will enable the vessel to operate for up to 30 days without human intervention in combination with existing highly automated hull, mechanical & electrical systems installed on EPF class vessels.
9. What pricing options are available for accessing the report?
Pricing options include single-user, multi-user, and enterprise licenses priced at USD 4750, USD 5250, and USD 8750 respectively.
10. Is the market size provided in terms of value or volume?
The market size is provided in terms of value, measured in Million.
11. Are there any specific market keywords associated with the report?
Yes, the market keyword associated with the report is "Autonomous Ships Market," which aids in identifying and referencing the specific market segment covered.
12. How do I determine which pricing option suits my needs best?
The pricing options vary based on user requirements and access needs. Individual users may opt for single-user licenses, while businesses requiring broader access may choose multi-user or enterprise licenses for cost-effective access to the report.
13. Are there any additional resources or data provided in the Autonomous Ships Market report?
While the report offers comprehensive insights, it's advisable to review the specific contents or supplementary materials provided to ascertain if additional resources or data are available.
14. How can I stay updated on further developments or reports in the Autonomous Ships Market?
To stay informed about further developments, trends, and reports in the Autonomous Ships Market, consider subscribing to industry newsletters, following relevant companies and organizations, or regularly checking reputable industry news sources and publications.
Methodology
Step 1 - Identification of Relevant Samples Size from Population Database


Step 2 - Approaches for Defining Global Market Size (Value, Volume* & Price*)

Note*: In applicable scenarios
Step 3 - Data Sources
Primary Research
- Web Analytics
- Survey Reports
- Research Institute
- Latest Research Reports
- Opinion Leaders
Secondary Research
- Annual Reports
- White Paper
- Latest Press Release
- Industry Association
- Paid Database
- Investor Presentations

Step 4 - Data Triangulation
Involves using different sources of information in order to increase the validity of a study
These sources are likely to be stakeholders in a program - participants, other researchers, program staff, other community members, and so on.
Then we put all data in single framework & apply various statistical tools to find out the dynamic on the market.
During the analysis stage, feedback from the stakeholder groups would be compared to determine areas of agreement as well as areas of divergence