

Key Insights
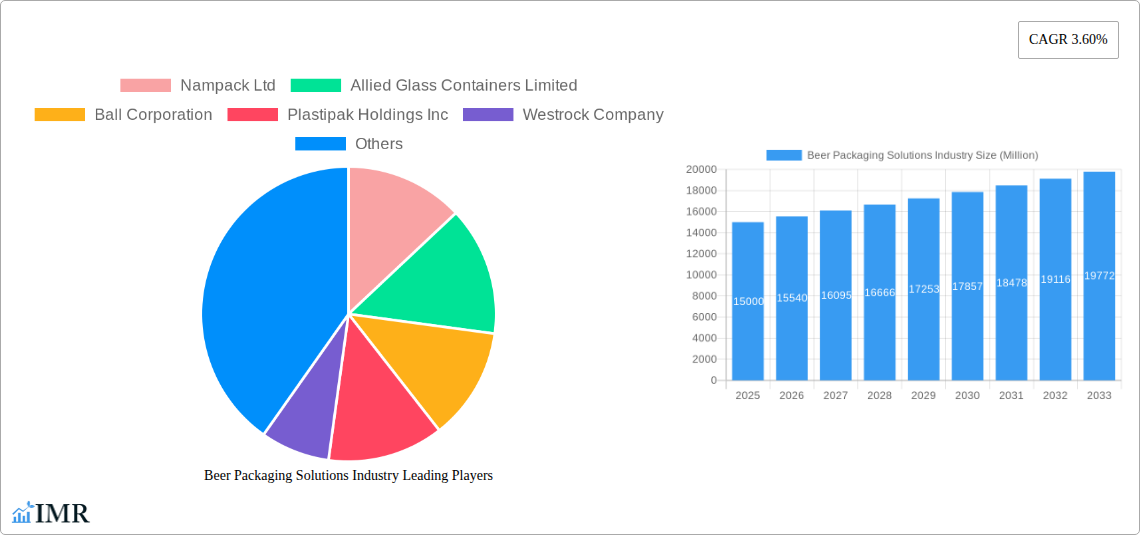
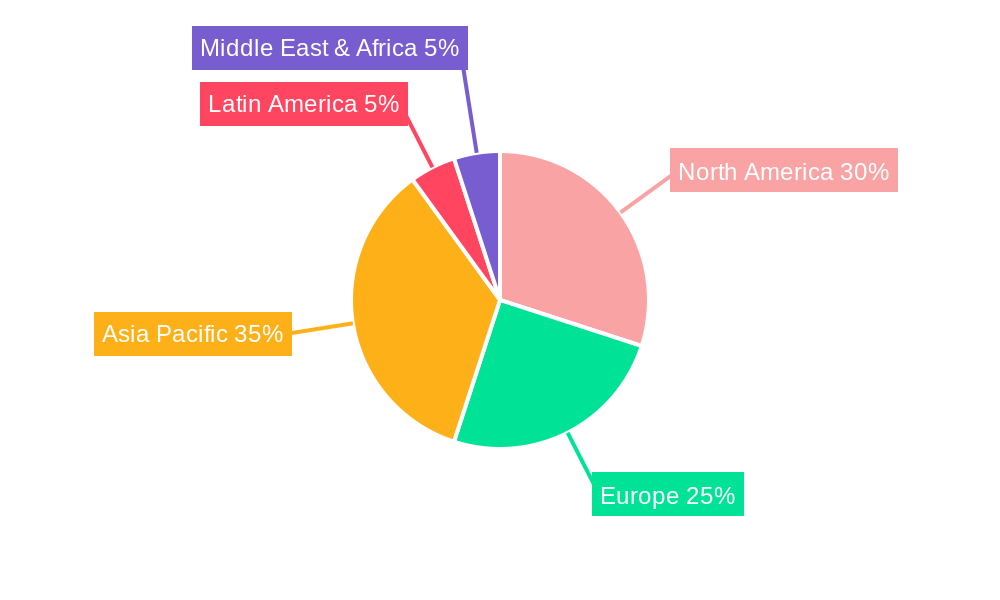
The global beer packaging solutions market, valued at approximately $XX million in 2025, is projected to experience steady growth, driven by increasing beer consumption, particularly in developing economies. A Compound Annual Growth Rate (CAGR) of 3.60% from 2025 to 2033 indicates a substantial market expansion. Key drivers include the rising preference for convenient and sustainable packaging options, a growing demand for premium and craft beers often packaged in specialized containers (e.g., unique bottle designs), and evolving consumer preferences influencing packaging choices. Trends like lightweighting for improved logistics and reduced environmental impact, the adoption of innovative materials like recyclable PET and sustainable aluminum, and the increasing use of smart packaging (incorporating features like tamper evidence and traceability) are significantly shaping the market landscape. However, fluctuating raw material prices, stringent environmental regulations, and intense competition among established players and new entrants represent significant restraints. Market segmentation reveals strong demand across various packaging materials – glass, metal (aluminum cans and steel kegs), and PET bottles – each catering to distinct consumer segments and beer styles. The geographical distribution of market share shows robust growth in Asia-Pacific, fueled by rising disposable incomes and a burgeoning middle class, while North America and Europe maintain significant market shares due to established beer consumption patterns.
The competitive landscape is characterized by both large multinational corporations and specialized regional players. Companies like Ball Corporation, Amcor, and Crown Holdings, renowned for their advanced manufacturing capabilities and global reach, dominate significant segments. However, smaller, nimble players are gaining traction by focusing on niche markets, offering innovative solutions, or specializing in sustainable packaging materials. The forecast period (2025-2033) promises further expansion, particularly driven by the continued global rise in beer consumption and the ongoing innovation within sustainable packaging technologies. Strategic partnerships, mergers and acquisitions, and a focus on sustainable manufacturing practices will be critical for companies seeking market leadership in the coming years. The market's future is bright, predicated on the enduring appeal of beer and a continuous evolution of packaging innovations meeting both consumer needs and environmental responsibilities.
Beer Packaging Solutions Industry: A Comprehensive Market Report (2019-2033)
This comprehensive report provides a detailed analysis of the Beer Packaging Solutions industry, encompassing market dynamics, growth trends, regional insights, competitive landscape, and future outlook. The study period covers 2019-2033, with 2025 as the base and estimated year, and a forecast period of 2025-2033. The report utilizes data from the historical period (2019-2024) and leverages proprietary data and analytical models (XXX) to deliver actionable insights for industry professionals. The total market size is predicted to reach xx Million units by 2033. This report delves into the parent market of Packaging and the child market of Beer Packaging, offering a granular view of market segmentation and key players.
Beer Packaging Solutions Industry Market Dynamics & Structure
The beer packaging solutions market is characterized by moderate concentration, with several large multinational players holding significant market share. Technological innovation, driven by sustainability concerns and consumer preferences, is a key driver. Stringent regulatory frameworks concerning materials and recyclability influence packaging choices, while competitive pressures from substitute materials like biodegradable plastics and alternative packaging methods exist. The end-user demographic trends towards premiumization and craft beers influence packaging choices. M&A activity has been relatively robust in recent years, with consolidation among packaging manufacturers.
- Market Concentration: The top 5 players hold approximately xx% market share (2024).
- Technological Innovation: Focus on lightweighting, sustainable materials (e.g., recycled content), and improved barrier properties.
- Regulatory Landscape: Growing emphasis on recyclability and reduction of plastic waste.
- Competitive Substitutes: Biodegradable plastics, alternative packaging formats (e.g., pouches).
- End-User Demographics: Shift towards premium and craft beers drives demand for high-quality packaging.
- M&A Activity: xx major M&A deals recorded between 2019 and 2024, with an estimated value of xx Million USD.
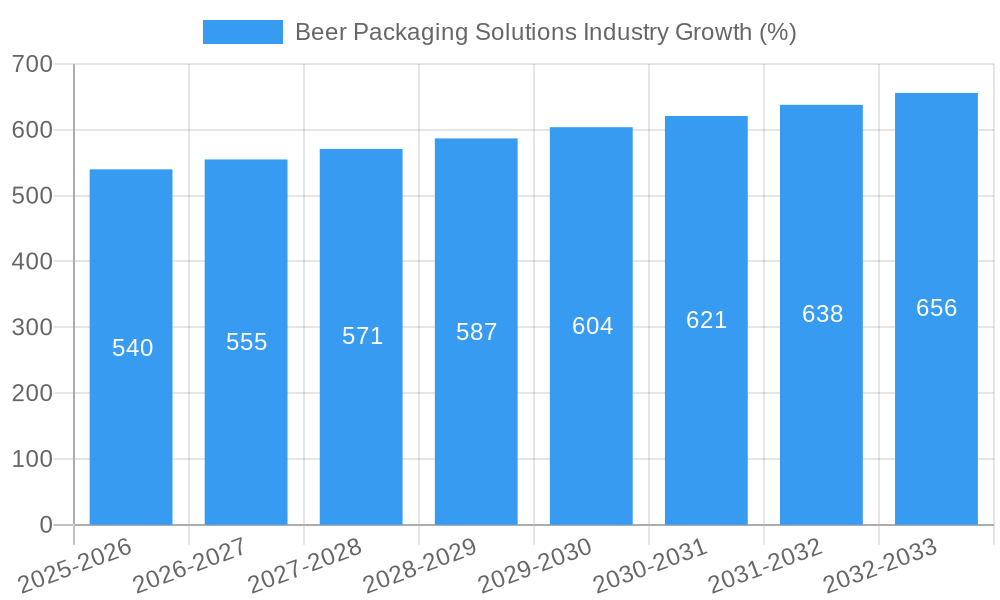
Beer Packaging Solutions Industry Growth Trends & Insights
The beer packaging solutions market has experienced consistent growth throughout the historical period (2019-2024), driven by increasing beer consumption globally and evolving consumer preferences. Technological advancements, such as the adoption of lightweighting technologies and improved printing techniques, have further fueled market growth. Consumer behavior shifts towards sustainability and convenience have influenced the demand for eco-friendly packaging solutions. The market is expected to continue growing at a CAGR of xx% during the forecast period (2025-2033), reaching xx Million units by 2033. The increased adoption of cans and PET bottles is a significant contributor to this growth. Market penetration of sustainable packaging solutions is expected to increase from xx% in 2024 to xx% by 2033.
Dominant Regions, Countries, or Segments in Beer Packaging Solutions Industry
North America and Europe currently dominate the beer packaging solutions market, driven by high beer consumption and established packaging infrastructure. Within these regions, the US and Germany are key markets. The cans segment dominates by packaging type, accounting for approximately xx% of the market in 2024 due to cost-effectiveness and recyclability. In terms of packaging materials, metal (primarily aluminum cans) and glass hold the largest shares.
- Key Drivers (North America): High per capita beer consumption, robust distribution networks, and a mature market.
- Key Drivers (Europe): Strong craft beer sector, high consumer awareness of sustainability, and established recycling infrastructure.
- Segment Dominance (Cans): Cost-effectiveness, lightweighting, recyclability, and suitability for various beer styles.
- Segment Dominance (Metal): Durability, barrier properties, and established manufacturing processes.
- Segment Dominance (Glass): Premium image, recyclability, and perceived quality.
Beer Packaging Solutions Industry Product Landscape
The beer packaging solutions market offers a wide range of products, including cans, bottles (glass and PET), kegs, and other innovative formats. Technological advancements focus on enhancing barrier properties, improving shelf life, reducing weight, and increasing recyclability. Unique selling propositions include lightweighting for reduced transportation costs, sustainable materials for eco-consciousness, and advanced printing technologies for enhanced branding. Recent innovations include cans with integrated sensors for freshness monitoring and PET bottles with improved oxygen barrier properties.
Key Drivers, Barriers & Challenges in Beer Packaging Solutions Industry
Key Drivers:
- Growing demand for beer globally.
- Increasing consumer preference for convenient packaging.
- Advancements in packaging technologies.
- Rising adoption of sustainable packaging solutions.
Challenges & Restraints:
- Fluctuations in raw material prices.
- Stringent environmental regulations.
- Intense competition among packaging suppliers.
- Supply chain disruptions impacting material availability and transportation costs (estimated impact of xx% on overall production in 2024).
Emerging Opportunities in Beer Packaging Solutions Industry
- Growth in craft beer and premium beer segments drives demand for sophisticated packaging.
- Increasing consumer preference for sustainable and eco-friendly packaging solutions creates opportunities for biodegradable and recyclable materials.
- Expansion into emerging markets with growing beer consumption offers significant growth potential.
- Innovative packaging formats and designs enhance brand differentiation and shelf appeal.
Growth Accelerators in the Beer Packaging Solutions Industry Industry
Strategic partnerships between packaging manufacturers and breweries foster innovation and efficiency. Technological breakthroughs, such as lightweighting and improved barrier properties, drive cost optimization and enhanced product protection. The expansion into emerging markets with high growth potential ensures continued market expansion.
Key Players Shaping the Beer Packaging Solutions Industry Market
- Nampack Ltd
- Allied Glass Containers Limited
- Ball Corporation
- Plastipak Holdings Inc
- Westrock Company
- Ardagh Group SA
- Smurfit Kappa Group PLC
- Crown Holdings Incorporated
- Carlsberg Group
- Amcor Limited
- Tetra Laval International SA
Notable Milestones in Beer Packaging Solutions Industry Sector
- 2021 (Q3): Ball Corporation launches a new recyclable aluminum can with enhanced sustainability features.
- 2022 (Q1): Smurfit Kappa Group PLC invests in a new paperboard production facility to increase capacity.
- 2023 (Q2): Ardagh Group SA announces a strategic partnership with a major brewery to develop innovative packaging solutions.
- 2024 (Q4): Several mergers and acquisitions consolidate market players.
In-Depth Beer Packaging Solutions Industry Market Outlook
The beer packaging solutions market is poised for continued growth, driven by factors such as increased beer consumption, technological innovation, and the growing demand for sustainable packaging solutions. Strategic partnerships, expansion into emerging markets, and the development of innovative packaging formats will be crucial for market players to maintain a competitive edge. The future holds significant potential for companies that prioritize sustainability, innovation, and efficient supply chain management.
Beer Packaging Solutions Industry Segmentation
-
1. Packaging Material
- 1.1. Glass
- 1.2. Metal
- 1.3. PET
-
2. Packaging Type
- 2.1. Bottle
- 2.2. Keg
- 2.3. Can
Beer Packaging Solutions Industry Segmentation By Geography
-
1. North America
- 1.1. United States
- 1.2. Canada
-
2. Europe
- 2.1. United Kingdom
- 2.2. Germany
- 2.3. France
- 2.4. Rest of Europe
-
3. Asia Pacific
- 3.1. China
- 3.2. India
- 3.3. Japan
- 3.4. Rest of Asia Pacific
-
4. Latin America
- 4.1. Brazil
- 4.2. Mexico
- 4.3. Rest of Latin America
-
5. Middle East and Africa
- 5.1. Saudi Arabia
- 5.2. United Arab Emirates
- 5.3. South Africa
- 5.4. Rest of Middle East and Africa
Beer Packaging Solutions Industry REPORT HIGHLIGHTS
| Aspects | Details |
|---|---|
| Study Period | 2019-2033 |
| Base Year | 2024 |
| Estimated Year | 2025 |
| Forecast Period | 2025-2033 |
| Historical Period | 2019-2024 |
| Growth Rate | CAGR of 3.60% from 2019-2033 |
| Segmentation |
|
Table of Contents
- 1. Introduction
- 1.1. Research Scope
- 1.2. Market Segmentation
- 1.3. Research Methodology
- 1.4. Definitions and Assumptions
- 2. Executive Summary
- 2.1. Introduction
- 3. Market Dynamics
- 3.1. Introduction
- 3.2. Market Drivers
- 3.2.1. ; Changing Consumer Preferences; Innovative Packaging and Attractive Marketing
- 3.3. Market Restrains
- 3.3.1. ; Consumer Preference of Wine and Liquor Over Beer in a Few Regions
- 3.4. Market Trends
- 3.4.1. Glass Packaging is Expected to Hold the Largest Market Share
- 4. Market Factor Analysis
- 4.1. Porters Five Forces
- 4.2. Supply/Value Chain
- 4.3. PESTEL analysis
- 4.4. Market Entropy
- 4.5. Patent/Trademark Analysis
- 5. Global Beer Packaging Solutions Industry Analysis, Insights and Forecast, 2019-2031
- 5.1. Market Analysis, Insights and Forecast - by Packaging Material
- 5.1.1. Glass
- 5.1.2. Metal
- 5.1.3. PET
- 5.2. Market Analysis, Insights and Forecast - by Packaging Type
- 5.2.1. Bottle
- 5.2.2. Keg
- 5.2.3. Can
- 5.3. Market Analysis, Insights and Forecast - by Region
- 5.3.1. North America
- 5.3.2. Europe
- 5.3.3. Asia Pacific
- 5.3.4. Latin America
- 5.3.5. Middle East and Africa
- 5.1. Market Analysis, Insights and Forecast - by Packaging Material
- 6. North America Beer Packaging Solutions Industry Analysis, Insights and Forecast, 2019-2031
- 6.1. Market Analysis, Insights and Forecast - by Packaging Material
- 6.1.1. Glass
- 6.1.2. Metal
- 6.1.3. PET
- 6.2. Market Analysis, Insights and Forecast - by Packaging Type
- 6.2.1. Bottle
- 6.2.2. Keg
- 6.2.3. Can
- 6.1. Market Analysis, Insights and Forecast - by Packaging Material
- 7. Europe Beer Packaging Solutions Industry Analysis, Insights and Forecast, 2019-2031
- 7.1. Market Analysis, Insights and Forecast - by Packaging Material
- 7.1.1. Glass
- 7.1.2. Metal
- 7.1.3. PET
- 7.2. Market Analysis, Insights and Forecast - by Packaging Type
- 7.2.1. Bottle
- 7.2.2. Keg
- 7.2.3. Can
- 7.1. Market Analysis, Insights and Forecast - by Packaging Material
- 8. Asia Pacific Beer Packaging Solutions Industry Analysis, Insights and Forecast, 2019-2031
- 8.1. Market Analysis, Insights and Forecast - by Packaging Material
- 8.1.1. Glass
- 8.1.2. Metal
- 8.1.3. PET
- 8.2. Market Analysis, Insights and Forecast - by Packaging Type
- 8.2.1. Bottle
- 8.2.2. Keg
- 8.2.3. Can
- 8.1. Market Analysis, Insights and Forecast - by Packaging Material
- 9. Latin America Beer Packaging Solutions Industry Analysis, Insights and Forecast, 2019-2031
- 9.1. Market Analysis, Insights and Forecast - by Packaging Material
- 9.1.1. Glass
- 9.1.2. Metal
- 9.1.3. PET
- 9.2. Market Analysis, Insights and Forecast - by Packaging Type
- 9.2.1. Bottle
- 9.2.2. Keg
- 9.2.3. Can
- 9.1. Market Analysis, Insights and Forecast - by Packaging Material
- 10. Middle East and Africa Beer Packaging Solutions Industry Analysis, Insights and Forecast, 2019-2031
- 10.1. Market Analysis, Insights and Forecast - by Packaging Material
- 10.1.1. Glass
- 10.1.2. Metal
- 10.1.3. PET
- 10.2. Market Analysis, Insights and Forecast - by Packaging Type
- 10.2.1. Bottle
- 10.2.2. Keg
- 10.2.3. Can
- 10.1. Market Analysis, Insights and Forecast - by Packaging Material
- 11. North America Beer Packaging Solutions Industry Analysis, Insights and Forecast, 2019-2031
- 11.1. Market Analysis, Insights and Forecast - By Country/Sub-region
- 11.1.1 United States
- 11.1.2 Canada
- 12. Europe Beer Packaging Solutions Industry Analysis, Insights and Forecast, 2019-2031
- 12.1. Market Analysis, Insights and Forecast - By Country/Sub-region
- 12.1.1 United Kingdom
- 12.1.2 Germany
- 12.1.3 France
- 12.1.4 Rest of Europe
- 13. Asia Pacific Beer Packaging Solutions Industry Analysis, Insights and Forecast, 2019-2031
- 13.1. Market Analysis, Insights and Forecast - By Country/Sub-region
- 13.1.1 China
- 13.1.2 India
- 13.1.3 Japan
- 13.1.4 Rest of Asia Pacific
- 14. Latin America Beer Packaging Solutions Industry Analysis, Insights and Forecast, 2019-2031
- 14.1. Market Analysis, Insights and Forecast - By Country/Sub-region
- 14.1.1 Brazil
- 14.1.2 Mexico
- 14.1.3 Rest of Latin America
- 15. Middle East Beer Packaging Solutions Industry Analysis, Insights and Forecast, 2019-2031
- 15.1. Market Analysis, Insights and Forecast - By Country/Sub-region
- 15.1.1.
- 16. Saudi Arabia Beer Packaging Solutions Industry Analysis, Insights and Forecast, 2019-2031
- 16.1. Market Analysis, Insights and Forecast - By Country/Sub-region
- 16.1.1 United Arab Emirates
- 16.1.2 South Africa
- 16.1.3 Rest of Middle East
- 17. Competitive Analysis
- 17.1. Global Market Share Analysis 2024
- 17.2. Company Profiles
- 17.2.1 Nampack Ltd
- 17.2.1.1. Overview
- 17.2.1.2. Products
- 17.2.1.3. SWOT Analysis
- 17.2.1.4. Recent Developments
- 17.2.1.5. Financials (Based on Availability)
- 17.2.2 Allied Glass Containers Limited
- 17.2.2.1. Overview
- 17.2.2.2. Products
- 17.2.2.3. SWOT Analysis
- 17.2.2.4. Recent Developments
- 17.2.2.5. Financials (Based on Availability)
- 17.2.3 Ball Corporation
- 17.2.3.1. Overview
- 17.2.3.2. Products
- 17.2.3.3. SWOT Analysis
- 17.2.3.4. Recent Developments
- 17.2.3.5. Financials (Based on Availability)
- 17.2.4 Plastipak Holdings Inc
- 17.2.4.1. Overview
- 17.2.4.2. Products
- 17.2.4.3. SWOT Analysis
- 17.2.4.4. Recent Developments
- 17.2.4.5. Financials (Based on Availability)
- 17.2.5 Westrock Company
- 17.2.5.1. Overview
- 17.2.5.2. Products
- 17.2.5.3. SWOT Analysis
- 17.2.5.4. Recent Developments
- 17.2.5.5. Financials (Based on Availability)
- 17.2.6 Ardagh Group SA
- 17.2.6.1. Overview
- 17.2.6.2. Products
- 17.2.6.3. SWOT Analysis
- 17.2.6.4. Recent Developments
- 17.2.6.5. Financials (Based on Availability)
- 17.2.7 Smurfit Kappa Group PLC*List Not Exhaustive
- 17.2.7.1. Overview
- 17.2.7.2. Products
- 17.2.7.3. SWOT Analysis
- 17.2.7.4. Recent Developments
- 17.2.7.5. Financials (Based on Availability)
- 17.2.8 Crown Holdings Incorporated
- 17.2.8.1. Overview
- 17.2.8.2. Products
- 17.2.8.3. SWOT Analysis
- 17.2.8.4. Recent Developments
- 17.2.8.5. Financials (Based on Availability)
- 17.2.9 Carlsberg Group
- 17.2.9.1. Overview
- 17.2.9.2. Products
- 17.2.9.3. SWOT Analysis
- 17.2.9.4. Recent Developments
- 17.2.9.5. Financials (Based on Availability)
- 17.2.10 Amcor Limited
- 17.2.10.1. Overview
- 17.2.10.2. Products
- 17.2.10.3. SWOT Analysis
- 17.2.10.4. Recent Developments
- 17.2.10.5. Financials (Based on Availability)
- 17.2.11 Tetra Laval International SA
- 17.2.11.1. Overview
- 17.2.11.2. Products
- 17.2.11.3. SWOT Analysis
- 17.2.11.4. Recent Developments
- 17.2.11.5. Financials (Based on Availability)
- 17.2.1 Nampack Ltd
List of Figures
- Figure 1: Global Beer Packaging Solutions Industry Revenue Breakdown (Million, %) by Region 2024 & 2032
- Figure 2: North America Beer Packaging Solutions Industry Revenue (Million), by Country 2024 & 2032
- Figure 3: North America Beer Packaging Solutions Industry Revenue Share (%), by Country 2024 & 2032
- Figure 4: Europe Beer Packaging Solutions Industry Revenue (Million), by Country 2024 & 2032
- Figure 5: Europe Beer Packaging Solutions Industry Revenue Share (%), by Country 2024 & 2032
- Figure 6: Asia Pacific Beer Packaging Solutions Industry Revenue (Million), by Country 2024 & 2032
- Figure 7: Asia Pacific Beer Packaging Solutions Industry Revenue Share (%), by Country 2024 & 2032
- Figure 8: Latin America Beer Packaging Solutions Industry Revenue (Million), by Country 2024 & 2032
- Figure 9: Latin America Beer Packaging Solutions Industry Revenue Share (%), by Country 2024 & 2032
- Figure 10: Middle East Beer Packaging Solutions Industry Revenue (Million), by Country 2024 & 2032
- Figure 11: Middle East Beer Packaging Solutions Industry Revenue Share (%), by Country 2024 & 2032
- Figure 12: Saudi Arabia Beer Packaging Solutions Industry Revenue (Million), by Country 2024 & 2032
- Figure 13: Saudi Arabia Beer Packaging Solutions Industry Revenue Share (%), by Country 2024 & 2032
- Figure 14: North America Beer Packaging Solutions Industry Revenue (Million), by Packaging Material 2024 & 2032
- Figure 15: North America Beer Packaging Solutions Industry Revenue Share (%), by Packaging Material 2024 & 2032
- Figure 16: North America Beer Packaging Solutions Industry Revenue (Million), by Packaging Type 2024 & 2032
- Figure 17: North America Beer Packaging Solutions Industry Revenue Share (%), by Packaging Type 2024 & 2032
- Figure 18: North America Beer Packaging Solutions Industry Revenue (Million), by Country 2024 & 2032
- Figure 19: North America Beer Packaging Solutions Industry Revenue Share (%), by Country 2024 & 2032
- Figure 20: Europe Beer Packaging Solutions Industry Revenue (Million), by Packaging Material 2024 & 2032
- Figure 21: Europe Beer Packaging Solutions Industry Revenue Share (%), by Packaging Material 2024 & 2032
- Figure 22: Europe Beer Packaging Solutions Industry Revenue (Million), by Packaging Type 2024 & 2032
- Figure 23: Europe Beer Packaging Solutions Industry Revenue Share (%), by Packaging Type 2024 & 2032
- Figure 24: Europe Beer Packaging Solutions Industry Revenue (Million), by Country 2024 & 2032
- Figure 25: Europe Beer Packaging Solutions Industry Revenue Share (%), by Country 2024 & 2032
- Figure 26: Asia Pacific Beer Packaging Solutions Industry Revenue (Million), by Packaging Material 2024 & 2032
- Figure 27: Asia Pacific Beer Packaging Solutions Industry Revenue Share (%), by Packaging Material 2024 & 2032
- Figure 28: Asia Pacific Beer Packaging Solutions Industry Revenue (Million), by Packaging Type 2024 & 2032
- Figure 29: Asia Pacific Beer Packaging Solutions Industry Revenue Share (%), by Packaging Type 2024 & 2032
- Figure 30: Asia Pacific Beer Packaging Solutions Industry Revenue (Million), by Country 2024 & 2032
- Figure 31: Asia Pacific Beer Packaging Solutions Industry Revenue Share (%), by Country 2024 & 2032
- Figure 32: Latin America Beer Packaging Solutions Industry Revenue (Million), by Packaging Material 2024 & 2032
- Figure 33: Latin America Beer Packaging Solutions Industry Revenue Share (%), by Packaging Material 2024 & 2032
- Figure 34: Latin America Beer Packaging Solutions Industry Revenue (Million), by Packaging Type 2024 & 2032
- Figure 35: Latin America Beer Packaging Solutions Industry Revenue Share (%), by Packaging Type 2024 & 2032
- Figure 36: Latin America Beer Packaging Solutions Industry Revenue (Million), by Country 2024 & 2032
- Figure 37: Latin America Beer Packaging Solutions Industry Revenue Share (%), by Country 2024 & 2032
- Figure 38: Middle East and Africa Beer Packaging Solutions Industry Revenue (Million), by Packaging Material 2024 & 2032
- Figure 39: Middle East and Africa Beer Packaging Solutions Industry Revenue Share (%), by Packaging Material 2024 & 2032
- Figure 40: Middle East and Africa Beer Packaging Solutions Industry Revenue (Million), by Packaging Type 2024 & 2032
- Figure 41: Middle East and Africa Beer Packaging Solutions Industry Revenue Share (%), by Packaging Type 2024 & 2032
- Figure 42: Middle East and Africa Beer Packaging Solutions Industry Revenue (Million), by Country 2024 & 2032
- Figure 43: Middle East and Africa Beer Packaging Solutions Industry Revenue Share (%), by Country 2024 & 2032
List of Tables
- Table 1: Global Beer Packaging Solutions Industry Revenue Million Forecast, by Region 2019 & 2032
- Table 2: Global Beer Packaging Solutions Industry Revenue Million Forecast, by Packaging Material 2019 & 2032
- Table 3: Global Beer Packaging Solutions Industry Revenue Million Forecast, by Packaging Type 2019 & 2032
- Table 4: Global Beer Packaging Solutions Industry Revenue Million Forecast, by Region 2019 & 2032
- Table 5: Global Beer Packaging Solutions Industry Revenue Million Forecast, by Country 2019 & 2032
- Table 6: United States Beer Packaging Solutions Industry Revenue (Million) Forecast, by Application 2019 & 2032
- Table 7: Canada Beer Packaging Solutions Industry Revenue (Million) Forecast, by Application 2019 & 2032
- Table 8: Global Beer Packaging Solutions Industry Revenue Million Forecast, by Country 2019 & 2032
- Table 9: United Kingdom Beer Packaging Solutions Industry Revenue (Million) Forecast, by Application 2019 & 2032
- Table 10: Germany Beer Packaging Solutions Industry Revenue (Million) Forecast, by Application 2019 & 2032
- Table 11: France Beer Packaging Solutions Industry Revenue (Million) Forecast, by Application 2019 & 2032
- Table 12: Rest of Europe Beer Packaging Solutions Industry Revenue (Million) Forecast, by Application 2019 & 2032
- Table 13: Global Beer Packaging Solutions Industry Revenue Million Forecast, by Country 2019 & 2032
- Table 14: China Beer Packaging Solutions Industry Revenue (Million) Forecast, by Application 2019 & 2032
- Table 15: India Beer Packaging Solutions Industry Revenue (Million) Forecast, by Application 2019 & 2032
- Table 16: Japan Beer Packaging Solutions Industry Revenue (Million) Forecast, by Application 2019 & 2032
- Table 17: Rest of Asia Pacific Beer Packaging Solutions Industry Revenue (Million) Forecast, by Application 2019 & 2032
- Table 18: Global Beer Packaging Solutions Industry Revenue Million Forecast, by Country 2019 & 2032
- Table 19: Brazil Beer Packaging Solutions Industry Revenue (Million) Forecast, by Application 2019 & 2032
- Table 20: Mexico Beer Packaging Solutions Industry Revenue (Million) Forecast, by Application 2019 & 2032
- Table 21: Rest of Latin America Beer Packaging Solutions Industry Revenue (Million) Forecast, by Application 2019 & 2032
- Table 22: Global Beer Packaging Solutions Industry Revenue Million Forecast, by Country 2019 & 2032
- Table 23: Beer Packaging Solutions Industry Revenue (Million) Forecast, by Application 2019 & 2032
- Table 24: Global Beer Packaging Solutions Industry Revenue Million Forecast, by Country 2019 & 2032
- Table 25: United Arab Emirates Beer Packaging Solutions Industry Revenue (Million) Forecast, by Application 2019 & 2032
- Table 26: South Africa Beer Packaging Solutions Industry Revenue (Million) Forecast, by Application 2019 & 2032
- Table 27: Rest of Middle East Beer Packaging Solutions Industry Revenue (Million) Forecast, by Application 2019 & 2032
- Table 28: Global Beer Packaging Solutions Industry Revenue Million Forecast, by Packaging Material 2019 & 2032
- Table 29: Global Beer Packaging Solutions Industry Revenue Million Forecast, by Packaging Type 2019 & 2032
- Table 30: Global Beer Packaging Solutions Industry Revenue Million Forecast, by Country 2019 & 2032
- Table 31: United States Beer Packaging Solutions Industry Revenue (Million) Forecast, by Application 2019 & 2032
- Table 32: Canada Beer Packaging Solutions Industry Revenue (Million) Forecast, by Application 2019 & 2032
- Table 33: Global Beer Packaging Solutions Industry Revenue Million Forecast, by Packaging Material 2019 & 2032
- Table 34: Global Beer Packaging Solutions Industry Revenue Million Forecast, by Packaging Type 2019 & 2032
- Table 35: Global Beer Packaging Solutions Industry Revenue Million Forecast, by Country 2019 & 2032
- Table 36: United Kingdom Beer Packaging Solutions Industry Revenue (Million) Forecast, by Application 2019 & 2032
- Table 37: Germany Beer Packaging Solutions Industry Revenue (Million) Forecast, by Application 2019 & 2032
- Table 38: France Beer Packaging Solutions Industry Revenue (Million) Forecast, by Application 2019 & 2032
- Table 39: Rest of Europe Beer Packaging Solutions Industry Revenue (Million) Forecast, by Application 2019 & 2032
- Table 40: Global Beer Packaging Solutions Industry Revenue Million Forecast, by Packaging Material 2019 & 2032
- Table 41: Global Beer Packaging Solutions Industry Revenue Million Forecast, by Packaging Type 2019 & 2032
- Table 42: Global Beer Packaging Solutions Industry Revenue Million Forecast, by Country 2019 & 2032
- Table 43: China Beer Packaging Solutions Industry Revenue (Million) Forecast, by Application 2019 & 2032
- Table 44: India Beer Packaging Solutions Industry Revenue (Million) Forecast, by Application 2019 & 2032
- Table 45: Japan Beer Packaging Solutions Industry Revenue (Million) Forecast, by Application 2019 & 2032
- Table 46: Rest of Asia Pacific Beer Packaging Solutions Industry Revenue (Million) Forecast, by Application 2019 & 2032
- Table 47: Global Beer Packaging Solutions Industry Revenue Million Forecast, by Packaging Material 2019 & 2032
- Table 48: Global Beer Packaging Solutions Industry Revenue Million Forecast, by Packaging Type 2019 & 2032
- Table 49: Global Beer Packaging Solutions Industry Revenue Million Forecast, by Country 2019 & 2032
- Table 50: Brazil Beer Packaging Solutions Industry Revenue (Million) Forecast, by Application 2019 & 2032
- Table 51: Mexico Beer Packaging Solutions Industry Revenue (Million) Forecast, by Application 2019 & 2032
- Table 52: Rest of Latin America Beer Packaging Solutions Industry Revenue (Million) Forecast, by Application 2019 & 2032
- Table 53: Global Beer Packaging Solutions Industry Revenue Million Forecast, by Packaging Material 2019 & 2032
- Table 54: Global Beer Packaging Solutions Industry Revenue Million Forecast, by Packaging Type 2019 & 2032
- Table 55: Global Beer Packaging Solutions Industry Revenue Million Forecast, by Country 2019 & 2032
- Table 56: Saudi Arabia Beer Packaging Solutions Industry Revenue (Million) Forecast, by Application 2019 & 2032
- Table 57: United Arab Emirates Beer Packaging Solutions Industry Revenue (Million) Forecast, by Application 2019 & 2032
- Table 58: South Africa Beer Packaging Solutions Industry Revenue (Million) Forecast, by Application 2019 & 2032
- Table 59: Rest of Middle East and Africa Beer Packaging Solutions Industry Revenue (Million) Forecast, by Application 2019 & 2032
Frequently Asked Questions
1. What is the projected Compound Annual Growth Rate (CAGR) of the Beer Packaging Solutions Industry?
The projected CAGR is approximately 3.60%.
2. Which companies are prominent players in the Beer Packaging Solutions Industry?
Key companies in the market include Nampack Ltd, Allied Glass Containers Limited, Ball Corporation, Plastipak Holdings Inc, Westrock Company, Ardagh Group SA, Smurfit Kappa Group PLC*List Not Exhaustive, Crown Holdings Incorporated, Carlsberg Group, Amcor Limited, Tetra Laval International SA.
3. What are the main segments of the Beer Packaging Solutions Industry?
The market segments include Packaging Material, Packaging Type.
4. Can you provide details about the market size?
The market size is estimated to be USD XX Million as of 2022.
5. What are some drivers contributing to market growth?
; Changing Consumer Preferences; Innovative Packaging and Attractive Marketing.
6. What are the notable trends driving market growth?
Glass Packaging is Expected to Hold the Largest Market Share.
7. Are there any restraints impacting market growth?
; Consumer Preference of Wine and Liquor Over Beer in a Few Regions.
8. Can you provide examples of recent developments in the market?
N/A
9. What pricing options are available for accessing the report?
Pricing options include single-user, multi-user, and enterprise licenses priced at USD 4750, USD 5250, and USD 8750 respectively.
10. Is the market size provided in terms of value or volume?
The market size is provided in terms of value, measured in Million.
11. Are there any specific market keywords associated with the report?
Yes, the market keyword associated with the report is "Beer Packaging Solutions Industry," which aids in identifying and referencing the specific market segment covered.
12. How do I determine which pricing option suits my needs best?
The pricing options vary based on user requirements and access needs. Individual users may opt for single-user licenses, while businesses requiring broader access may choose multi-user or enterprise licenses for cost-effective access to the report.
13. Are there any additional resources or data provided in the Beer Packaging Solutions Industry report?
While the report offers comprehensive insights, it's advisable to review the specific contents or supplementary materials provided to ascertain if additional resources or data are available.
14. How can I stay updated on further developments or reports in the Beer Packaging Solutions Industry?
To stay informed about further developments, trends, and reports in the Beer Packaging Solutions Industry, consider subscribing to industry newsletters, following relevant companies and organizations, or regularly checking reputable industry news sources and publications.
Methodology
Step 1 - Identification of Relevant Samples Size from Population Database


Step 2 - Approaches for Defining Global Market Size (Value, Volume* & Price*)

Note*: In applicable scenarios
Step 3 - Data Sources
Primary Research
- Web Analytics
- Survey Reports
- Research Institute
- Latest Research Reports
- Opinion Leaders
Secondary Research
- Annual Reports
- White Paper
- Latest Press Release
- Industry Association
- Paid Database
- Investor Presentations

Step 4 - Data Triangulation
Involves using different sources of information in order to increase the validity of a study
These sources are likely to be stakeholders in a program - participants, other researchers, program staff, other community members, and so on.
Then we put all data in single framework & apply various statistical tools to find out the dynamic on the market.
During the analysis stage, feedback from the stakeholder groups would be compared to determine areas of agreement as well as areas of divergence
