

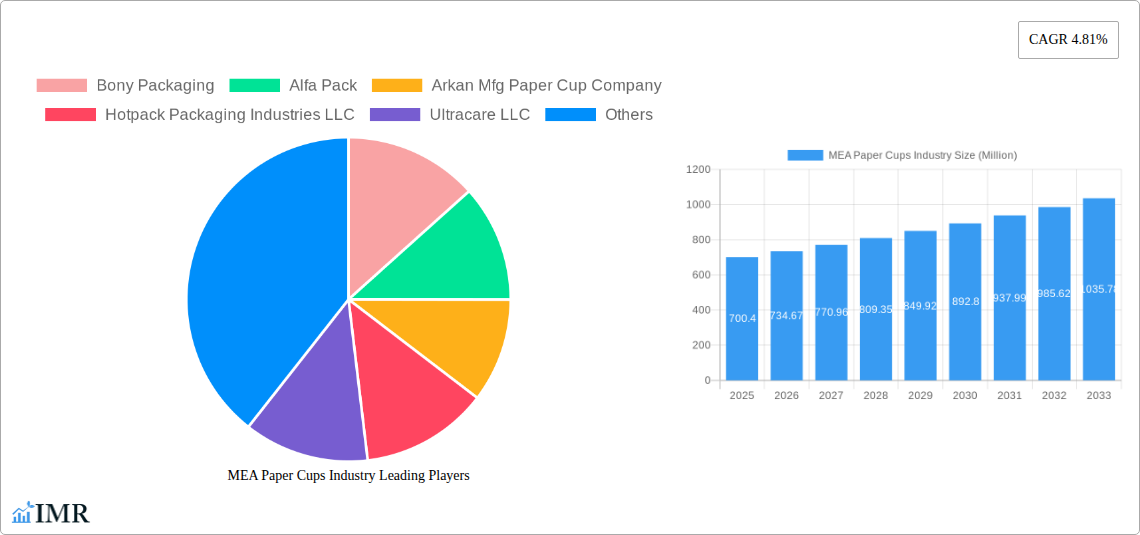
Key Insights
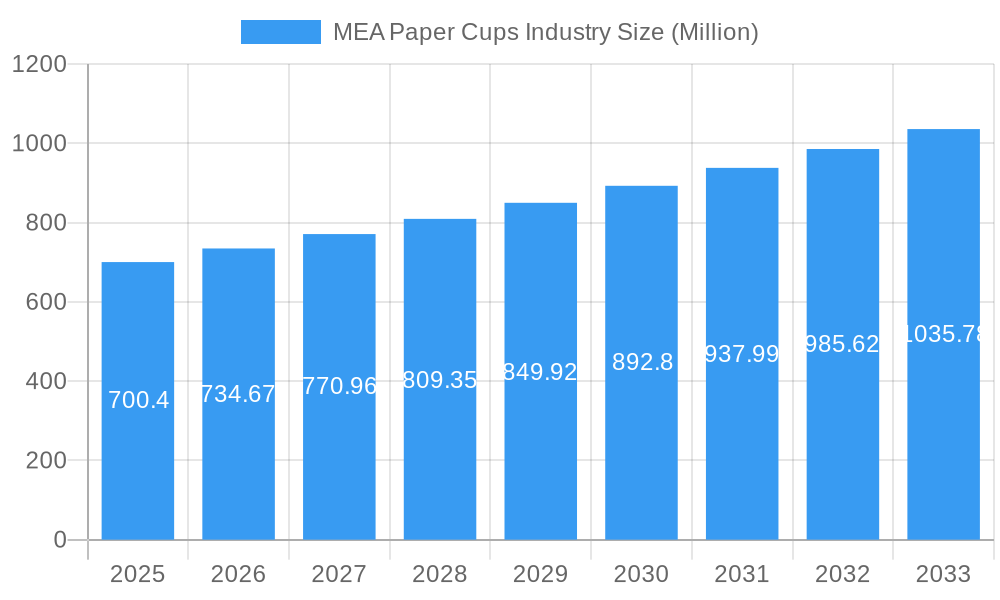
The Middle East and Africa (MEA) paper cups market, valued at $700.40 million in 2025, is projected to experience robust growth, driven by a compound annual growth rate (CAGR) of 4.81% from 2025 to 2033. This expansion is fueled by several key factors. The burgeoning quick-service restaurant (QSR) sector across the region, particularly in rapidly urbanizing areas of the UAE, Saudi Arabia, and Nigeria, is a significant driver. Increased disposable incomes and changing consumer preferences towards convenient and single-use packaging are also contributing to market growth. Furthermore, the rising popularity of takeaway and delivery services, amplified by the impact of technological advancements in food delivery platforms, significantly boosts demand for paper cups. While environmental concerns regarding single-use plastics present a potential restraint, the industry is actively adapting through the adoption of eco-friendly, biodegradable, and recycled paper cup options, mitigating this challenge. The market segmentation reveals significant opportunities in hot and cold paper cups, catering to diverse beverage consumption patterns. Key players, including Bony Packaging, Alfa Pack, and Huhtamaki Group, are strategically focusing on innovation, capacity expansion, and diversification to maintain a competitive edge.
MEA Paper Cups Industry Market Size (In Million)
The market's growth trajectory is expected to be influenced by government regulations promoting sustainable packaging solutions and increasing focus on hygiene and sanitation, especially in the post-pandemic era. While the Rest of Middle East and Africa segment currently contributes significantly to overall market value, substantial future growth is anticipated from countries like Saudi Arabia and Nigeria, given their robust economic growth and expanding populations. The competitive landscape is characterized by a mix of local and international players, with local manufacturers focusing on cost-effective production while international players leverage technological advantages and brand recognition. Ongoing investments in advanced manufacturing technologies and strategic partnerships are shaping the competitive dynamics and influencing the overall growth of the MEA paper cups market.
MEA Paper Cups Industry Company Market Share
MEA Paper Cups Industry Market Report: 2019-2033
This comprehensive report provides a detailed analysis of the Middle East and Africa (MEA) paper cups industry, encompassing market size, growth trends, competitive landscape, and future outlook. The report covers the period from 2019 to 2033, with 2025 as the base year and a forecast period of 2025-2033. It segments the market by cup type (hot and cold), application (quick service restaurants, institutional, other), and country (UAE, Saudi Arabia, South Africa, Nigeria, and Rest of MEA). This report is essential for industry professionals, investors, and anyone seeking a thorough understanding of this dynamic market.
MEA Paper Cups Industry Market Dynamics & Structure
The MEA paper cups market is characterized by a moderately fragmented structure, with several large regional players competing alongside numerous smaller local manufacturers. Market concentration is expected to increase slightly during the forecast period due to consolidation and expansion by major players. Technological innovation, primarily focusing on sustainable materials and improved manufacturing processes, plays a crucial role. Regulatory frameworks concerning food safety and environmental sustainability are constantly evolving, impacting production and packaging practices. Competitive substitutes, including reusable cups and other beverage containers, pose a challenge, particularly with growing environmental awareness. End-user demographics, particularly the expanding young population and the growth of the quick-service restaurant sector, are significant drivers. M&A activity in the industry remains modest, with a recorded xx million units worth of deals in 2024.
- Market Concentration: Moderately fragmented, trending towards consolidation.
- Technological Innovation: Focus on sustainable materials (e.g., recycled paper, biodegradable coatings) and efficient manufacturing.
- Regulatory Framework: Increasing emphasis on food safety and environmental compliance.
- Competitive Substitutes: Reusable cups and other beverage containers present a growing challenge.
- End-User Demographics: Expanding young population and growth of QSR sector drive demand.
- M&A Activity: xx million units in deal value in 2024.
MEA Paper Cups Industry Growth Trends & Insights
The MEA paper cups market experienced steady growth during the historical period (2019-2024), driven by increasing disposable income, urbanization, and the expansion of the food service industry. The market size reached xx million units in 2024, exhibiting a CAGR of xx% during this period. Technological disruptions, particularly the introduction of more eco-friendly materials and improved manufacturing techniques, influenced the market trajectory. Shifting consumer behavior, marked by an increased preference for convenience and on-the-go consumption, further fueled demand. The forecast period (2025-2033) anticipates continued growth, propelled by the expansion of QSRs, rising tourism, and growing awareness of hygiene in food service. Market penetration is expected to reach xx% by 2033, driven by ongoing urbanization and economic growth across the MEA region. The market is projected to reach xx million units by 2033, with a projected CAGR of xx%.
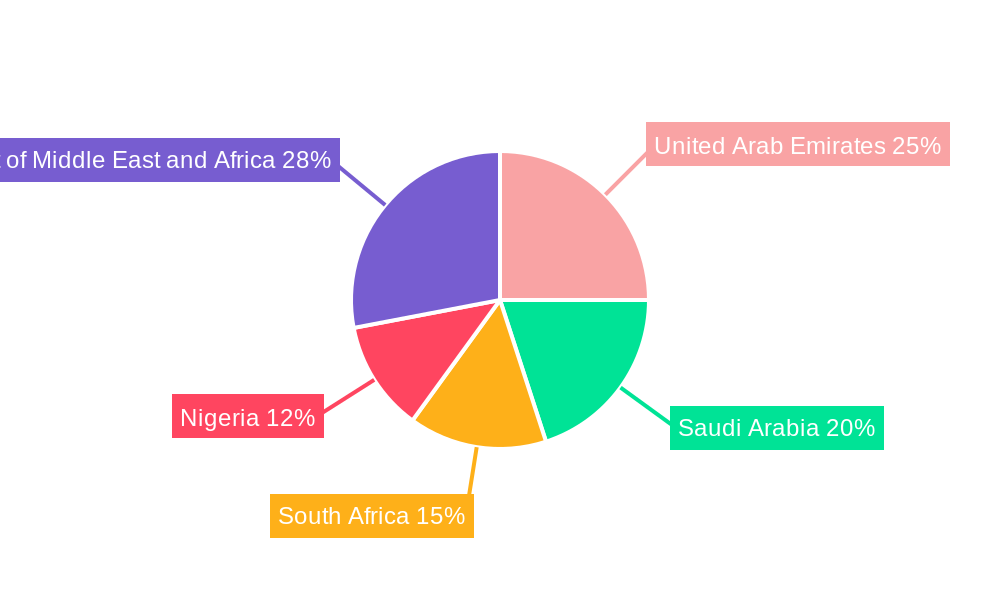
Dominant Regions, Countries, or Segments in MEA Paper Cups Industry
The UAE and Saudi Arabia represent the largest markets within the MEA region, driven by their robust economies, high population density, and significant presence of quick-service restaurants and institutional food service providers. Within the segment breakdown, hot paper cups command a larger market share compared to cold paper cups, owing to the prevalence of hot beverages in the region. The Quick Service Restaurant (QSR) segment dominates application-wise, reflecting the high concentration of fast-food chains and cafes.
UAE & Saudi Arabia: Strong economic growth, high population density, and significant QSR presence.
Hot Paper Cups: Higher demand compared to cold paper cups due to beverage consumption habits.
QSR Segment: Largest application segment due to fast-food chain prevalence.
South Africa: Growing market with potential for future expansion.
Nigeria: High population and expanding food service industry offer future growth opportunities.
Key Drivers:
- Strong economic growth in key countries.
- Expanding QSR sector and increasing disposable incomes.
- Growing preference for convenient and on-the-go consumption.
- Favorable government policies supporting the food service industry.
MEA Paper Cups Industry Product Landscape
The MEA paper cups market offers a diverse range of products, encompassing various sizes, designs, and materials. Innovations focus on enhancing functionality, aesthetics, and sustainability. Manufacturers are increasingly adopting biodegradable and compostable materials, responding to growing environmental concerns. Unique selling propositions often revolve around superior insulation, leak-proof designs, and aesthetically pleasing prints. Technological advancements, such as automated manufacturing processes and improved printing techniques, enhance production efficiency and product quality.
Key Drivers, Barriers & Challenges in MEA Paper Cups Industry
Key Drivers:
- Rising disposable incomes and increasing urbanization across the MEA region are driving demand.
- Growth in the QSR industry and the increasing popularity of coffee shops and cafes.
- Growing demand for convenient and eco-friendly packaging.
Key Challenges:
- Fluctuations in raw material prices (pulp, paperboard) impacting production costs.
- Intense competition from established and emerging players.
- Stringent environmental regulations influencing packaging choices and waste management. The regulatory hurdles impose an estimated xx% increase in compliance costs for manufacturers.
Emerging Opportunities in MEA Paper Cups Industry
Untapped markets within the MEA region, particularly in smaller countries with growing economies and populations, present significant opportunities. Innovative applications, such as customized cups for events and promotions, or eco-friendly options using recycled and sustainable materials, provide promising growth avenues. Evolving consumer preferences towards premium and aesthetically pleasing packaging create opportunities for differentiation.
Growth Accelerators in the MEA Paper Cups Industry
Technological breakthroughs in sustainable materials and manufacturing processes are key growth catalysts. Strategic partnerships between manufacturers and QSR chains can drive market penetration. Market expansion strategies focusing on under-served regions and new product development will accelerate growth.
Key Players Shaping the MEA Paper Cups Industry Market
- Bony Packaging
- Alfa Pack
- Arkan Mfg Paper Cup Company
- Hotpack Packaging Industries LLC
- Ultracare LLC
- Golden Paper Cups Manufacturing LLC
- Falcon Pack
- Detpak South Africa (Pty) Ltd
- Huhtamaki Group
- Pack-Zone
- MAIMOON Papers Industry LLC
- Saqr Pack
- Enpi Group
- Gulf East Paper & Plastic Group
- Graphic Packaging International
- Saham Group
Notable Milestones in MEA Paper Cups Industry Sector
- November 2022: Hotpack Global launches a new manufacturing plant in Qatar, expanding its global footprint and production capacity.
- September 2022: Huhtamaki and StoraEnso launch the Cup Collective, a paper cup recycling initiative promoting sustainability.
In-Depth MEA Paper Cups Industry Market Outlook
The MEA paper cups market exhibits substantial growth potential, driven by long-term trends like urbanization, rising disposable incomes, and the expansion of the food service sector. Strategic opportunities lie in leveraging sustainable materials, expanding into underserved markets, and forging strategic partnerships. The market's future trajectory is positive, presenting attractive prospects for existing and new players.
MEA Paper Cups Industry Segmentation
-
1. Cup Type
- 1.1. Hot Paper Cup
- 1.2. Cold Paper Cup
-
2. Application
- 2.1. Quick Service Restaurants
- 2.2. Institutional
- 2.3. Other Applications
MEA Paper Cups Industry Segmentation By Geography
-
1. North America
- 1.1. United States
- 1.2. Canada
- 1.3. Mexico
-
2. South America
- 2.1. Brazil
- 2.2. Argentina
- 2.3. Rest of South America
-
3. Europe
- 3.1. United Kingdom
- 3.2. Germany
- 3.3. France
- 3.4. Italy
- 3.5. Spain
- 3.6. Russia
- 3.7. Benelux
- 3.8. Nordics
- 3.9. Rest of Europe
-
4. Middle East & Africa
- 4.1. Turkey
- 4.2. Israel
- 4.3. GCC
- 4.4. North Africa
- 4.5. South Africa
- 4.6. Rest of Middle East & Africa
-
5. Asia Pacific
- 5.1. China
- 5.2. India
- 5.3. Japan
- 5.4. South Korea
- 5.5. ASEAN
- 5.6. Oceania
- 5.7. Rest of Asia Pacific
MEA Paper Cups Industry Regional Market Share
Geographic Coverage of MEA Paper Cups Industry
MEA Paper Cups Industry REPORT HIGHLIGHTS
| Aspects | Details |
|---|---|
| Study Period | 2020-2034 |
| Base Year | 2025 |
| Estimated Year | 2026 |
| Forecast Period | 2026-2034 |
| Historical Period | 2020-2025 |
| Growth Rate | CAGR of 4.81% from 2020-2034 |
| Segmentation |
|
Table of Contents
- 1. Introduction
- 1.1. Research Scope
- 1.2. Market Segmentation
- 1.3. Research Objective
- 1.4. Definitions and Assumptions
- 2. Executive Summary
- 2.1. Market Snapshot
- 3. Market Dynamics
- 3.1. Market Drivers
- 3.2. Market Restrains
- 3.3. Market Trends
- 3.4. Market Opportunities
- 4. Market Factor Analysis
- 4.1. Porters Five Forces
- 4.1.1. Bargaining Power of Suppliers
- 4.1.2. Bargaining Power of Buyers
- 4.1.3. Threat of New Entrants
- 4.1.4. Threat of Substitutes
- 4.1.5. Competitive Rivalry
- 4.2. PESTEL analysis
- 4.3. BCG Analysis
- 4.3.1. Stars (High Growth, High Market Share)
- 4.3.2. Cash Cows (Low Growth, High Market Share)
- 4.3.3. Question Mark (High Growth, Low Market Share)
- 4.3.4. Dogs (Low Growth, Low Market Share)
- 4.4. Ansoff Matrix Analysis
- 4.5. Supply Chain Analysis
- 4.6. Regulatory Landscape
- 4.7. Current Market Potential and Opportunity Assessment (TAM–SAM–SOM Framework)
- 4.8. IMR Analyst Note
- 4.1. Porters Five Forces
- 5. Market Analysis, Insights and Forecast 2021-2033
- 5.1. Market Analysis, Insights and Forecast - by Cup Type
- 5.1.1. Hot Paper Cup
- 5.1.2. Cold Paper Cup
- 5.2. Market Analysis, Insights and Forecast - by Application
- 5.2.1. Quick Service Restaurants
- 5.2.2. Institutional
- 5.2.3. Other Applications
- 5.3. Market Analysis, Insights and Forecast - by Region
- 5.3.1. North America
- 5.3.2. South America
- 5.3.3. Europe
- 5.3.4. Middle East & Africa
- 5.3.5. Asia Pacific
- 5.1. Market Analysis, Insights and Forecast - by Cup Type
- 6. Global MEA Paper Cups Industry Analysis, Insights and Forecast, 2021-2033
- 6.1. Market Analysis, Insights and Forecast - by Cup Type
- 6.1.1. Hot Paper Cup
- 6.1.2. Cold Paper Cup
- 6.2. Market Analysis, Insights and Forecast - by Application
- 6.2.1. Quick Service Restaurants
- 6.2.2. Institutional
- 6.2.3. Other Applications
- 6.1. Market Analysis, Insights and Forecast - by Cup Type
- 7. North America MEA Paper Cups Industry Analysis, Insights and Forecast, 2020-2032
- 7.1. Market Analysis, Insights and Forecast - by Cup Type
- 7.1.1. Hot Paper Cup
- 7.1.2. Cold Paper Cup
- 7.2. Market Analysis, Insights and Forecast - by Application
- 7.2.1. Quick Service Restaurants
- 7.2.2. Institutional
- 7.2.3. Other Applications
- 7.1. Market Analysis, Insights and Forecast - by Cup Type
- 8. South America MEA Paper Cups Industry Analysis, Insights and Forecast, 2020-2032
- 8.1. Market Analysis, Insights and Forecast - by Cup Type
- 8.1.1. Hot Paper Cup
- 8.1.2. Cold Paper Cup
- 8.2. Market Analysis, Insights and Forecast - by Application
- 8.2.1. Quick Service Restaurants
- 8.2.2. Institutional
- 8.2.3. Other Applications
- 8.1. Market Analysis, Insights and Forecast - by Cup Type
- 9. Europe MEA Paper Cups Industry Analysis, Insights and Forecast, 2020-2032
- 9.1. Market Analysis, Insights and Forecast - by Cup Type
- 9.1.1. Hot Paper Cup
- 9.1.2. Cold Paper Cup
- 9.2. Market Analysis, Insights and Forecast - by Application
- 9.2.1. Quick Service Restaurants
- 9.2.2. Institutional
- 9.2.3. Other Applications
- 9.1. Market Analysis, Insights and Forecast - by Cup Type
- 10. Middle East & Africa MEA Paper Cups Industry Analysis, Insights and Forecast, 2020-2032
- 10.1. Market Analysis, Insights and Forecast - by Cup Type
- 10.1.1. Hot Paper Cup
- 10.1.2. Cold Paper Cup
- 10.2. Market Analysis, Insights and Forecast - by Application
- 10.2.1. Quick Service Restaurants
- 10.2.2. Institutional
- 10.2.3. Other Applications
- 10.1. Market Analysis, Insights and Forecast - by Cup Type
- 11. Asia Pacific MEA Paper Cups Industry Analysis, Insights and Forecast, 2020-2032
- 11.1. Market Analysis, Insights and Forecast - by Cup Type
- 11.1.1. Hot Paper Cup
- 11.1.2. Cold Paper Cup
- 11.2. Market Analysis, Insights and Forecast - by Application
- 11.2.1. Quick Service Restaurants
- 11.2.2. Institutional
- 11.2.3. Other Applications
- 11.1. Market Analysis, Insights and Forecast - by Cup Type
- 12. Competitive Analysis
- 12.1. Company Profiles
- 12.1.1 Bony Packaging
- 12.1.1.1. Company Overview
- 12.1.1.2. Products
- 12.1.1.3. Company Financials
- 12.1.1.4. SWOT Analysis
- 12.1.2 Alfa Pack
- 12.1.2.1. Company Overview
- 12.1.2.2. Products
- 12.1.2.3. Company Financials
- 12.1.2.4. SWOT Analysis
- 12.1.3 Arkan Mfg Paper Cup Company
- 12.1.3.1. Company Overview
- 12.1.3.2. Products
- 12.1.3.3. Company Financials
- 12.1.3.4. SWOT Analysis
- 12.1.4 Hotpack Packaging Industries LLC
- 12.1.4.1. Company Overview
- 12.1.4.2. Products
- 12.1.4.3. Company Financials
- 12.1.4.4. SWOT Analysis
- 12.1.5 Ultracare LLC
- 12.1.5.1. Company Overview
- 12.1.5.2. Products
- 12.1.5.3. Company Financials
- 12.1.5.4. SWOT Analysis
- 12.1.6 Golden Paper Cups Manufacturing LLC
- 12.1.6.1. Company Overview
- 12.1.6.2. Products
- 12.1.6.3. Company Financials
- 12.1.6.4. SWOT Analysis
- 12.1.7 Falcon Pack*List Not Exhaustive
- 12.1.7.1. Company Overview
- 12.1.7.2. Products
- 12.1.7.3. Company Financials
- 12.1.7.4. SWOT Analysis
- 12.1.8 Detpak South Africa (Pty) Ltd
- 12.1.8.1. Company Overview
- 12.1.8.2. Products
- 12.1.8.3. Company Financials
- 12.1.8.4. SWOT Analysis
- 12.1.9 Huhtamaki Group
- 12.1.9.1. Company Overview
- 12.1.9.2. Products
- 12.1.9.3. Company Financials
- 12.1.9.4. SWOT Analysis
- 12.1.10 Pack- Zone
- 12.1.10.1. Company Overview
- 12.1.10.2. Products
- 12.1.10.3. Company Financials
- 12.1.10.4. SWOT Analysis
- 12.1.11 MAIMOON Papers Industry LLC
- 12.1.11.1. Company Overview
- 12.1.11.2. Products
- 12.1.11.3. Company Financials
- 12.1.11.4. SWOT Analysis
- 12.1.12 Saqr Pack
- 12.1.12.1. Company Overview
- 12.1.12.2. Products
- 12.1.12.3. Company Financials
- 12.1.12.4. SWOT Analysis
- 12.1.13 Enpi Group
- 12.1.13.1. Company Overview
- 12.1.13.2. Products
- 12.1.13.3. Company Financials
- 12.1.13.4. SWOT Analysis
- 12.1.14 Gulf East Paper & Plastic Group
- 12.1.14.1. Company Overview
- 12.1.14.2. Products
- 12.1.14.3. Company Financials
- 12.1.14.4. SWOT Analysis
- 12.1.15 Graphic Packaging International
- 12.1.15.1. Company Overview
- 12.1.15.2. Products
- 12.1.15.3. Company Financials
- 12.1.15.4. SWOT Analysis
- 12.1.16 Saham Group
- 12.1.16.1. Company Overview
- 12.1.16.2. Products
- 12.1.16.3. Company Financials
- 12.1.16.4. SWOT Analysis
- 12.1.1 Bony Packaging
- 12.2. Market Entropy
- 12.2.1 Company's Key Areas Served
- 12.2.2 Recent Developments
- 12.3. Company Market Share Analysis 2025
- 12.3.1 Top 5 Companies Market Share Analysis
- 12.3.2 Top 3 Companies Market Share Analysis
- 12.4. List of Potential Customers
- 13. Research Methodology
List of Figures
- Figure 1: Global MEA Paper Cups Industry Revenue Breakdown (Million, %) by Region 2025 & 2033
- Figure 2: North America MEA Paper Cups Industry Revenue (Million), by Cup Type 2025 & 2033
- Figure 3: North America MEA Paper Cups Industry Revenue Share (%), by Cup Type 2025 & 2033
- Figure 4: North America MEA Paper Cups Industry Revenue (Million), by Application 2025 & 2033
- Figure 5: North America MEA Paper Cups Industry Revenue Share (%), by Application 2025 & 2033
- Figure 6: North America MEA Paper Cups Industry Revenue (Million), by Country 2025 & 2033
- Figure 7: North America MEA Paper Cups Industry Revenue Share (%), by Country 2025 & 2033
- Figure 8: South America MEA Paper Cups Industry Revenue (Million), by Cup Type 2025 & 2033
- Figure 9: South America MEA Paper Cups Industry Revenue Share (%), by Cup Type 2025 & 2033
- Figure 10: South America MEA Paper Cups Industry Revenue (Million), by Application 2025 & 2033
- Figure 11: South America MEA Paper Cups Industry Revenue Share (%), by Application 2025 & 2033
- Figure 12: South America MEA Paper Cups Industry Revenue (Million), by Country 2025 & 2033
- Figure 13: South America MEA Paper Cups Industry Revenue Share (%), by Country 2025 & 2033
- Figure 14: Europe MEA Paper Cups Industry Revenue (Million), by Cup Type 2025 & 2033
- Figure 15: Europe MEA Paper Cups Industry Revenue Share (%), by Cup Type 2025 & 2033
- Figure 16: Europe MEA Paper Cups Industry Revenue (Million), by Application 2025 & 2033
- Figure 17: Europe MEA Paper Cups Industry Revenue Share (%), by Application 2025 & 2033
- Figure 18: Europe MEA Paper Cups Industry Revenue (Million), by Country 2025 & 2033
- Figure 19: Europe MEA Paper Cups Industry Revenue Share (%), by Country 2025 & 2033
- Figure 20: Middle East & Africa MEA Paper Cups Industry Revenue (Million), by Cup Type 2025 & 2033
- Figure 21: Middle East & Africa MEA Paper Cups Industry Revenue Share (%), by Cup Type 2025 & 2033
- Figure 22: Middle East & Africa MEA Paper Cups Industry Revenue (Million), by Application 2025 & 2033
- Figure 23: Middle East & Africa MEA Paper Cups Industry Revenue Share (%), by Application 2025 & 2033
- Figure 24: Middle East & Africa MEA Paper Cups Industry Revenue (Million), by Country 2025 & 2033
- Figure 25: Middle East & Africa MEA Paper Cups Industry Revenue Share (%), by Country 2025 & 2033
- Figure 26: Asia Pacific MEA Paper Cups Industry Revenue (Million), by Cup Type 2025 & 2033
- Figure 27: Asia Pacific MEA Paper Cups Industry Revenue Share (%), by Cup Type 2025 & 2033
- Figure 28: Asia Pacific MEA Paper Cups Industry Revenue (Million), by Application 2025 & 2033
- Figure 29: Asia Pacific MEA Paper Cups Industry Revenue Share (%), by Application 2025 & 2033
- Figure 30: Asia Pacific MEA Paper Cups Industry Revenue (Million), by Country 2025 & 2033
- Figure 31: Asia Pacific MEA Paper Cups Industry Revenue Share (%), by Country 2025 & 2033
List of Tables
- Table 1: Global MEA Paper Cups Industry Revenue Million Forecast, by Cup Type 2020 & 2033
- Table 2: Global MEA Paper Cups Industry Revenue Million Forecast, by Application 2020 & 2033
- Table 3: Global MEA Paper Cups Industry Revenue Million Forecast, by Region 2020 & 2033
- Table 4: Global MEA Paper Cups Industry Revenue Million Forecast, by Cup Type 2020 & 2033
- Table 5: Global MEA Paper Cups Industry Revenue Million Forecast, by Application 2020 & 2033
- Table 6: Global MEA Paper Cups Industry Revenue Million Forecast, by Country 2020 & 2033
- Table 7: United States MEA Paper Cups Industry Revenue (Million) Forecast, by Application 2020 & 2033
- Table 8: Canada MEA Paper Cups Industry Revenue (Million) Forecast, by Application 2020 & 2033
- Table 9: Mexico MEA Paper Cups Industry Revenue (Million) Forecast, by Application 2020 & 2033
- Table 10: Global MEA Paper Cups Industry Revenue Million Forecast, by Cup Type 2020 & 2033
- Table 11: Global MEA Paper Cups Industry Revenue Million Forecast, by Application 2020 & 2033
- Table 12: Global MEA Paper Cups Industry Revenue Million Forecast, by Country 2020 & 2033
- Table 13: Brazil MEA Paper Cups Industry Revenue (Million) Forecast, by Application 2020 & 2033
- Table 14: Argentina MEA Paper Cups Industry Revenue (Million) Forecast, by Application 2020 & 2033
- Table 15: Rest of South America MEA Paper Cups Industry Revenue (Million) Forecast, by Application 2020 & 2033
- Table 16: Global MEA Paper Cups Industry Revenue Million Forecast, by Cup Type 2020 & 2033
- Table 17: Global MEA Paper Cups Industry Revenue Million Forecast, by Application 2020 & 2033
- Table 18: Global MEA Paper Cups Industry Revenue Million Forecast, by Country 2020 & 2033
- Table 19: United Kingdom MEA Paper Cups Industry Revenue (Million) Forecast, by Application 2020 & 2033
- Table 20: Germany MEA Paper Cups Industry Revenue (Million) Forecast, by Application 2020 & 2033
- Table 21: France MEA Paper Cups Industry Revenue (Million) Forecast, by Application 2020 & 2033
- Table 22: Italy MEA Paper Cups Industry Revenue (Million) Forecast, by Application 2020 & 2033
- Table 23: Spain MEA Paper Cups Industry Revenue (Million) Forecast, by Application 2020 & 2033
- Table 24: Russia MEA Paper Cups Industry Revenue (Million) Forecast, by Application 2020 & 2033
- Table 25: Benelux MEA Paper Cups Industry Revenue (Million) Forecast, by Application 2020 & 2033
- Table 26: Nordics MEA Paper Cups Industry Revenue (Million) Forecast, by Application 2020 & 2033
- Table 27: Rest of Europe MEA Paper Cups Industry Revenue (Million) Forecast, by Application 2020 & 2033
- Table 28: Global MEA Paper Cups Industry Revenue Million Forecast, by Cup Type 2020 & 2033
- Table 29: Global MEA Paper Cups Industry Revenue Million Forecast, by Application 2020 & 2033
- Table 30: Global MEA Paper Cups Industry Revenue Million Forecast, by Country 2020 & 2033
- Table 31: Turkey MEA Paper Cups Industry Revenue (Million) Forecast, by Application 2020 & 2033
- Table 32: Israel MEA Paper Cups Industry Revenue (Million) Forecast, by Application 2020 & 2033
- Table 33: GCC MEA Paper Cups Industry Revenue (Million) Forecast, by Application 2020 & 2033
- Table 34: North Africa MEA Paper Cups Industry Revenue (Million) Forecast, by Application 2020 & 2033
- Table 35: South Africa MEA Paper Cups Industry Revenue (Million) Forecast, by Application 2020 & 2033
- Table 36: Rest of Middle East & Africa MEA Paper Cups Industry Revenue (Million) Forecast, by Application 2020 & 2033
- Table 37: Global MEA Paper Cups Industry Revenue Million Forecast, by Cup Type 2020 & 2033
- Table 38: Global MEA Paper Cups Industry Revenue Million Forecast, by Application 2020 & 2033
- Table 39: Global MEA Paper Cups Industry Revenue Million Forecast, by Country 2020 & 2033
- Table 40: China MEA Paper Cups Industry Revenue (Million) Forecast, by Application 2020 & 2033
- Table 41: India MEA Paper Cups Industry Revenue (Million) Forecast, by Application 2020 & 2033
- Table 42: Japan MEA Paper Cups Industry Revenue (Million) Forecast, by Application 2020 & 2033
- Table 43: South Korea MEA Paper Cups Industry Revenue (Million) Forecast, by Application 2020 & 2033
- Table 44: ASEAN MEA Paper Cups Industry Revenue (Million) Forecast, by Application 2020 & 2033
- Table 45: Oceania MEA Paper Cups Industry Revenue (Million) Forecast, by Application 2020 & 2033
- Table 46: Rest of Asia Pacific MEA Paper Cups Industry Revenue (Million) Forecast, by Application 2020 & 2033
Frequently Asked Questions
1. What is the projected Compound Annual Growth Rate (CAGR) of the MEA Paper Cups Industry?
The projected CAGR is approximately 4.81%.
2. Which companies are prominent players in the MEA Paper Cups Industry?
Key companies in the market include Bony Packaging, Alfa Pack, Arkan Mfg Paper Cup Company, Hotpack Packaging Industries LLC, Ultracare LLC, Golden Paper Cups Manufacturing LLC, Falcon Pack*List Not Exhaustive, Detpak South Africa (Pty) Ltd, Huhtamaki Group, Pack- Zone, MAIMOON Papers Industry LLC, Saqr Pack, Enpi Group, Gulf East Paper & Plastic Group, Graphic Packaging International, Saham Group.
3. What are the main segments of the MEA Paper Cups Industry?
The market segments include Cup Type, Application.
4. Can you provide details about the market size?
The market size is estimated to be USD 700.40 Million as of 2022.
5. What are some drivers contributing to market growth?
Rising Demand For on-the-go Consumption of Beverages; Sustainability Measures Coupled with Recent Innovations have Played a Role in Shelf Life of Products.
6. What are the notable trends driving market growth?
Quick Service Restaurants to Witness the Growth.
7. Are there any restraints impacting market growth?
Ongoing Market Fragmentation and the Dependence on Materials Expected to Affect Margins.
8. Can you provide examples of recent developments in the market?
November 2022: HotpackGlobal, the UAE-based global leader in disposable food packaging products, launched its manufacturing plant in Qatar. The plant is the 15th Hotpack-owned and operated factory worldwide, reflecting the company's global vision to become a global food packaging brand leader by 2030. The manufacturing plant is located in Doha's new industrial area, specializing in various Hotpackpaper products ranging from folding and corrugated cartons to paper bags and cups.
9. What pricing options are available for accessing the report?
Pricing options include single-user, multi-user, and enterprise licenses priced at USD 4750, USD 5250, and USD 8750 respectively.
10. Is the market size provided in terms of value or volume?
The market size is provided in terms of value, measured in Million.
11. Are there any specific market keywords associated with the report?
Yes, the market keyword associated with the report is "MEA Paper Cups Industry," which aids in identifying and referencing the specific market segment covered.
12. How do I determine which pricing option suits my needs best?
The pricing options vary based on user requirements and access needs. Individual users may opt for single-user licenses, while businesses requiring broader access may choose multi-user or enterprise licenses for cost-effective access to the report.
13. Are there any additional resources or data provided in the MEA Paper Cups Industry report?
While the report offers comprehensive insights, it's advisable to review the specific contents or supplementary materials provided to ascertain if additional resources or data are available.
14. How can I stay updated on further developments or reports in the MEA Paper Cups Industry?
To stay informed about further developments, trends, and reports in the MEA Paper Cups Industry, consider subscribing to industry newsletters, following relevant companies and organizations, or regularly checking reputable industry news sources and publications.
Methodology
Step 1 - Identification of Relevant Samples Size from Population Database


Step 2 - Approaches for Defining Global Market Size (Value, Volume* & Price*)

Note*: In applicable scenarios
Step 3 - Data Sources
Primary Research
- Web Analytics
- Survey Reports
- Research Institute
- Latest Research Reports
- Opinion Leaders
Secondary Research
- Annual Reports
- White Paper
- Latest Press Release
- Industry Association
- Paid Database
- Investor Presentations

Step 4 - Data Triangulation
Involves using different sources of information in order to increase the validity of a study
These sources are likely to be stakeholders in a program - participants, other researchers, program staff, other community members, and so on.
Then we put all data in single framework & apply various statistical tools to find out the dynamic on the market.
During the analysis stage, feedback from the stakeholder groups would be compared to determine areas of agreement as well as areas of divergence