

Key Insights
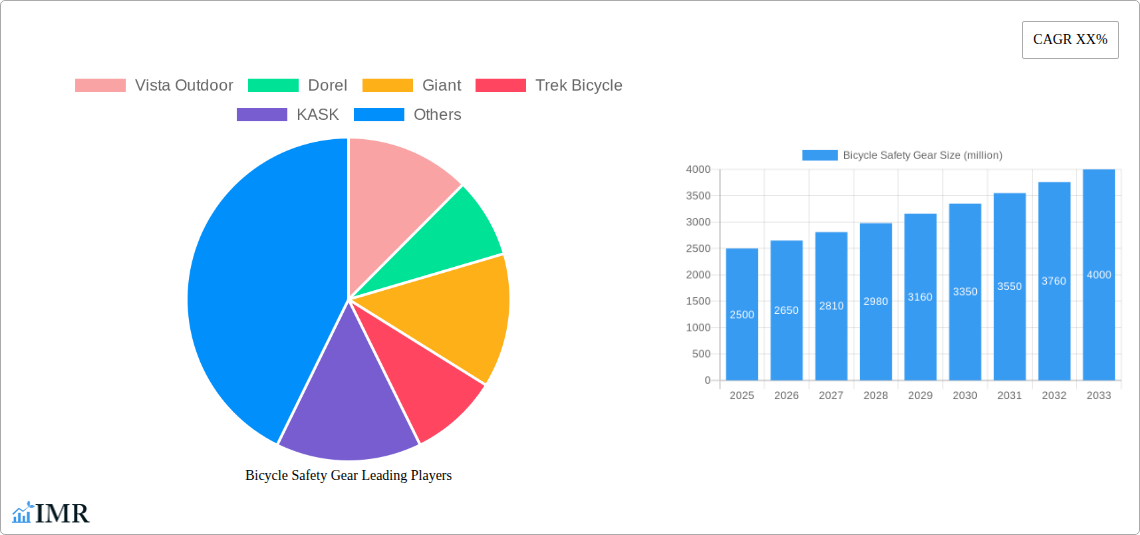
The global bicycle safety gear market is experiencing robust growth, driven by increasing bicycle usage for commuting and recreation, coupled with heightened awareness of road safety. The market, estimated at $2.5 billion in 2025, is projected to exhibit a Compound Annual Growth Rate (CAGR) of 6% from 2025 to 2033, reaching approximately $4 billion by 2033. This growth is fueled by several key trends, including the rising popularity of e-bikes, increased cycling infrastructure development in urban areas, and stricter safety regulations in various regions. Furthermore, technological advancements in safety gear, such as integrated lighting systems and improved helmet designs, are enhancing product appeal and driving market expansion. While the market faces some restraints, including price sensitivity in certain regions and potential saturation in mature markets, the overall outlook remains positive due to the sustained growth in cycling activities and a rising focus on personal safety.
Key market segments include helmets, which account for the largest share, followed by lights, gloves, and protective clothing. The competitive landscape is fragmented, with both established international brands like Vista Outdoor, Trek Bicycle, and Specialized, and regional players vying for market share. Geographic regions such as North America and Europe currently hold significant market shares, driven by high cycling penetration rates and a robust awareness of safety practices. However, significant growth opportunities exist in emerging markets in Asia and Latin America, where rising disposable incomes and increasing urbanization are fostering demand for bicycle safety gear. The market is expected to witness a shift towards specialized gear catering to different cycling disciplines, such as mountain biking and road cycling.
Bicycle Safety Gear Market Report: 2019-2033
This comprehensive report provides an in-depth analysis of the Bicycle Safety Gear market, encompassing market dynamics, growth trends, regional analysis, product landscape, and key players. The study period covers 2019-2033, with a base year of 2025 and a forecast period of 2025-2033. The report offers valuable insights for industry professionals, investors, and stakeholders seeking to understand and capitalize on opportunities within this dynamic market. The total market size is projected to reach xx million units by 2033.
Bicycle Safety Gear Market Dynamics & Structure
The Bicycle Safety Gear market is characterized by a moderately concentrated structure with several key players dominating specific segments. Technological innovation, driven by advancements in materials science and electronics, is a major growth driver. Stringent safety regulations, particularly in developed markets, are shaping product development and influencing market dynamics. The market also witnesses competitive pressure from substitute products, such as improved vehicle safety features. End-user demographics, primarily encompassing cyclists of various ages and skill levels, are pivotal in driving demand. Consolidation through mergers and acquisitions (M&A) activities is observed, with approximately xx M&A deals recorded between 2019 and 2024.
- Market Concentration: The top 5 players hold approximately xx% of the market share (2025).
- Technological Innovation: Focus on lightweight, aerodynamic, and integrated safety features.
- Regulatory Landscape: Compliance with safety standards (e.g., CE, CPSC) influences product design.
- Competitive Substitutes: Increased car safety features and alternative transportation modes pose competitive threats.
- End-User Demographics: Growth driven by increasing participation in cycling, particularly in urban areas and recreational cycling.
- M&A Activity: Consolidation expected to increase market concentration and enhance technological capabilities.
Bicycle Safety Gear Growth Trends & Insights
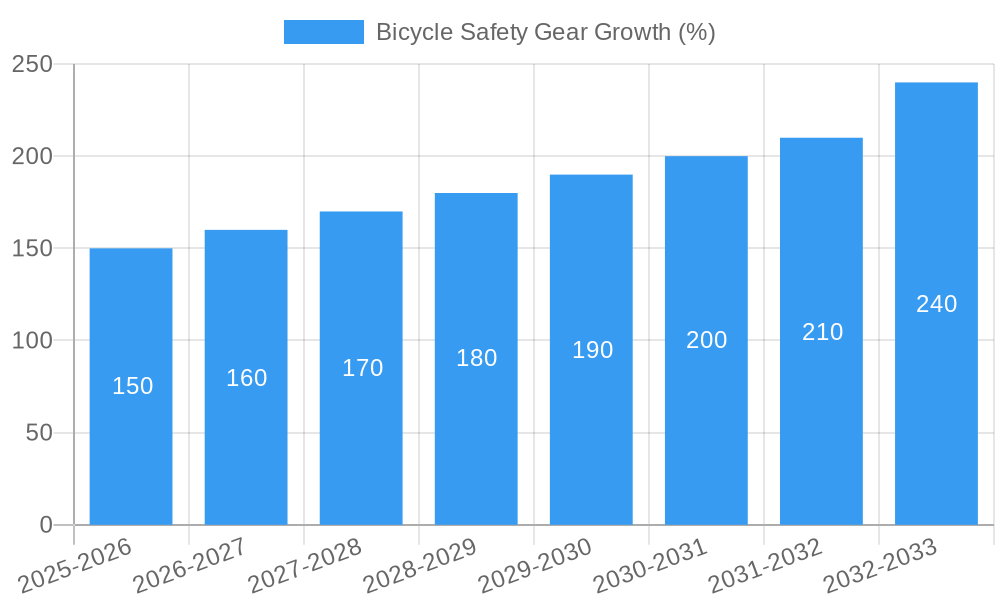
The Bicycle Safety Gear market witnessed a Compound Annual Growth Rate (CAGR) of xx% during the historical period (2019-2024). This growth is attributed to factors such as the rising popularity of cycling for commuting, recreation, and sports, coupled with increased awareness of safety concerns among cyclists. Technological disruptions, such as the integration of smart sensors and connectivity features, are driving adoption rates and reshaping consumer preferences. Market penetration is expected to reach xx% by 2033, indicating significant growth potential. Consumer behavior shifts include a preference for high-quality, technologically advanced safety gear.
Dominant Regions, Countries, or Segments in Bicycle Safety Gear
North America and Europe currently dominate the Bicycle Safety Gear market, primarily due to high cycling participation rates and stringent safety regulations. However, Asia-Pacific is projected to experience the fastest growth, fueled by rapid urbanization, increasing disposable incomes, and growing awareness of cycling safety. Within segments, helmets maintain the largest market share, followed by lights and protective apparel.
- North America: High awareness of safety, strong regulatory environment, and a large cycling enthusiast base.
- Europe: Similar to North America, with high adoption rates and a developed cycling infrastructure.
- Asia-Pacific: Rapid growth potential driven by increasing urbanization and rising disposable incomes.
- Helmets: Largest segment, driven by mandatory helmet laws in several regions.
- Lights: Significant growth driven by enhanced visibility features and technological advancements.
Bicycle Safety Gear Product Landscape
The Bicycle Safety Gear market offers a diverse range of products, including helmets, lights, gloves, knee and elbow pads, high-visibility clothing, and other accessories. Continuous innovation focuses on improving comfort, aerodynamics, and safety features. Advancements in materials science lead to lighter, stronger, and more durable products. Unique selling propositions include features such as integrated sensors, smart connectivity, and enhanced visibility technologies.
Key Drivers, Barriers & Challenges in Bicycle Safety Gear
Key Drivers:
- Increasing awareness of cycling safety.
- Rising popularity of cycling as a mode of transportation and recreation.
- Technological advancements leading to improved safety features and functionalities.
- Stringent safety regulations in many countries.
Key Barriers & Challenges:
- Price sensitivity of consumers, especially in emerging markets.
- Supply chain disruptions affecting product availability and costs.
- Intense competition from numerous players, leading to price wars.
- Regulatory hurdles in some regions, hindering market penetration.
Emerging Opportunities in Bicycle Safety Gear
Untapped markets in developing economies present significant growth potential. Innovative applications, such as integrated safety systems with connected devices, offer compelling opportunities. Evolving consumer preferences toward stylish and comfortable safety gear represent further market expansion avenues.
Growth Accelerators in the Bicycle Safety Gear Industry
Technological breakthroughs in materials science and electronics are significant growth catalysts. Strategic partnerships between safety gear manufacturers and bicycle brands enhance product distribution and market reach. Market expansion strategies focused on emerging economies and untapped segments are also driving long-term growth.
Key Players Shaping the Bicycle Safety Gear Market
- Vista Outdoor
- Dorel
- Giant
- Trek Bicycle
- KASK
- Mavic
- Merida
- Specialized
- Uvex
- Scott Sports
- OGK KABUTO
- MET
- ABUS
- SenHai Sports Goods
- Strategic Sports
- Orbea
- Rudy Project
- GUB
- One Industries
- CatEye
- SIGMA SPORT
- Serfas
- Knog
- Exposure Lights
- Topeak
- Planet Bike
- NiteRider
- Magicshine
- BBB Cycling
- Ferei
Notable Milestones in Bicycle Safety Gear Sector
- 2020: Introduction of smart helmets with integrated sensors and fall detection.
- 2021: Several key players launched new lines of sustainable and eco-friendly safety gear.
- 2022: Significant increase in demand for high-visibility clothing due to increased cycling during pandemic.
- 2023: Several mergers and acquisitions consolidate market share amongst key players.
- 2024: New regulations regarding electronic safety features are implemented in key markets.
In-Depth Bicycle Safety Gear Market Outlook
The Bicycle Safety Gear market is poised for continued growth, driven by technological advancements, increasing consumer awareness, and expanding market penetration in emerging economies. Strategic partnerships and focused product innovation will shape the future of the industry. Opportunities exist for companies to capitalize on the rising demand for advanced safety features, sustainable materials, and connected devices. This translates to promising opportunities for significant market expansion and investment potential over the forecast period.
Bicycle Safety Gear Segmentation
-
1. Application
- 1.1. Online Stores
- 1.2. Hypermarkets/Supermarkets
- 1.3. Multi-Brand Stores
- 1.4. Specialty Stores
- 1.5. Independent Small Stores
- 1.6. Others
-
2. Types
- 2.1. Helmet
- 2.2. Mouth Guard
- 2.3. Gloves
- 2.4. Reflectors and Lights
- 2.5. Protective Glasses
- 2.6. Mirrors
- 2.7. Others
Bicycle Safety Gear Segmentation By Geography
-
1. North America
- 1.1. United States
- 1.2. Canada
- 1.3. Mexico
-
2. South America
- 2.1. Brazil
- 2.2. Argentina
- 2.3. Rest of South America
-
3. Europe
- 3.1. United Kingdom
- 3.2. Germany
- 3.3. France
- 3.4. Italy
- 3.5. Spain
- 3.6. Russia
- 3.7. Benelux
- 3.8. Nordics
- 3.9. Rest of Europe
-
4. Middle East & Africa
- 4.1. Turkey
- 4.2. Israel
- 4.3. GCC
- 4.4. North Africa
- 4.5. South Africa
- 4.6. Rest of Middle East & Africa
-
5. Asia Pacific
- 5.1. China
- 5.2. India
- 5.3. Japan
- 5.4. South Korea
- 5.5. ASEAN
- 5.6. Oceania
- 5.7. Rest of Asia Pacific

Bicycle Safety Gear REPORT HIGHLIGHTS
| Aspects | Details |
|---|---|
| Study Period | 2019-2033 |
| Base Year | 2024 |
| Estimated Year | 2025 |
| Forecast Period | 2025-2033 |
| Historical Period | 2019-2024 |
| Growth Rate | CAGR of XX% from 2019-2033 |
| Segmentation |
|
Table of Contents
- 1. Introduction
- 1.1. Research Scope
- 1.2. Market Segmentation
- 1.3. Research Methodology
- 1.4. Definitions and Assumptions
- 2. Executive Summary
- 2.1. Introduction
- 3. Market Dynamics
- 3.1. Introduction
- 3.2. Market Drivers
- 3.3. Market Restrains
- 3.4. Market Trends
- 4. Market Factor Analysis
- 4.1. Porters Five Forces
- 4.2. Supply/Value Chain
- 4.3. PESTEL analysis
- 4.4. Market Entropy
- 4.5. Patent/Trademark Analysis
- 5. Global Bicycle Safety Gear Analysis, Insights and Forecast, 2019-2031
- 5.1. Market Analysis, Insights and Forecast - by Application
- 5.1.1. Online Stores
- 5.1.2. Hypermarkets/Supermarkets
- 5.1.3. Multi-Brand Stores
- 5.1.4. Specialty Stores
- 5.1.5. Independent Small Stores
- 5.1.6. Others
- 5.2. Market Analysis, Insights and Forecast - by Types
- 5.2.1. Helmet
- 5.2.2. Mouth Guard
- 5.2.3. Gloves
- 5.2.4. Reflectors and Lights
- 5.2.5. Protective Glasses
- 5.2.6. Mirrors
- 5.2.7. Others
- 5.3. Market Analysis, Insights and Forecast - by Region
- 5.3.1. North America
- 5.3.2. South America
- 5.3.3. Europe
- 5.3.4. Middle East & Africa
- 5.3.5. Asia Pacific
- 5.1. Market Analysis, Insights and Forecast - by Application
- 6. North America Bicycle Safety Gear Analysis, Insights and Forecast, 2019-2031
- 6.1. Market Analysis, Insights and Forecast - by Application
- 6.1.1. Online Stores
- 6.1.2. Hypermarkets/Supermarkets
- 6.1.3. Multi-Brand Stores
- 6.1.4. Specialty Stores
- 6.1.5. Independent Small Stores
- 6.1.6. Others
- 6.2. Market Analysis, Insights and Forecast - by Types
- 6.2.1. Helmet
- 6.2.2. Mouth Guard
- 6.2.3. Gloves
- 6.2.4. Reflectors and Lights
- 6.2.5. Protective Glasses
- 6.2.6. Mirrors
- 6.2.7. Others
- 6.1. Market Analysis, Insights and Forecast - by Application
- 7. South America Bicycle Safety Gear Analysis, Insights and Forecast, 2019-2031
- 7.1. Market Analysis, Insights and Forecast - by Application
- 7.1.1. Online Stores
- 7.1.2. Hypermarkets/Supermarkets
- 7.1.3. Multi-Brand Stores
- 7.1.4. Specialty Stores
- 7.1.5. Independent Small Stores
- 7.1.6. Others
- 7.2. Market Analysis, Insights and Forecast - by Types
- 7.2.1. Helmet
- 7.2.2. Mouth Guard
- 7.2.3. Gloves
- 7.2.4. Reflectors and Lights
- 7.2.5. Protective Glasses
- 7.2.6. Mirrors
- 7.2.7. Others
- 7.1. Market Analysis, Insights and Forecast - by Application
- 8. Europe Bicycle Safety Gear Analysis, Insights and Forecast, 2019-2031
- 8.1. Market Analysis, Insights and Forecast - by Application
- 8.1.1. Online Stores
- 8.1.2. Hypermarkets/Supermarkets
- 8.1.3. Multi-Brand Stores
- 8.1.4. Specialty Stores
- 8.1.5. Independent Small Stores
- 8.1.6. Others
- 8.2. Market Analysis, Insights and Forecast - by Types
- 8.2.1. Helmet
- 8.2.2. Mouth Guard
- 8.2.3. Gloves
- 8.2.4. Reflectors and Lights
- 8.2.5. Protective Glasses
- 8.2.6. Mirrors
- 8.2.7. Others
- 8.1. Market Analysis, Insights and Forecast - by Application
- 9. Middle East & Africa Bicycle Safety Gear Analysis, Insights and Forecast, 2019-2031
- 9.1. Market Analysis, Insights and Forecast - by Application
- 9.1.1. Online Stores
- 9.1.2. Hypermarkets/Supermarkets
- 9.1.3. Multi-Brand Stores
- 9.1.4. Specialty Stores
- 9.1.5. Independent Small Stores
- 9.1.6. Others
- 9.2. Market Analysis, Insights and Forecast - by Types
- 9.2.1. Helmet
- 9.2.2. Mouth Guard
- 9.2.3. Gloves
- 9.2.4. Reflectors and Lights
- 9.2.5. Protective Glasses
- 9.2.6. Mirrors
- 9.2.7. Others
- 9.1. Market Analysis, Insights and Forecast - by Application
- 10. Asia Pacific Bicycle Safety Gear Analysis, Insights and Forecast, 2019-2031
- 10.1. Market Analysis, Insights and Forecast - by Application
- 10.1.1. Online Stores
- 10.1.2. Hypermarkets/Supermarkets
- 10.1.3. Multi-Brand Stores
- 10.1.4. Specialty Stores
- 10.1.5. Independent Small Stores
- 10.1.6. Others
- 10.2. Market Analysis, Insights and Forecast - by Types
- 10.2.1. Helmet
- 10.2.2. Mouth Guard
- 10.2.3. Gloves
- 10.2.4. Reflectors and Lights
- 10.2.5. Protective Glasses
- 10.2.6. Mirrors
- 10.2.7. Others
- 10.1. Market Analysis, Insights and Forecast - by Application
- 11. Competitive Analysis
- 11.1. Global Market Share Analysis 2024
- 11.2. Company Profiles
- 11.2.1 Vista Outdoor
- 11.2.1.1. Overview
- 11.2.1.2. Products
- 11.2.1.3. SWOT Analysis
- 11.2.1.4. Recent Developments
- 11.2.1.5. Financials (Based on Availability)
- 11.2.2 Dorel
- 11.2.2.1. Overview
- 11.2.2.2. Products
- 11.2.2.3. SWOT Analysis
- 11.2.2.4. Recent Developments
- 11.2.2.5. Financials (Based on Availability)
- 11.2.3 Giant
- 11.2.3.1. Overview
- 11.2.3.2. Products
- 11.2.3.3. SWOT Analysis
- 11.2.3.4. Recent Developments
- 11.2.3.5. Financials (Based on Availability)
- 11.2.4 Trek Bicycle
- 11.2.4.1. Overview
- 11.2.4.2. Products
- 11.2.4.3. SWOT Analysis
- 11.2.4.4. Recent Developments
- 11.2.4.5. Financials (Based on Availability)
- 11.2.5 KASK
- 11.2.5.1. Overview
- 11.2.5.2. Products
- 11.2.5.3. SWOT Analysis
- 11.2.5.4. Recent Developments
- 11.2.5.5. Financials (Based on Availability)
- 11.2.6 Mavic
- 11.2.6.1. Overview
- 11.2.6.2. Products
- 11.2.6.3. SWOT Analysis
- 11.2.6.4. Recent Developments
- 11.2.6.5. Financials (Based on Availability)
- 11.2.7 Merida
- 11.2.7.1. Overview
- 11.2.7.2. Products
- 11.2.7.3. SWOT Analysis
- 11.2.7.4. Recent Developments
- 11.2.7.5. Financials (Based on Availability)
- 11.2.8 Specialized
- 11.2.8.1. Overview
- 11.2.8.2. Products
- 11.2.8.3. SWOT Analysis
- 11.2.8.4. Recent Developments
- 11.2.8.5. Financials (Based on Availability)
- 11.2.9 Uvex
- 11.2.9.1. Overview
- 11.2.9.2. Products
- 11.2.9.3. SWOT Analysis
- 11.2.9.4. Recent Developments
- 11.2.9.5. Financials (Based on Availability)
- 11.2.10 Scott Sports
- 11.2.10.1. Overview
- 11.2.10.2. Products
- 11.2.10.3. SWOT Analysis
- 11.2.10.4. Recent Developments
- 11.2.10.5. Financials (Based on Availability)
- 11.2.11 OGK KABUTO
- 11.2.11.1. Overview
- 11.2.11.2. Products
- 11.2.11.3. SWOT Analysis
- 11.2.11.4. Recent Developments
- 11.2.11.5. Financials (Based on Availability)
- 11.2.12 MET
- 11.2.12.1. Overview
- 11.2.12.2. Products
- 11.2.12.3. SWOT Analysis
- 11.2.12.4. Recent Developments
- 11.2.12.5. Financials (Based on Availability)
- 11.2.13 ABUS
- 11.2.13.1. Overview
- 11.2.13.2. Products
- 11.2.13.3. SWOT Analysis
- 11.2.13.4. Recent Developments
- 11.2.13.5. Financials (Based on Availability)
- 11.2.14 SenHai Sports Goods
- 11.2.14.1. Overview
- 11.2.14.2. Products
- 11.2.14.3. SWOT Analysis
- 11.2.14.4. Recent Developments
- 11.2.14.5. Financials (Based on Availability)
- 11.2.15 Strategic Sports
- 11.2.15.1. Overview
- 11.2.15.2. Products
- 11.2.15.3. SWOT Analysis
- 11.2.15.4. Recent Developments
- 11.2.15.5. Financials (Based on Availability)
- 11.2.16 Orbea
- 11.2.16.1. Overview
- 11.2.16.2. Products
- 11.2.16.3. SWOT Analysis
- 11.2.16.4. Recent Developments
- 11.2.16.5. Financials (Based on Availability)
- 11.2.17 Rudy Project
- 11.2.17.1. Overview
- 11.2.17.2. Products
- 11.2.17.3. SWOT Analysis
- 11.2.17.4. Recent Developments
- 11.2.17.5. Financials (Based on Availability)
- 11.2.18 GUB
- 11.2.18.1. Overview
- 11.2.18.2. Products
- 11.2.18.3. SWOT Analysis
- 11.2.18.4. Recent Developments
- 11.2.18.5. Financials (Based on Availability)
- 11.2.19 One Industries
- 11.2.19.1. Overview
- 11.2.19.2. Products
- 11.2.19.3. SWOT Analysis
- 11.2.19.4. Recent Developments
- 11.2.19.5. Financials (Based on Availability)
- 11.2.20 CatEye
- 11.2.20.1. Overview
- 11.2.20.2. Products
- 11.2.20.3. SWOT Analysis
- 11.2.20.4. Recent Developments
- 11.2.20.5. Financials (Based on Availability)
- 11.2.21 SIGMA SPORT
- 11.2.21.1. Overview
- 11.2.21.2. Products
- 11.2.21.3. SWOT Analysis
- 11.2.21.4. Recent Developments
- 11.2.21.5. Financials (Based on Availability)
- 11.2.22 Serfas
- 11.2.22.1. Overview
- 11.2.22.2. Products
- 11.2.22.3. SWOT Analysis
- 11.2.22.4. Recent Developments
- 11.2.22.5. Financials (Based on Availability)
- 11.2.23 Knog
- 11.2.23.1. Overview
- 11.2.23.2. Products
- 11.2.23.3. SWOT Analysis
- 11.2.23.4. Recent Developments
- 11.2.23.5. Financials (Based on Availability)
- 11.2.24 Exposure Lights
- 11.2.24.1. Overview
- 11.2.24.2. Products
- 11.2.24.3. SWOT Analysis
- 11.2.24.4. Recent Developments
- 11.2.24.5. Financials (Based on Availability)
- 11.2.25 Topeak
- 11.2.25.1. Overview
- 11.2.25.2. Products
- 11.2.25.3. SWOT Analysis
- 11.2.25.4. Recent Developments
- 11.2.25.5. Financials (Based on Availability)
- 11.2.26 Planet Bike
- 11.2.26.1. Overview
- 11.2.26.2. Products
- 11.2.26.3. SWOT Analysis
- 11.2.26.4. Recent Developments
- 11.2.26.5. Financials (Based on Availability)
- 11.2.27 NiteRider
- 11.2.27.1. Overview
- 11.2.27.2. Products
- 11.2.27.3. SWOT Analysis
- 11.2.27.4. Recent Developments
- 11.2.27.5. Financials (Based on Availability)
- 11.2.28 Magicshine
- 11.2.28.1. Overview
- 11.2.28.2. Products
- 11.2.28.3. SWOT Analysis
- 11.2.28.4. Recent Developments
- 11.2.28.5. Financials (Based on Availability)
- 11.2.29 BBB Cycling
- 11.2.29.1. Overview
- 11.2.29.2. Products
- 11.2.29.3. SWOT Analysis
- 11.2.29.4. Recent Developments
- 11.2.29.5. Financials (Based on Availability)
- 11.2.30 Ferei
- 11.2.30.1. Overview
- 11.2.30.2. Products
- 11.2.30.3. SWOT Analysis
- 11.2.30.4. Recent Developments
- 11.2.30.5. Financials (Based on Availability)
- 11.2.1 Vista Outdoor
List of Figures
- Figure 1: Global Bicycle Safety Gear Revenue Breakdown (million, %) by Region 2024 & 2032
- Figure 2: Global Bicycle Safety Gear Volume Breakdown (K, %) by Region 2024 & 2032
- Figure 3: North America Bicycle Safety Gear Revenue (million), by Application 2024 & 2032
- Figure 4: North America Bicycle Safety Gear Volume (K), by Application 2024 & 2032
- Figure 5: North America Bicycle Safety Gear Revenue Share (%), by Application 2024 & 2032
- Figure 6: North America Bicycle Safety Gear Volume Share (%), by Application 2024 & 2032
- Figure 7: North America Bicycle Safety Gear Revenue (million), by Types 2024 & 2032
- Figure 8: North America Bicycle Safety Gear Volume (K), by Types 2024 & 2032
- Figure 9: North America Bicycle Safety Gear Revenue Share (%), by Types 2024 & 2032
- Figure 10: North America Bicycle Safety Gear Volume Share (%), by Types 2024 & 2032
- Figure 11: North America Bicycle Safety Gear Revenue (million), by Country 2024 & 2032
- Figure 12: North America Bicycle Safety Gear Volume (K), by Country 2024 & 2032
- Figure 13: North America Bicycle Safety Gear Revenue Share (%), by Country 2024 & 2032
- Figure 14: North America Bicycle Safety Gear Volume Share (%), by Country 2024 & 2032
- Figure 15: South America Bicycle Safety Gear Revenue (million), by Application 2024 & 2032
- Figure 16: South America Bicycle Safety Gear Volume (K), by Application 2024 & 2032
- Figure 17: South America Bicycle Safety Gear Revenue Share (%), by Application 2024 & 2032
- Figure 18: South America Bicycle Safety Gear Volume Share (%), by Application 2024 & 2032
- Figure 19: South America Bicycle Safety Gear Revenue (million), by Types 2024 & 2032
- Figure 20: South America Bicycle Safety Gear Volume (K), by Types 2024 & 2032
- Figure 21: South America Bicycle Safety Gear Revenue Share (%), by Types 2024 & 2032
- Figure 22: South America Bicycle Safety Gear Volume Share (%), by Types 2024 & 2032
- Figure 23: South America Bicycle Safety Gear Revenue (million), by Country 2024 & 2032
- Figure 24: South America Bicycle Safety Gear Volume (K), by Country 2024 & 2032
- Figure 25: South America Bicycle Safety Gear Revenue Share (%), by Country 2024 & 2032
- Figure 26: South America Bicycle Safety Gear Volume Share (%), by Country 2024 & 2032
- Figure 27: Europe Bicycle Safety Gear Revenue (million), by Application 2024 & 2032
- Figure 28: Europe Bicycle Safety Gear Volume (K), by Application 2024 & 2032
- Figure 29: Europe Bicycle Safety Gear Revenue Share (%), by Application 2024 & 2032
- Figure 30: Europe Bicycle Safety Gear Volume Share (%), by Application 2024 & 2032
- Figure 31: Europe Bicycle Safety Gear Revenue (million), by Types 2024 & 2032
- Figure 32: Europe Bicycle Safety Gear Volume (K), by Types 2024 & 2032
- Figure 33: Europe Bicycle Safety Gear Revenue Share (%), by Types 2024 & 2032
- Figure 34: Europe Bicycle Safety Gear Volume Share (%), by Types 2024 & 2032
- Figure 35: Europe Bicycle Safety Gear Revenue (million), by Country 2024 & 2032
- Figure 36: Europe Bicycle Safety Gear Volume (K), by Country 2024 & 2032
- Figure 37: Europe Bicycle Safety Gear Revenue Share (%), by Country 2024 & 2032
- Figure 38: Europe Bicycle Safety Gear Volume Share (%), by Country 2024 & 2032
- Figure 39: Middle East & Africa Bicycle Safety Gear Revenue (million), by Application 2024 & 2032
- Figure 40: Middle East & Africa Bicycle Safety Gear Volume (K), by Application 2024 & 2032
- Figure 41: Middle East & Africa Bicycle Safety Gear Revenue Share (%), by Application 2024 & 2032
- Figure 42: Middle East & Africa Bicycle Safety Gear Volume Share (%), by Application 2024 & 2032
- Figure 43: Middle East & Africa Bicycle Safety Gear Revenue (million), by Types 2024 & 2032
- Figure 44: Middle East & Africa Bicycle Safety Gear Volume (K), by Types 2024 & 2032
- Figure 45: Middle East & Africa Bicycle Safety Gear Revenue Share (%), by Types 2024 & 2032
- Figure 46: Middle East & Africa Bicycle Safety Gear Volume Share (%), by Types 2024 & 2032
- Figure 47: Middle East & Africa Bicycle Safety Gear Revenue (million), by Country 2024 & 2032
- Figure 48: Middle East & Africa Bicycle Safety Gear Volume (K), by Country 2024 & 2032
- Figure 49: Middle East & Africa Bicycle Safety Gear Revenue Share (%), by Country 2024 & 2032
- Figure 50: Middle East & Africa Bicycle Safety Gear Volume Share (%), by Country 2024 & 2032
- Figure 51: Asia Pacific Bicycle Safety Gear Revenue (million), by Application 2024 & 2032
- Figure 52: Asia Pacific Bicycle Safety Gear Volume (K), by Application 2024 & 2032
- Figure 53: Asia Pacific Bicycle Safety Gear Revenue Share (%), by Application 2024 & 2032
- Figure 54: Asia Pacific Bicycle Safety Gear Volume Share (%), by Application 2024 & 2032
- Figure 55: Asia Pacific Bicycle Safety Gear Revenue (million), by Types 2024 & 2032
- Figure 56: Asia Pacific Bicycle Safety Gear Volume (K), by Types 2024 & 2032
- Figure 57: Asia Pacific Bicycle Safety Gear Revenue Share (%), by Types 2024 & 2032
- Figure 58: Asia Pacific Bicycle Safety Gear Volume Share (%), by Types 2024 & 2032
- Figure 59: Asia Pacific Bicycle Safety Gear Revenue (million), by Country 2024 & 2032
- Figure 60: Asia Pacific Bicycle Safety Gear Volume (K), by Country 2024 & 2032
- Figure 61: Asia Pacific Bicycle Safety Gear Revenue Share (%), by Country 2024 & 2032
- Figure 62: Asia Pacific Bicycle Safety Gear Volume Share (%), by Country 2024 & 2032
List of Tables
- Table 1: Global Bicycle Safety Gear Revenue million Forecast, by Region 2019 & 2032
- Table 2: Global Bicycle Safety Gear Volume K Forecast, by Region 2019 & 2032
- Table 3: Global Bicycle Safety Gear Revenue million Forecast, by Application 2019 & 2032
- Table 4: Global Bicycle Safety Gear Volume K Forecast, by Application 2019 & 2032
- Table 5: Global Bicycle Safety Gear Revenue million Forecast, by Types 2019 & 2032
- Table 6: Global Bicycle Safety Gear Volume K Forecast, by Types 2019 & 2032
- Table 7: Global Bicycle Safety Gear Revenue million Forecast, by Region 2019 & 2032
- Table 8: Global Bicycle Safety Gear Volume K Forecast, by Region 2019 & 2032
- Table 9: Global Bicycle Safety Gear Revenue million Forecast, by Application 2019 & 2032
- Table 10: Global Bicycle Safety Gear Volume K Forecast, by Application 2019 & 2032
- Table 11: Global Bicycle Safety Gear Revenue million Forecast, by Types 2019 & 2032
- Table 12: Global Bicycle Safety Gear Volume K Forecast, by Types 2019 & 2032
- Table 13: Global Bicycle Safety Gear Revenue million Forecast, by Country 2019 & 2032
- Table 14: Global Bicycle Safety Gear Volume K Forecast, by Country 2019 & 2032
- Table 15: United States Bicycle Safety Gear Revenue (million) Forecast, by Application 2019 & 2032
- Table 16: United States Bicycle Safety Gear Volume (K) Forecast, by Application 2019 & 2032
- Table 17: Canada Bicycle Safety Gear Revenue (million) Forecast, by Application 2019 & 2032
- Table 18: Canada Bicycle Safety Gear Volume (K) Forecast, by Application 2019 & 2032
- Table 19: Mexico Bicycle Safety Gear Revenue (million) Forecast, by Application 2019 & 2032
- Table 20: Mexico Bicycle Safety Gear Volume (K) Forecast, by Application 2019 & 2032
- Table 21: Global Bicycle Safety Gear Revenue million Forecast, by Application 2019 & 2032
- Table 22: Global Bicycle Safety Gear Volume K Forecast, by Application 2019 & 2032
- Table 23: Global Bicycle Safety Gear Revenue million Forecast, by Types 2019 & 2032
- Table 24: Global Bicycle Safety Gear Volume K Forecast, by Types 2019 & 2032
- Table 25: Global Bicycle Safety Gear Revenue million Forecast, by Country 2019 & 2032
- Table 26: Global Bicycle Safety Gear Volume K Forecast, by Country 2019 & 2032
- Table 27: Brazil Bicycle Safety Gear Revenue (million) Forecast, by Application 2019 & 2032
- Table 28: Brazil Bicycle Safety Gear Volume (K) Forecast, by Application 2019 & 2032
- Table 29: Argentina Bicycle Safety Gear Revenue (million) Forecast, by Application 2019 & 2032
- Table 30: Argentina Bicycle Safety Gear Volume (K) Forecast, by Application 2019 & 2032
- Table 31: Rest of South America Bicycle Safety Gear Revenue (million) Forecast, by Application 2019 & 2032
- Table 32: Rest of South America Bicycle Safety Gear Volume (K) Forecast, by Application 2019 & 2032
- Table 33: Global Bicycle Safety Gear Revenue million Forecast, by Application 2019 & 2032
- Table 34: Global Bicycle Safety Gear Volume K Forecast, by Application 2019 & 2032
- Table 35: Global Bicycle Safety Gear Revenue million Forecast, by Types 2019 & 2032
- Table 36: Global Bicycle Safety Gear Volume K Forecast, by Types 2019 & 2032
- Table 37: Global Bicycle Safety Gear Revenue million Forecast, by Country 2019 & 2032
- Table 38: Global Bicycle Safety Gear Volume K Forecast, by Country 2019 & 2032
- Table 39: United Kingdom Bicycle Safety Gear Revenue (million) Forecast, by Application 2019 & 2032
- Table 40: United Kingdom Bicycle Safety Gear Volume (K) Forecast, by Application 2019 & 2032
- Table 41: Germany Bicycle Safety Gear Revenue (million) Forecast, by Application 2019 & 2032
- Table 42: Germany Bicycle Safety Gear Volume (K) Forecast, by Application 2019 & 2032
- Table 43: France Bicycle Safety Gear Revenue (million) Forecast, by Application 2019 & 2032
- Table 44: France Bicycle Safety Gear Volume (K) Forecast, by Application 2019 & 2032
- Table 45: Italy Bicycle Safety Gear Revenue (million) Forecast, by Application 2019 & 2032
- Table 46: Italy Bicycle Safety Gear Volume (K) Forecast, by Application 2019 & 2032
- Table 47: Spain Bicycle Safety Gear Revenue (million) Forecast, by Application 2019 & 2032
- Table 48: Spain Bicycle Safety Gear Volume (K) Forecast, by Application 2019 & 2032
- Table 49: Russia Bicycle Safety Gear Revenue (million) Forecast, by Application 2019 & 2032
- Table 50: Russia Bicycle Safety Gear Volume (K) Forecast, by Application 2019 & 2032
- Table 51: Benelux Bicycle Safety Gear Revenue (million) Forecast, by Application 2019 & 2032
- Table 52: Benelux Bicycle Safety Gear Volume (K) Forecast, by Application 2019 & 2032
- Table 53: Nordics Bicycle Safety Gear Revenue (million) Forecast, by Application 2019 & 2032
- Table 54: Nordics Bicycle Safety Gear Volume (K) Forecast, by Application 2019 & 2032
- Table 55: Rest of Europe Bicycle Safety Gear Revenue (million) Forecast, by Application 2019 & 2032
- Table 56: Rest of Europe Bicycle Safety Gear Volume (K) Forecast, by Application 2019 & 2032
- Table 57: Global Bicycle Safety Gear Revenue million Forecast, by Application 2019 & 2032
- Table 58: Global Bicycle Safety Gear Volume K Forecast, by Application 2019 & 2032
- Table 59: Global Bicycle Safety Gear Revenue million Forecast, by Types 2019 & 2032
- Table 60: Global Bicycle Safety Gear Volume K Forecast, by Types 2019 & 2032
- Table 61: Global Bicycle Safety Gear Revenue million Forecast, by Country 2019 & 2032
- Table 62: Global Bicycle Safety Gear Volume K Forecast, by Country 2019 & 2032
- Table 63: Turkey Bicycle Safety Gear Revenue (million) Forecast, by Application 2019 & 2032
- Table 64: Turkey Bicycle Safety Gear Volume (K) Forecast, by Application 2019 & 2032
- Table 65: Israel Bicycle Safety Gear Revenue (million) Forecast, by Application 2019 & 2032
- Table 66: Israel Bicycle Safety Gear Volume (K) Forecast, by Application 2019 & 2032
- Table 67: GCC Bicycle Safety Gear Revenue (million) Forecast, by Application 2019 & 2032
- Table 68: GCC Bicycle Safety Gear Volume (K) Forecast, by Application 2019 & 2032
- Table 69: North Africa Bicycle Safety Gear Revenue (million) Forecast, by Application 2019 & 2032
- Table 70: North Africa Bicycle Safety Gear Volume (K) Forecast, by Application 2019 & 2032
- Table 71: South Africa Bicycle Safety Gear Revenue (million) Forecast, by Application 2019 & 2032
- Table 72: South Africa Bicycle Safety Gear Volume (K) Forecast, by Application 2019 & 2032
- Table 73: Rest of Middle East & Africa Bicycle Safety Gear Revenue (million) Forecast, by Application 2019 & 2032
- Table 74: Rest of Middle East & Africa Bicycle Safety Gear Volume (K) Forecast, by Application 2019 & 2032
- Table 75: Global Bicycle Safety Gear Revenue million Forecast, by Application 2019 & 2032
- Table 76: Global Bicycle Safety Gear Volume K Forecast, by Application 2019 & 2032
- Table 77: Global Bicycle Safety Gear Revenue million Forecast, by Types 2019 & 2032
- Table 78: Global Bicycle Safety Gear Volume K Forecast, by Types 2019 & 2032
- Table 79: Global Bicycle Safety Gear Revenue million Forecast, by Country 2019 & 2032
- Table 80: Global Bicycle Safety Gear Volume K Forecast, by Country 2019 & 2032
- Table 81: China Bicycle Safety Gear Revenue (million) Forecast, by Application 2019 & 2032
- Table 82: China Bicycle Safety Gear Volume (K) Forecast, by Application 2019 & 2032
- Table 83: India Bicycle Safety Gear Revenue (million) Forecast, by Application 2019 & 2032
- Table 84: India Bicycle Safety Gear Volume (K) Forecast, by Application 2019 & 2032
- Table 85: Japan Bicycle Safety Gear Revenue (million) Forecast, by Application 2019 & 2032
- Table 86: Japan Bicycle Safety Gear Volume (K) Forecast, by Application 2019 & 2032
- Table 87: South Korea Bicycle Safety Gear Revenue (million) Forecast, by Application 2019 & 2032
- Table 88: South Korea Bicycle Safety Gear Volume (K) Forecast, by Application 2019 & 2032
- Table 89: ASEAN Bicycle Safety Gear Revenue (million) Forecast, by Application 2019 & 2032
- Table 90: ASEAN Bicycle Safety Gear Volume (K) Forecast, by Application 2019 & 2032
- Table 91: Oceania Bicycle Safety Gear Revenue (million) Forecast, by Application 2019 & 2032
- Table 92: Oceania Bicycle Safety Gear Volume (K) Forecast, by Application 2019 & 2032
- Table 93: Rest of Asia Pacific Bicycle Safety Gear Revenue (million) Forecast, by Application 2019 & 2032
- Table 94: Rest of Asia Pacific Bicycle Safety Gear Volume (K) Forecast, by Application 2019 & 2032
Frequently Asked Questions
1. What is the projected Compound Annual Growth Rate (CAGR) of the Bicycle Safety Gear?
The projected CAGR is approximately XX%.
2. Which companies are prominent players in the Bicycle Safety Gear?
Key companies in the market include Vista Outdoor, Dorel, Giant, Trek Bicycle, KASK, Mavic, Merida, Specialized, Uvex, Scott Sports, OGK KABUTO, MET, ABUS, SenHai Sports Goods, Strategic Sports, Orbea, Rudy Project, GUB, One Industries, CatEye, SIGMA SPORT, Serfas, Knog, Exposure Lights, Topeak, Planet Bike, NiteRider, Magicshine, BBB Cycling, Ferei.
3. What are the main segments of the Bicycle Safety Gear?
The market segments include Application, Types.
4. Can you provide details about the market size?
The market size is estimated to be USD XXX million as of 2022.
5. What are some drivers contributing to market growth?
N/A
6. What are the notable trends driving market growth?
N/A
7. Are there any restraints impacting market growth?
N/A
8. Can you provide examples of recent developments in the market?
N/A
9. What pricing options are available for accessing the report?
Pricing options include single-user, multi-user, and enterprise licenses priced at USD 3950.00, USD 5925.00, and USD 7900.00 respectively.
10. Is the market size provided in terms of value or volume?
The market size is provided in terms of value, measured in million and volume, measured in K.
11. Are there any specific market keywords associated with the report?
Yes, the market keyword associated with the report is "Bicycle Safety Gear," which aids in identifying and referencing the specific market segment covered.
12. How do I determine which pricing option suits my needs best?
The pricing options vary based on user requirements and access needs. Individual users may opt for single-user licenses, while businesses requiring broader access may choose multi-user or enterprise licenses for cost-effective access to the report.
13. Are there any additional resources or data provided in the Bicycle Safety Gear report?
While the report offers comprehensive insights, it's advisable to review the specific contents or supplementary materials provided to ascertain if additional resources or data are available.
14. How can I stay updated on further developments or reports in the Bicycle Safety Gear?
To stay informed about further developments, trends, and reports in the Bicycle Safety Gear, consider subscribing to industry newsletters, following relevant companies and organizations, or regularly checking reputable industry news sources and publications.
Methodology
Step 1 - Identification of Relevant Samples Size from Population Database


Step 2 - Approaches for Defining Global Market Size (Value, Volume* & Price*)

Note*: In applicable scenarios
Step 3 - Data Sources
Primary Research
- Web Analytics
- Survey Reports
- Research Institute
- Latest Research Reports
- Opinion Leaders
Secondary Research
- Annual Reports
- White Paper
- Latest Press Release
- Industry Association
- Paid Database
- Investor Presentations

Step 4 - Data Triangulation
Involves using different sources of information in order to increase the validity of a study
These sources are likely to be stakeholders in a program - participants, other researchers, program staff, other community members, and so on.
Then we put all data in single framework & apply various statistical tools to find out the dynamic on the market.
During the analysis stage, feedback from the stakeholder groups would be compared to determine areas of agreement as well as areas of divergence
