

Key Insights
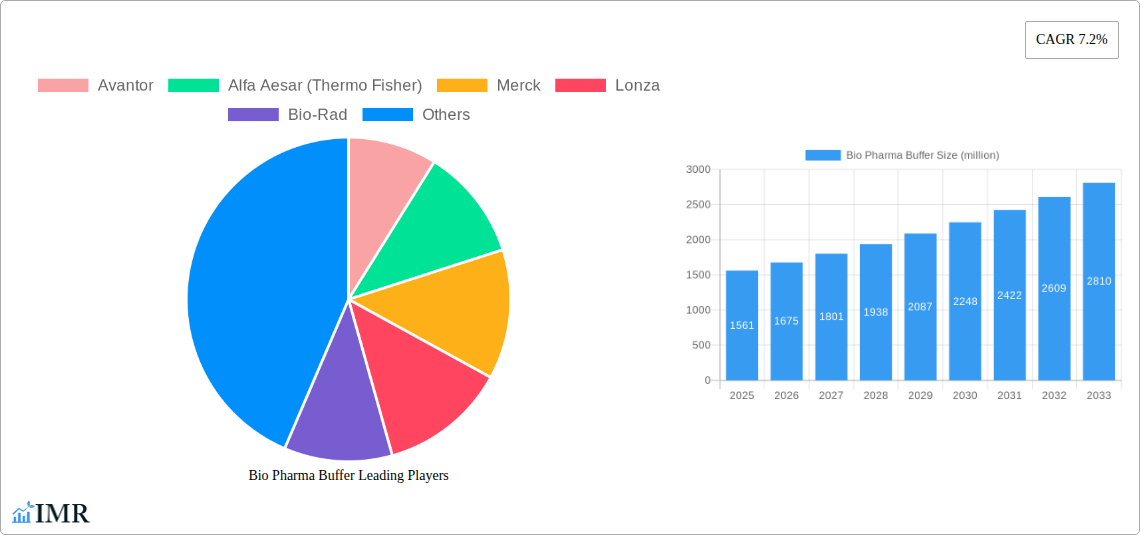
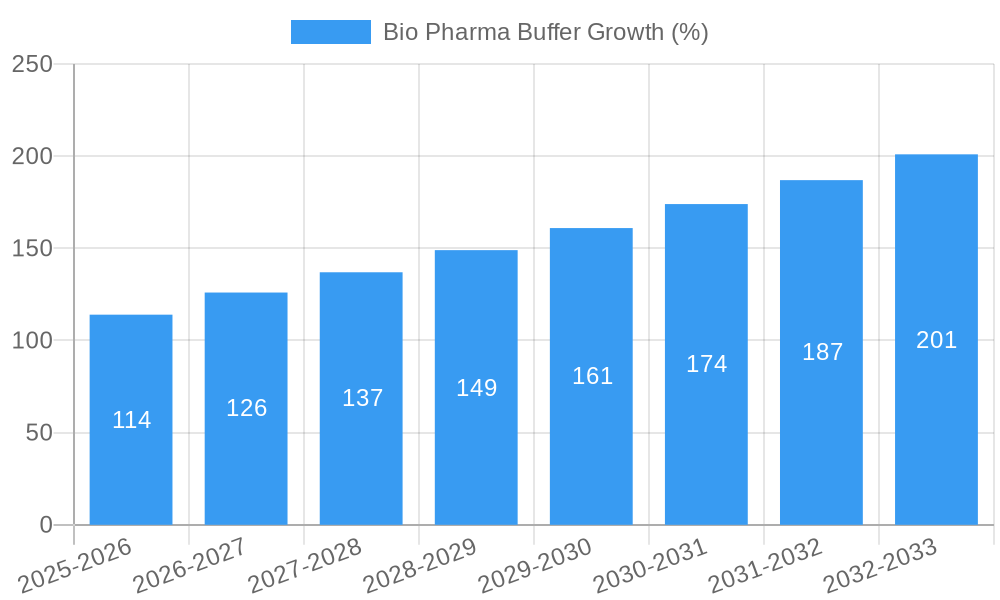
The biopharmaceutical buffer market, valued at $1561 million in 2025, is projected to experience robust growth, driven by the expanding biopharmaceutical industry and increasing demand for high-quality buffers in drug development and manufacturing. A compound annual growth rate (CAGR) of 7.2% from 2025 to 2033 indicates a significant market expansion, reaching an estimated value exceeding $3000 million by 2033. This growth is fueled by several key factors. Firstly, the rising prevalence of chronic diseases globally is increasing the demand for biologics, leading to a higher need for buffers in their production. Secondly, advancements in biotechnology and the development of novel therapeutic modalities, such as cell and gene therapies, are creating new applications for specialized buffers. Finally, stringent regulatory requirements for buffer quality and consistency are pushing manufacturers to adopt more sophisticated and high-quality products. The market is segmented by type (e.g., phosphate buffers, Tris buffers, etc.), application (e.g., cell culture, protein purification, formulation), and end-user (e.g., pharmaceutical companies, contract research organizations). Competitive landscape analysis reveals key players like Avantor, Thermo Fisher Scientific, Merck, Lonza, and others actively contributing to innovation and market expansion through strategic partnerships and product development.
The competitive landscape is characterized by both large multinational corporations and specialized manufacturers, each offering a range of products tailored to specific applications. The market is witnessing increased consolidation through mergers and acquisitions, as companies strive to broaden their product portfolios and expand their geographic reach. Despite the optimistic growth projections, challenges remain. Price fluctuations in raw materials and increasing regulatory hurdles can impact profitability. However, the long-term outlook for the biopharmaceutical buffer market remains positive, driven by the sustained growth in the biopharmaceutical industry and continued advancements in biotechnology. The market's future will likely be shaped by the development of innovative buffer technologies, focusing on improved performance, reduced costs, and enhanced sustainability.
Bio Pharma Buffer Market Report: 2019-2033
This comprehensive report provides an in-depth analysis of the Bio Pharma Buffer market, encompassing market dynamics, growth trends, regional dominance, product landscape, key players, and future outlook. The study period covers 2019-2033, with 2025 as the base and estimated year. The report caters to industry professionals, investors, and researchers seeking a detailed understanding of this crucial segment within the broader pharmaceutical and biotechnology industries (parent market). The child market focuses specifically on buffers used in biopharmaceutical manufacturing processes. Market size is presented in million units.
Bio Pharma Buffer Market Dynamics & Structure
The Bio Pharma Buffer market exhibits a moderately concentrated structure, with key players like Avantor, Alfa Aesar (Thermo Fisher), Merck, and Lonza holding significant market share (estimated at xx% collectively in 2025). Technological innovation, driven by the demand for higher purity and specialized buffers, is a primary growth driver. Stringent regulatory frameworks, particularly concerning GMP compliance, shape manufacturing practices and product development. Competitive substitutes, such as alternative buffering agents, present a challenge, though the prevalence of established buffers limits their impact. End-users include biopharmaceutical manufacturers (large and small), research institutions, and contract research organizations (CROs). M&A activity has been moderate in recent years, with xx major deals recorded between 2019 and 2024, primarily focusing on expanding product portfolios and geographic reach.
- Market Concentration: Moderately concentrated, with top 4 players holding xx% market share in 2025.
- Technological Innovation: Driven by demand for higher purity and specialized buffers for advanced therapies.
- Regulatory Landscape: Stringent GMP compliance significantly impacts manufacturing and product development.
- Competitive Substitutes: Limited impact due to the established nature of current buffer solutions.
- M&A Activity: xx major deals between 2019-2024, focused on portfolio expansion and geographic reach.
- Innovation Barriers: High regulatory hurdles and stringent quality control requirements.
Bio Pharma Buffer Growth Trends & Insights
The Bio Pharma Buffer market experienced robust growth during the historical period (2019-2024), with a CAGR of xx%. This growth is attributed to the rising demand for biologics and the expansion of the biopharmaceutical industry globally. Adoption rates of specialized buffers, particularly those used in cell culture and protein purification, have increased significantly. Technological disruptions, such as the introduction of novel buffer formulations and automated dispensing systems, are further accelerating market expansion. Consumer behavior shifts towards more efficient and cost-effective buffer solutions are also influencing market dynamics. The market is projected to maintain a healthy CAGR of xx% during the forecast period (2025-2033), driven by the continued growth in the biopharmaceutical industry and advancements in bioprocessing technologies. Market penetration is estimated at xx% in 2025, projected to reach xx% by 2033.
Dominant Regions, Countries, or Segments in Bio Pharma Buffer
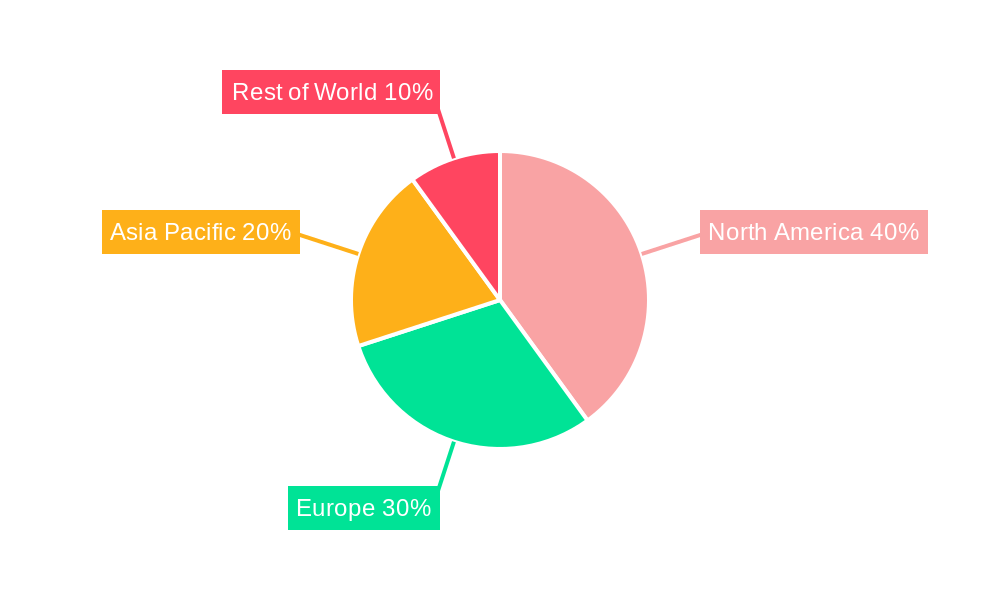
North America currently dominates the Bio Pharma Buffer market, driven by a large biopharmaceutical manufacturing base and robust research and development activities. Strong regulatory frameworks and advanced infrastructure contribute to the region's leadership. Europe follows closely, exhibiting significant growth potential owing to a growing biotech sector and supportive government policies. Asia-Pacific is expected to witness the fastest growth in the forecast period, propelled by rising healthcare expenditure, increasing pharmaceutical production, and growing demand for biologics in emerging economies.
- North America: Dominant market share due to robust biopharma industry and advanced infrastructure.
- Europe: Strong growth potential driven by expanding biotech sector and supportive government policies.
- Asia-Pacific: Fastest-growing region, fueled by rising healthcare expenditure and increasing biopharmaceutical production.
- Key Drivers: Government incentives for biopharmaceutical research, expanding healthcare infrastructure, increasing investment in R&D.
Bio Pharma Buffer Product Landscape
The Bio Pharma Buffer market encompasses a diverse range of products, including general-purpose buffers (phosphate-buffered saline, Tris buffers), specialized buffers for cell culture (e.g., chemically defined media), and customized buffer solutions tailored to specific bioprocessing needs. Innovations focus on improving buffer stability, reducing impurities, enhancing compatibility with various biomolecules, and developing environmentally friendly formulations. Key performance metrics include purity, buffering capacity, pH stability, and osmolality. Unique selling propositions often revolve around superior performance, reduced cost of goods, improved ease of use, or enhanced sustainability.
Key Drivers, Barriers & Challenges in Bio Pharma Buffer
Key Drivers: The burgeoning biopharmaceutical industry, advancements in bioprocessing technologies, and rising demand for biologics are the primary growth drivers. Government initiatives promoting biopharmaceutical research and development also contribute to market expansion.
Key Challenges: Stringent regulatory compliance, supply chain disruptions (particularly raw material shortages), and intense competition among established players pose significant challenges. The high cost of developing and validating new buffer formulations also acts as a barrier to entry.
Emerging Opportunities in Bio Pharma Buffer
Emerging opportunities lie in the development of novel buffer formulations for advanced therapies (e.g., cell and gene therapies), the increasing demand for customized buffer solutions catering to specialized bioprocessing needs, and the growth of contract manufacturing organizations (CMOs) requiring reliable buffer supplies. Expanding into emerging markets with increasing biopharmaceutical production also presents significant growth potential.
Growth Accelerators in the Bio Pharma Buffer Industry
Technological advancements in buffer formulation and manufacturing, strategic partnerships between buffer suppliers and biopharmaceutical companies, and expansion into untapped markets, particularly in emerging economies, are key growth accelerators. Continuous innovation in bioprocessing technologies, such as single-use systems, also contributes to increased demand for specialized buffers.
Key Players Shaping the Bio Pharma Buffer Market
- Avantor
- Alfa Aesar (Thermo Fisher)
- Merck
- Lonza
- Bio-Rad
- BD
- GE Healthcare
- Promega Corporation
- Hamilton Company
- XZL BIO-TECHNOLOGY
- SRL
Notable Milestones in Bio Pharma Buffer Sector
- 2020: Avantor launched a new line of high-purity buffers for cell culture applications.
- 2022: Merck acquired a specialized buffer manufacturer, expanding its product portfolio.
- 2023: Lonza announced a new facility dedicated to the production of customized buffer solutions.
In-Depth Bio Pharma Buffer Market Outlook
The Bio Pharma Buffer market is poised for continued strong growth, driven by the unrelenting expansion of the biopharmaceutical sector and the development of innovative bioprocessing techniques. Strategic partnerships, technological advancements, and market expansion strategies will be crucial for players to maintain competitiveness and capitalize on future opportunities. The rising demand for personalized medicine and advanced therapies will further fuel the demand for specialized and high-purity buffer solutions, presenting substantial growth potential for industry participants throughout the forecast period (2025-2033).
Bio Pharma Buffer Segmentation
-
1. Application
- 1.1. Research Institution
- 1.2. Pharmaceutical Industry
- 1.3. Others
-
2. Type
- 2.1. Phosphates Type
- 2.2. Acetates Type
- 2.3. TRIS Type
- 2.4. Others
Bio Pharma Buffer Segmentation By Geography
-
1. North America
- 1.1. United States
- 1.2. Canada
- 1.3. Mexico
-
2. South America
- 2.1. Brazil
- 2.2. Argentina
- 2.3. Rest of South America
-
3. Europe
- 3.1. United Kingdom
- 3.2. Germany
- 3.3. France
- 3.4. Italy
- 3.5. Spain
- 3.6. Russia
- 3.7. Benelux
- 3.8. Nordics
- 3.9. Rest of Europe
-
4. Middle East & Africa
- 4.1. Turkey
- 4.2. Israel
- 4.3. GCC
- 4.4. North Africa
- 4.5. South Africa
- 4.6. Rest of Middle East & Africa
-
5. Asia Pacific
- 5.1. China
- 5.2. India
- 5.3. Japan
- 5.4. South Korea
- 5.5. ASEAN
- 5.6. Oceania
- 5.7. Rest of Asia Pacific
Bio Pharma Buffer REPORT HIGHLIGHTS
| Aspects | Details |
|---|---|
| Study Period | 2019-2033 |
| Base Year | 2024 |
| Estimated Year | 2025 |
| Forecast Period | 2025-2033 |
| Historical Period | 2019-2024 |
| Growth Rate | CAGR of 7.2% from 2019-2033 |
| Segmentation |
|
Table of Contents
- 1. Introduction
- 1.1. Research Scope
- 1.2. Market Segmentation
- 1.3. Research Methodology
- 1.4. Definitions and Assumptions
- 2. Executive Summary
- 2.1. Introduction
- 3. Market Dynamics
- 3.1. Introduction
- 3.2. Market Drivers
- 3.3. Market Restrains
- 3.4. Market Trends
- 4. Market Factor Analysis
- 4.1. Porters Five Forces
- 4.2. Supply/Value Chain
- 4.3. PESTEL analysis
- 4.4. Market Entropy
- 4.5. Patent/Trademark Analysis
- 5. Global Bio Pharma Buffer Analysis, Insights and Forecast, 2019-2031
- 5.1. Market Analysis, Insights and Forecast - by Application
- 5.1.1. Research Institution
- 5.1.2. Pharmaceutical Industry
- 5.1.3. Others
- 5.2. Market Analysis, Insights and Forecast - by Type
- 5.2.1. Phosphates Type
- 5.2.2. Acetates Type
- 5.2.3. TRIS Type
- 5.2.4. Others
- 5.3. Market Analysis, Insights and Forecast - by Region
- 5.3.1. North America
- 5.3.2. South America
- 5.3.3. Europe
- 5.3.4. Middle East & Africa
- 5.3.5. Asia Pacific
- 5.1. Market Analysis, Insights and Forecast - by Application
- 6. North America Bio Pharma Buffer Analysis, Insights and Forecast, 2019-2031
- 6.1. Market Analysis, Insights and Forecast - by Application
- 6.1.1. Research Institution
- 6.1.2. Pharmaceutical Industry
- 6.1.3. Others
- 6.2. Market Analysis, Insights and Forecast - by Type
- 6.2.1. Phosphates Type
- 6.2.2. Acetates Type
- 6.2.3. TRIS Type
- 6.2.4. Others
- 6.1. Market Analysis, Insights and Forecast - by Application
- 7. South America Bio Pharma Buffer Analysis, Insights and Forecast, 2019-2031
- 7.1. Market Analysis, Insights and Forecast - by Application
- 7.1.1. Research Institution
- 7.1.2. Pharmaceutical Industry
- 7.1.3. Others
- 7.2. Market Analysis, Insights and Forecast - by Type
- 7.2.1. Phosphates Type
- 7.2.2. Acetates Type
- 7.2.3. TRIS Type
- 7.2.4. Others
- 7.1. Market Analysis, Insights and Forecast - by Application
- 8. Europe Bio Pharma Buffer Analysis, Insights and Forecast, 2019-2031
- 8.1. Market Analysis, Insights and Forecast - by Application
- 8.1.1. Research Institution
- 8.1.2. Pharmaceutical Industry
- 8.1.3. Others
- 8.2. Market Analysis, Insights and Forecast - by Type
- 8.2.1. Phosphates Type
- 8.2.2. Acetates Type
- 8.2.3. TRIS Type
- 8.2.4. Others
- 8.1. Market Analysis, Insights and Forecast - by Application
- 9. Middle East & Africa Bio Pharma Buffer Analysis, Insights and Forecast, 2019-2031
- 9.1. Market Analysis, Insights and Forecast - by Application
- 9.1.1. Research Institution
- 9.1.2. Pharmaceutical Industry
- 9.1.3. Others
- 9.2. Market Analysis, Insights and Forecast - by Type
- 9.2.1. Phosphates Type
- 9.2.2. Acetates Type
- 9.2.3. TRIS Type
- 9.2.4. Others
- 9.1. Market Analysis, Insights and Forecast - by Application
- 10. Asia Pacific Bio Pharma Buffer Analysis, Insights and Forecast, 2019-2031
- 10.1. Market Analysis, Insights and Forecast - by Application
- 10.1.1. Research Institution
- 10.1.2. Pharmaceutical Industry
- 10.1.3. Others
- 10.2. Market Analysis, Insights and Forecast - by Type
- 10.2.1. Phosphates Type
- 10.2.2. Acetates Type
- 10.2.3. TRIS Type
- 10.2.4. Others
- 10.1. Market Analysis, Insights and Forecast - by Application
- 11. Competitive Analysis
- 11.1. Global Market Share Analysis 2024
- 11.2. Company Profiles
- 11.2.1 Avantor
- 11.2.1.1. Overview
- 11.2.1.2. Products
- 11.2.1.3. SWOT Analysis
- 11.2.1.4. Recent Developments
- 11.2.1.5. Financials (Based on Availability)
- 11.2.2 Alfa Aesar (Thermo Fisher)
- 11.2.2.1. Overview
- 11.2.2.2. Products
- 11.2.2.3. SWOT Analysis
- 11.2.2.4. Recent Developments
- 11.2.2.5. Financials (Based on Availability)
- 11.2.3 Merck
- 11.2.3.1. Overview
- 11.2.3.2. Products
- 11.2.3.3. SWOT Analysis
- 11.2.3.4. Recent Developments
- 11.2.3.5. Financials (Based on Availability)
- 11.2.4 Lonza
- 11.2.4.1. Overview
- 11.2.4.2. Products
- 11.2.4.3. SWOT Analysis
- 11.2.4.4. Recent Developments
- 11.2.4.5. Financials (Based on Availability)
- 11.2.5 Bio-Rad
- 11.2.5.1. Overview
- 11.2.5.2. Products
- 11.2.5.3. SWOT Analysis
- 11.2.5.4. Recent Developments
- 11.2.5.5. Financials (Based on Availability)
- 11.2.6 BD
- 11.2.6.1. Overview
- 11.2.6.2. Products
- 11.2.6.3. SWOT Analysis
- 11.2.6.4. Recent Developments
- 11.2.6.5. Financials (Based on Availability)
- 11.2.7 GE Healthcare
- 11.2.7.1. Overview
- 11.2.7.2. Products
- 11.2.7.3. SWOT Analysis
- 11.2.7.4. Recent Developments
- 11.2.7.5. Financials (Based on Availability)
- 11.2.8 Promega Corporation
- 11.2.8.1. Overview
- 11.2.8.2. Products
- 11.2.8.3. SWOT Analysis
- 11.2.8.4. Recent Developments
- 11.2.8.5. Financials (Based on Availability)
- 11.2.9 Hamilton Company
- 11.2.9.1. Overview
- 11.2.9.2. Products
- 11.2.9.3. SWOT Analysis
- 11.2.9.4. Recent Developments
- 11.2.9.5. Financials (Based on Availability)
- 11.2.10 XZL BIO-TECHNOLOGY
- 11.2.10.1. Overview
- 11.2.10.2. Products
- 11.2.10.3. SWOT Analysis
- 11.2.10.4. Recent Developments
- 11.2.10.5. Financials (Based on Availability)
- 11.2.11 SRL
- 11.2.11.1. Overview
- 11.2.11.2. Products
- 11.2.11.3. SWOT Analysis
- 11.2.11.4. Recent Developments
- 11.2.11.5. Financials (Based on Availability)
- 11.2.1 Avantor
List of Figures
- Figure 1: Global Bio Pharma Buffer Revenue Breakdown (million, %) by Region 2024 & 2032
- Figure 2: North America Bio Pharma Buffer Revenue (million), by Application 2024 & 2032
- Figure 3: North America Bio Pharma Buffer Revenue Share (%), by Application 2024 & 2032
- Figure 4: North America Bio Pharma Buffer Revenue (million), by Type 2024 & 2032
- Figure 5: North America Bio Pharma Buffer Revenue Share (%), by Type 2024 & 2032
- Figure 6: North America Bio Pharma Buffer Revenue (million), by Country 2024 & 2032
- Figure 7: North America Bio Pharma Buffer Revenue Share (%), by Country 2024 & 2032
- Figure 8: South America Bio Pharma Buffer Revenue (million), by Application 2024 & 2032
- Figure 9: South America Bio Pharma Buffer Revenue Share (%), by Application 2024 & 2032
- Figure 10: South America Bio Pharma Buffer Revenue (million), by Type 2024 & 2032
- Figure 11: South America Bio Pharma Buffer Revenue Share (%), by Type 2024 & 2032
- Figure 12: South America Bio Pharma Buffer Revenue (million), by Country 2024 & 2032
- Figure 13: South America Bio Pharma Buffer Revenue Share (%), by Country 2024 & 2032
- Figure 14: Europe Bio Pharma Buffer Revenue (million), by Application 2024 & 2032
- Figure 15: Europe Bio Pharma Buffer Revenue Share (%), by Application 2024 & 2032
- Figure 16: Europe Bio Pharma Buffer Revenue (million), by Type 2024 & 2032
- Figure 17: Europe Bio Pharma Buffer Revenue Share (%), by Type 2024 & 2032
- Figure 18: Europe Bio Pharma Buffer Revenue (million), by Country 2024 & 2032
- Figure 19: Europe Bio Pharma Buffer Revenue Share (%), by Country 2024 & 2032
- Figure 20: Middle East & Africa Bio Pharma Buffer Revenue (million), by Application 2024 & 2032
- Figure 21: Middle East & Africa Bio Pharma Buffer Revenue Share (%), by Application 2024 & 2032
- Figure 22: Middle East & Africa Bio Pharma Buffer Revenue (million), by Type 2024 & 2032
- Figure 23: Middle East & Africa Bio Pharma Buffer Revenue Share (%), by Type 2024 & 2032
- Figure 24: Middle East & Africa Bio Pharma Buffer Revenue (million), by Country 2024 & 2032
- Figure 25: Middle East & Africa Bio Pharma Buffer Revenue Share (%), by Country 2024 & 2032
- Figure 26: Asia Pacific Bio Pharma Buffer Revenue (million), by Application 2024 & 2032
- Figure 27: Asia Pacific Bio Pharma Buffer Revenue Share (%), by Application 2024 & 2032
- Figure 28: Asia Pacific Bio Pharma Buffer Revenue (million), by Type 2024 & 2032
- Figure 29: Asia Pacific Bio Pharma Buffer Revenue Share (%), by Type 2024 & 2032
- Figure 30: Asia Pacific Bio Pharma Buffer Revenue (million), by Country 2024 & 2032
- Figure 31: Asia Pacific Bio Pharma Buffer Revenue Share (%), by Country 2024 & 2032
List of Tables
- Table 1: Global Bio Pharma Buffer Revenue million Forecast, by Region 2019 & 2032
- Table 2: Global Bio Pharma Buffer Revenue million Forecast, by Application 2019 & 2032
- Table 3: Global Bio Pharma Buffer Revenue million Forecast, by Type 2019 & 2032
- Table 4: Global Bio Pharma Buffer Revenue million Forecast, by Region 2019 & 2032
- Table 5: Global Bio Pharma Buffer Revenue million Forecast, by Application 2019 & 2032
- Table 6: Global Bio Pharma Buffer Revenue million Forecast, by Type 2019 & 2032
- Table 7: Global Bio Pharma Buffer Revenue million Forecast, by Country 2019 & 2032
- Table 8: United States Bio Pharma Buffer Revenue (million) Forecast, by Application 2019 & 2032
- Table 9: Canada Bio Pharma Buffer Revenue (million) Forecast, by Application 2019 & 2032
- Table 10: Mexico Bio Pharma Buffer Revenue (million) Forecast, by Application 2019 & 2032
- Table 11: Global Bio Pharma Buffer Revenue million Forecast, by Application 2019 & 2032
- Table 12: Global Bio Pharma Buffer Revenue million Forecast, by Type 2019 & 2032
- Table 13: Global Bio Pharma Buffer Revenue million Forecast, by Country 2019 & 2032
- Table 14: Brazil Bio Pharma Buffer Revenue (million) Forecast, by Application 2019 & 2032
- Table 15: Argentina Bio Pharma Buffer Revenue (million) Forecast, by Application 2019 & 2032
- Table 16: Rest of South America Bio Pharma Buffer Revenue (million) Forecast, by Application 2019 & 2032
- Table 17: Global Bio Pharma Buffer Revenue million Forecast, by Application 2019 & 2032
- Table 18: Global Bio Pharma Buffer Revenue million Forecast, by Type 2019 & 2032
- Table 19: Global Bio Pharma Buffer Revenue million Forecast, by Country 2019 & 2032
- Table 20: United Kingdom Bio Pharma Buffer Revenue (million) Forecast, by Application 2019 & 2032
- Table 21: Germany Bio Pharma Buffer Revenue (million) Forecast, by Application 2019 & 2032
- Table 22: France Bio Pharma Buffer Revenue (million) Forecast, by Application 2019 & 2032
- Table 23: Italy Bio Pharma Buffer Revenue (million) Forecast, by Application 2019 & 2032
- Table 24: Spain Bio Pharma Buffer Revenue (million) Forecast, by Application 2019 & 2032
- Table 25: Russia Bio Pharma Buffer Revenue (million) Forecast, by Application 2019 & 2032
- Table 26: Benelux Bio Pharma Buffer Revenue (million) Forecast, by Application 2019 & 2032
- Table 27: Nordics Bio Pharma Buffer Revenue (million) Forecast, by Application 2019 & 2032
- Table 28: Rest of Europe Bio Pharma Buffer Revenue (million) Forecast, by Application 2019 & 2032
- Table 29: Global Bio Pharma Buffer Revenue million Forecast, by Application 2019 & 2032
- Table 30: Global Bio Pharma Buffer Revenue million Forecast, by Type 2019 & 2032
- Table 31: Global Bio Pharma Buffer Revenue million Forecast, by Country 2019 & 2032
- Table 32: Turkey Bio Pharma Buffer Revenue (million) Forecast, by Application 2019 & 2032
- Table 33: Israel Bio Pharma Buffer Revenue (million) Forecast, by Application 2019 & 2032
- Table 34: GCC Bio Pharma Buffer Revenue (million) Forecast, by Application 2019 & 2032
- Table 35: North Africa Bio Pharma Buffer Revenue (million) Forecast, by Application 2019 & 2032
- Table 36: South Africa Bio Pharma Buffer Revenue (million) Forecast, by Application 2019 & 2032
- Table 37: Rest of Middle East & Africa Bio Pharma Buffer Revenue (million) Forecast, by Application 2019 & 2032
- Table 38: Global Bio Pharma Buffer Revenue million Forecast, by Application 2019 & 2032
- Table 39: Global Bio Pharma Buffer Revenue million Forecast, by Type 2019 & 2032
- Table 40: Global Bio Pharma Buffer Revenue million Forecast, by Country 2019 & 2032
- Table 41: China Bio Pharma Buffer Revenue (million) Forecast, by Application 2019 & 2032
- Table 42: India Bio Pharma Buffer Revenue (million) Forecast, by Application 2019 & 2032
- Table 43: Japan Bio Pharma Buffer Revenue (million) Forecast, by Application 2019 & 2032
- Table 44: South Korea Bio Pharma Buffer Revenue (million) Forecast, by Application 2019 & 2032
- Table 45: ASEAN Bio Pharma Buffer Revenue (million) Forecast, by Application 2019 & 2032
- Table 46: Oceania Bio Pharma Buffer Revenue (million) Forecast, by Application 2019 & 2032
- Table 47: Rest of Asia Pacific Bio Pharma Buffer Revenue (million) Forecast, by Application 2019 & 2032
Frequently Asked Questions
1. What is the projected Compound Annual Growth Rate (CAGR) of the Bio Pharma Buffer?
The projected CAGR is approximately 7.2%.
2. Which companies are prominent players in the Bio Pharma Buffer?
Key companies in the market include Avantor, Alfa Aesar (Thermo Fisher), Merck, Lonza, Bio-Rad, BD, GE Healthcare, Promega Corporation, Hamilton Company, XZL BIO-TECHNOLOGY, SRL.
3. What are the main segments of the Bio Pharma Buffer?
The market segments include Application, Type.
4. Can you provide details about the market size?
The market size is estimated to be USD 1561 million as of 2022.
5. What are some drivers contributing to market growth?
N/A
6. What are the notable trends driving market growth?
N/A
7. Are there any restraints impacting market growth?
N/A
8. Can you provide examples of recent developments in the market?
N/A
9. What pricing options are available for accessing the report?
Pricing options include single-user, multi-user, and enterprise licenses priced at USD 4250.00, USD 6375.00, and USD 8500.00 respectively.
10. Is the market size provided in terms of value or volume?
The market size is provided in terms of value, measured in million.
11. Are there any specific market keywords associated with the report?
Yes, the market keyword associated with the report is "Bio Pharma Buffer," which aids in identifying and referencing the specific market segment covered.
12. How do I determine which pricing option suits my needs best?
The pricing options vary based on user requirements and access needs. Individual users may opt for single-user licenses, while businesses requiring broader access may choose multi-user or enterprise licenses for cost-effective access to the report.
13. Are there any additional resources or data provided in the Bio Pharma Buffer report?
While the report offers comprehensive insights, it's advisable to review the specific contents or supplementary materials provided to ascertain if additional resources or data are available.
14. How can I stay updated on further developments or reports in the Bio Pharma Buffer?
To stay informed about further developments, trends, and reports in the Bio Pharma Buffer, consider subscribing to industry newsletters, following relevant companies and organizations, or regularly checking reputable industry news sources and publications.
Methodology
Step 1 - Identification of Relevant Samples Size from Population Database


Step 2 - Approaches for Defining Global Market Size (Value, Volume* & Price*)

Note*: In applicable scenarios
Step 3 - Data Sources
Primary Research
- Web Analytics
- Survey Reports
- Research Institute
- Latest Research Reports
- Opinion Leaders
Secondary Research
- Annual Reports
- White Paper
- Latest Press Release
- Industry Association
- Paid Database
- Investor Presentations

Step 4 - Data Triangulation
Involves using different sources of information in order to increase the validity of a study
These sources are likely to be stakeholders in a program - participants, other researchers, program staff, other community members, and so on.
Then we put all data in single framework & apply various statistical tools to find out the dynamic on the market.
During the analysis stage, feedback from the stakeholder groups would be compared to determine areas of agreement as well as areas of divergence
