

Key Insights
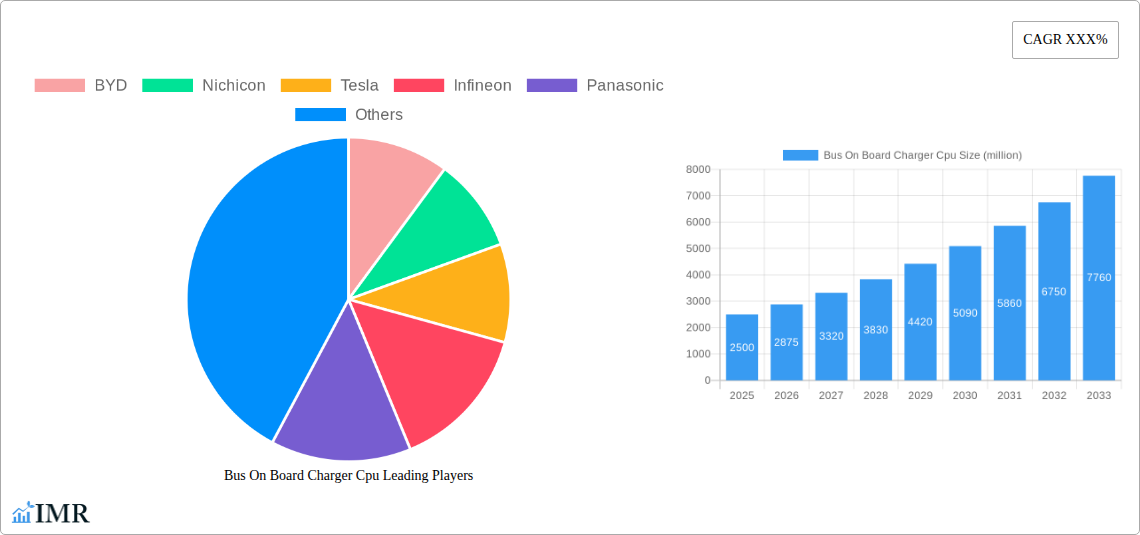
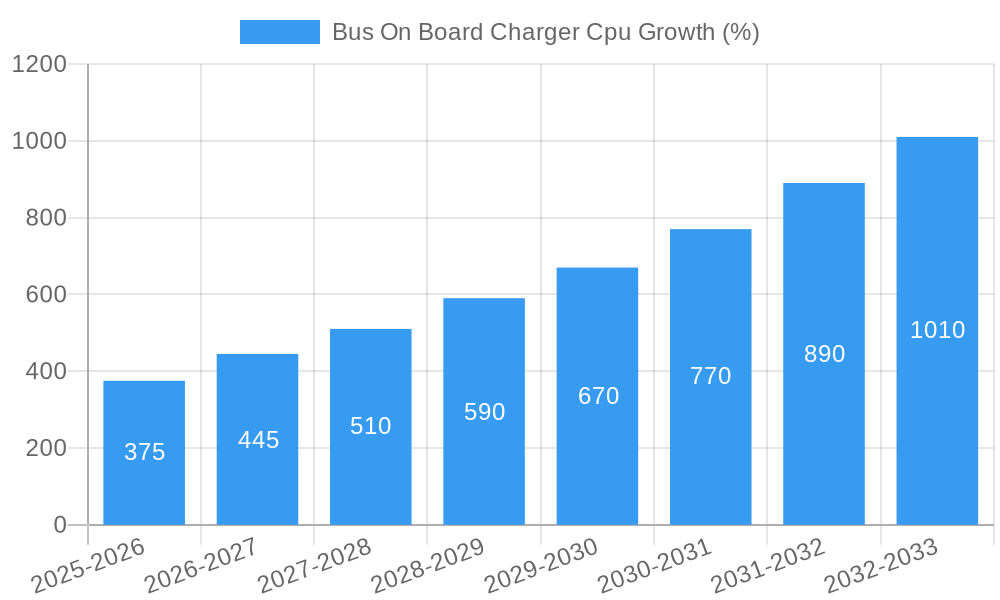
The global Bus On Board Charger (OBC) CPU market is experiencing robust growth, driven by the increasing adoption of electric vehicles (EVs) and the rising demand for efficient and reliable charging solutions. The market's expansion is fueled by several key factors, including government initiatives promoting electric mobility, advancements in battery technology leading to higher charging speeds, and the continuous development of more sophisticated power management systems within EVs. Major players like BYD, Tesla, and Infineon are at the forefront of innovation, constantly striving to improve the efficiency, power density, and cost-effectiveness of OBC CPUs. This competition is beneficial for consumers, leading to more advanced and affordable EV charging solutions. We estimate the market size in 2025 to be approximately $2.5 billion, considering the growth rates of related EV markets and the increasing integration of advanced CPUs in OBC systems. A Compound Annual Growth Rate (CAGR) of 15% from 2025 to 2033 is projected, indicating significant potential for market expansion. This growth is expected to be distributed across various geographical regions, with North America and Europe currently holding significant market share.
However, challenges remain. The high initial cost of OBC CPUs and the complexities associated with integrating them into EVs could hinder market penetration, particularly in developing economies. Furthermore, ensuring long-term reliability and addressing potential safety concerns related to high-power charging are critical factors that will influence market growth. The increasing need for advanced features such as bidirectional charging and vehicle-to-grid (V2G) technology further complicates the design and manufacturing processes, demanding continuous research and development efforts from market participants. Nevertheless, the overall market outlook remains positive, promising substantial growth opportunities for companies involved in the design, manufacturing, and integration of Bus On Board Charger CPUs.
Bus On Board Charger CPU Market Report: 2019-2033
This comprehensive report provides an in-depth analysis of the Bus On Board Charger (OBC) CPU market, encompassing market dynamics, growth trends, regional analysis, product landscape, and key player strategies. The report covers the period from 2019 to 2033, with a focus on the forecast period of 2025-2033 and a base year of 2025. The study provides valuable insights for industry professionals, investors, and strategic decision-makers seeking to understand and capitalize on the opportunities within this rapidly evolving sector. The parent market is the electric vehicle (EV) charging infrastructure market, and the child market is the onboard charger (OBC) component market.
Keywords: Bus On Board Charger, OBC CPU, Electric Vehicle Charging, EV Infrastructure, Onboard Charger, Power Electronics, Automotive Electronics, Market Analysis, Market Forecast, BYD, Tesla, Infineon, Panasonic, Nichicon, Aptiv, LG, Lear, Dilong Technology, Kongsberg, Kenergy, Wanma, IES, Anghua, Lester, Tonhe Technology
Bus On Board Charger CPU Market Dynamics & Structure
The Bus On Board Charger CPU market is characterized by increasing market concentration among leading players. Technological innovation, driven by the demand for higher efficiency and faster charging speeds, is a key driver. Stringent regulatory frameworks promoting EV adoption globally are also shaping market growth. Competitive substitutes, such as external chargers, pose a challenge, while end-user demographics are shifting towards environmentally conscious consumers. M&A activity in the broader EV ecosystem is influencing market consolidation.
- Market Concentration: The top 5 players hold approximately xx% of the market share in 2025 (estimated).
- Technological Innovation: Focus on silicon carbide (SiC) and gallium nitride (GaN) based power devices for improved efficiency.
- Regulatory Framework: Government incentives and emissions regulations are accelerating EV adoption.
- Competitive Substitutes: External chargers remain a competitive alternative, although OBCs offer convenience.
- M&A Trends: Consolidation is expected, with larger players acquiring smaller specialized companies. xx M&A deals were recorded between 2019 and 2024.
- Innovation Barriers: High R&D costs and challenges in miniaturization are significant obstacles.
Bus On Board Charger CPU Growth Trends & Insights
The Bus On Board Charger CPU market is experiencing significant growth, driven by the escalating demand for electric vehicles. The market size expanded from xx million units in 2019 to xx million units in 2024. We project a CAGR of xx% from 2025 to 2033, reaching xx million units by 2033. This growth is fueled by increased adoption rates of EVs globally and technological advancements leading to improved OBC performance and reduced costs. Consumer behavior is shifting towards prioritizing environmentally friendly transportation options, further driving market expansion. Disruptive technologies, such as wireless charging, are expected to influence the market in the long term, while increasing focus on vehicle-to-grid (V2G) technology will create additional opportunities.
Dominant Regions, Countries, or Segments in Bus On Board Charger CPU
China is the leading region in the Bus On Board Charger CPU market, followed by Europe and North America. This dominance is attributed to several factors:
- High EV Adoption: China’s strong government support for electric vehicles creates a large demand for OBC CPUs.
- Extensive Charging Infrastructure Development: Significant investment in charging infrastructure supports higher market penetration.
- Supportive Government Policies: Subsidies and tax breaks for EV purchases boost demand.
- Cost-Effective Manufacturing: China’s robust manufacturing base provides cost advantages.
Europe and North America are also showing strong growth, driven by environmental regulations and increasing consumer awareness.
Bus On Board Charger CPU Product Landscape
The Bus On Board Charger CPU market offers a range of products varying in power capacity, efficiency, and integration level. Recent product innovations have focused on higher processing speeds, improved thermal management, and enhanced communication capabilities. Key selling propositions include improved charging efficiency, reduced charging times, and enhanced safety features. Advancements in silicon carbide (SiC) and gallium nitride (GaN) power semiconductors are driving improvements in performance and size reduction.
Key Drivers, Barriers & Challenges in Bus On Board Charger CPU
Key Drivers:
- Rising EV adoption globally.
- Stringent emission regulations.
- Government incentives for EV infrastructure development.
- Technological advancements leading to higher efficiency and faster charging.
Key Challenges:
- High initial investment costs for manufacturers and consumers.
- Supply chain disruptions impacting component availability.
- Competition from alternative charging technologies.
- Safety and reliability concerns.
Emerging Opportunities in Bus On Board Charger CPU
- Wireless Charging Integration: The potential for seamless and convenient charging solutions is driving this sector.
- Vehicle-to-Grid (V2G) Technology: OBC CPUs can play a vital role in facilitating bidirectional power flow.
- Expansion in Developing Markets: Significant growth opportunities exist in emerging economies with increasing EV adoption.
Growth Accelerators in the Bus On Board Charger CPU Industry
Technological breakthroughs in power semiconductor technology, particularly the adoption of SiC and GaN, are key growth accelerators. Strategic partnerships between OBC CPU manufacturers and EV makers are crucial for product integration and market expansion. Furthermore, the development of advanced thermal management solutions and miniaturization strategies will contribute to long-term market growth.
Key Players Shaping the Bus On Board Charger CPU Market
- BYD
- Nichicon
- Tesla
- Infineon
- Panasonic
- Aptiv
- LG
- Lear
- Dilong Technology
- Kongsberg
- Kenergy
- Wanma
- IES
- Anghua
- Lester
- Tonhe Technology
Notable Milestones in Bus On Board Charger CPU Sector
- 2021-Q4: Infineon launches its next-generation SiC-based OBC CPU.
- 2022-Q2: BYD announces a strategic partnership with a major battery manufacturer for OBC integration.
- 2023-Q1: Tesla patents a new wireless charging technology for OBCs.
In-Depth Bus On Board Charger CPU Market Outlook
The Bus On Board Charger CPU market is poised for continued strong growth, driven by the global shift towards electric mobility. The increasing demand for higher efficiency, faster charging, and improved safety features will fuel technological advancements and market expansion. Strategic partnerships and investments in R&D will be key for players seeking to capitalize on this significant market opportunity. The long-term outlook remains positive, with significant potential for growth in both developed and developing markets.
Bus On Board Charger Cpu Segmentation
-
1. Application
- 1.1. EV
- 1.2. PHEV
-
2. Type
- 2.1. 3.0 - 3.7 kw
- 2.2. Higher than 3.7 kw
- 2.3. Lower than 3.0 kw
Bus On Board Charger Cpu Segmentation By Geography
-
1. North America
- 1.1. United States
- 1.2. Canada
- 1.3. Mexico
-
2. South America
- 2.1. Brazil
- 2.2. Argentina
- 2.3. Rest of South America
-
3. Europe
- 3.1. United Kingdom
- 3.2. Germany
- 3.3. France
- 3.4. Italy
- 3.5. Spain
- 3.6. Russia
- 3.7. Benelux
- 3.8. Nordics
- 3.9. Rest of Europe
-
4. Middle East & Africa
- 4.1. Turkey
- 4.2. Israel
- 4.3. GCC
- 4.4. North Africa
- 4.5. South Africa
- 4.6. Rest of Middle East & Africa
-
5. Asia Pacific
- 5.1. China
- 5.2. India
- 5.3. Japan
- 5.4. South Korea
- 5.5. ASEAN
- 5.6. Oceania
- 5.7. Rest of Asia Pacific

Bus On Board Charger Cpu REPORT HIGHLIGHTS
| Aspects | Details |
|---|---|
| Study Period | 2019-2033 |
| Base Year | 2024 |
| Estimated Year | 2025 |
| Forecast Period | 2025-2033 |
| Historical Period | 2019-2024 |
| Growth Rate | CAGR of XXX% from 2019-2033 |
| Segmentation |
|
Table of Contents
- 1. Introduction
- 1.1. Research Scope
- 1.2. Market Segmentation
- 1.3. Research Methodology
- 1.4. Definitions and Assumptions
- 2. Executive Summary
- 2.1. Introduction
- 3. Market Dynamics
- 3.1. Introduction
- 3.2. Market Drivers
- 3.3. Market Restrains
- 3.4. Market Trends
- 4. Market Factor Analysis
- 4.1. Porters Five Forces
- 4.2. Supply/Value Chain
- 4.3. PESTEL analysis
- 4.4. Market Entropy
- 4.5. Patent/Trademark Analysis
- 5. Global Bus On Board Charger Cpu Analysis, Insights and Forecast, 2019-2031
- 5.1. Market Analysis, Insights and Forecast - by Application
- 5.1.1. EV
- 5.1.2. PHEV
- 5.2. Market Analysis, Insights and Forecast - by Type
- 5.2.1. 3.0 - 3.7 kw
- 5.2.2. Higher than 3.7 kw
- 5.2.3. Lower than 3.0 kw
- 5.3. Market Analysis, Insights and Forecast - by Region
- 5.3.1. North America
- 5.3.2. South America
- 5.3.3. Europe
- 5.3.4. Middle East & Africa
- 5.3.5. Asia Pacific
- 5.1. Market Analysis, Insights and Forecast - by Application
- 6. North America Bus On Board Charger Cpu Analysis, Insights and Forecast, 2019-2031
- 6.1. Market Analysis, Insights and Forecast - by Application
- 6.1.1. EV
- 6.1.2. PHEV
- 6.2. Market Analysis, Insights and Forecast - by Type
- 6.2.1. 3.0 - 3.7 kw
- 6.2.2. Higher than 3.7 kw
- 6.2.3. Lower than 3.0 kw
- 6.1. Market Analysis, Insights and Forecast - by Application
- 7. South America Bus On Board Charger Cpu Analysis, Insights and Forecast, 2019-2031
- 7.1. Market Analysis, Insights and Forecast - by Application
- 7.1.1. EV
- 7.1.2. PHEV
- 7.2. Market Analysis, Insights and Forecast - by Type
- 7.2.1. 3.0 - 3.7 kw
- 7.2.2. Higher than 3.7 kw
- 7.2.3. Lower than 3.0 kw
- 7.1. Market Analysis, Insights and Forecast - by Application
- 8. Europe Bus On Board Charger Cpu Analysis, Insights and Forecast, 2019-2031
- 8.1. Market Analysis, Insights and Forecast - by Application
- 8.1.1. EV
- 8.1.2. PHEV
- 8.2. Market Analysis, Insights and Forecast - by Type
- 8.2.1. 3.0 - 3.7 kw
- 8.2.2. Higher than 3.7 kw
- 8.2.3. Lower than 3.0 kw
- 8.1. Market Analysis, Insights and Forecast - by Application
- 9. Middle East & Africa Bus On Board Charger Cpu Analysis, Insights and Forecast, 2019-2031
- 9.1. Market Analysis, Insights and Forecast - by Application
- 9.1.1. EV
- 9.1.2. PHEV
- 9.2. Market Analysis, Insights and Forecast - by Type
- 9.2.1. 3.0 - 3.7 kw
- 9.2.2. Higher than 3.7 kw
- 9.2.3. Lower than 3.0 kw
- 9.1. Market Analysis, Insights and Forecast - by Application
- 10. Asia Pacific Bus On Board Charger Cpu Analysis, Insights and Forecast, 2019-2031
- 10.1. Market Analysis, Insights and Forecast - by Application
- 10.1.1. EV
- 10.1.2. PHEV
- 10.2. Market Analysis, Insights and Forecast - by Type
- 10.2.1. 3.0 - 3.7 kw
- 10.2.2. Higher than 3.7 kw
- 10.2.3. Lower than 3.0 kw
- 10.1. Market Analysis, Insights and Forecast - by Application
- 11. Competitive Analysis
- 11.1. Global Market Share Analysis 2024
- 11.2. Company Profiles
- 11.2.1 BYD
- 11.2.1.1. Overview
- 11.2.1.2. Products
- 11.2.1.3. SWOT Analysis
- 11.2.1.4. Recent Developments
- 11.2.1.5. Financials (Based on Availability)
- 11.2.2 Nichicon
- 11.2.2.1. Overview
- 11.2.2.2. Products
- 11.2.2.3. SWOT Analysis
- 11.2.2.4. Recent Developments
- 11.2.2.5. Financials (Based on Availability)
- 11.2.3 Tesla
- 11.2.3.1. Overview
- 11.2.3.2. Products
- 11.2.3.3. SWOT Analysis
- 11.2.3.4. Recent Developments
- 11.2.3.5. Financials (Based on Availability)
- 11.2.4 Infineon
- 11.2.4.1. Overview
- 11.2.4.2. Products
- 11.2.4.3. SWOT Analysis
- 11.2.4.4. Recent Developments
- 11.2.4.5. Financials (Based on Availability)
- 11.2.5 Panasonic
- 11.2.5.1. Overview
- 11.2.5.2. Products
- 11.2.5.3. SWOT Analysis
- 11.2.5.4. Recent Developments
- 11.2.5.5. Financials (Based on Availability)
- 11.2.6 Aptiv
- 11.2.6.1. Overview
- 11.2.6.2. Products
- 11.2.6.3. SWOT Analysis
- 11.2.6.4. Recent Developments
- 11.2.6.5. Financials (Based on Availability)
- 11.2.7 LG
- 11.2.7.1. Overview
- 11.2.7.2. Products
- 11.2.7.3. SWOT Analysis
- 11.2.7.4. Recent Developments
- 11.2.7.5. Financials (Based on Availability)
- 11.2.8 Lear
- 11.2.8.1. Overview
- 11.2.8.2. Products
- 11.2.8.3. SWOT Analysis
- 11.2.8.4. Recent Developments
- 11.2.8.5. Financials (Based on Availability)
- 11.2.9 Dilong Technology
- 11.2.9.1. Overview
- 11.2.9.2. Products
- 11.2.9.3. SWOT Analysis
- 11.2.9.4. Recent Developments
- 11.2.9.5. Financials (Based on Availability)
- 11.2.10 Kongsberg
- 11.2.10.1. Overview
- 11.2.10.2. Products
- 11.2.10.3. SWOT Analysis
- 11.2.10.4. Recent Developments
- 11.2.10.5. Financials (Based on Availability)
- 11.2.11 Kenergy
- 11.2.11.1. Overview
- 11.2.11.2. Products
- 11.2.11.3. SWOT Analysis
- 11.2.11.4. Recent Developments
- 11.2.11.5. Financials (Based on Availability)
- 11.2.12 Wanma
- 11.2.12.1. Overview
- 11.2.12.2. Products
- 11.2.12.3. SWOT Analysis
- 11.2.12.4. Recent Developments
- 11.2.12.5. Financials (Based on Availability)
- 11.2.13 IES
- 11.2.13.1. Overview
- 11.2.13.2. Products
- 11.2.13.3. SWOT Analysis
- 11.2.13.4. Recent Developments
- 11.2.13.5. Financials (Based on Availability)
- 11.2.14 Anghua
- 11.2.14.1. Overview
- 11.2.14.2. Products
- 11.2.14.3. SWOT Analysis
- 11.2.14.4. Recent Developments
- 11.2.14.5. Financials (Based on Availability)
- 11.2.15 Lester
- 11.2.15.1. Overview
- 11.2.15.2. Products
- 11.2.15.3. SWOT Analysis
- 11.2.15.4. Recent Developments
- 11.2.15.5. Financials (Based on Availability)
- 11.2.16 Tonhe Technology
- 11.2.16.1. Overview
- 11.2.16.2. Products
- 11.2.16.3. SWOT Analysis
- 11.2.16.4. Recent Developments
- 11.2.16.5. Financials (Based on Availability)
- 11.2.1 BYD
List of Figures
- Figure 1: Global Bus On Board Charger Cpu Revenue Breakdown (million, %) by Region 2024 & 2032
- Figure 2: Global Bus On Board Charger Cpu Volume Breakdown (K, %) by Region 2024 & 2032
- Figure 3: North America Bus On Board Charger Cpu Revenue (million), by Application 2024 & 2032
- Figure 4: North America Bus On Board Charger Cpu Volume (K), by Application 2024 & 2032
- Figure 5: North America Bus On Board Charger Cpu Revenue Share (%), by Application 2024 & 2032
- Figure 6: North America Bus On Board Charger Cpu Volume Share (%), by Application 2024 & 2032
- Figure 7: North America Bus On Board Charger Cpu Revenue (million), by Type 2024 & 2032
- Figure 8: North America Bus On Board Charger Cpu Volume (K), by Type 2024 & 2032
- Figure 9: North America Bus On Board Charger Cpu Revenue Share (%), by Type 2024 & 2032
- Figure 10: North America Bus On Board Charger Cpu Volume Share (%), by Type 2024 & 2032
- Figure 11: North America Bus On Board Charger Cpu Revenue (million), by Country 2024 & 2032
- Figure 12: North America Bus On Board Charger Cpu Volume (K), by Country 2024 & 2032
- Figure 13: North America Bus On Board Charger Cpu Revenue Share (%), by Country 2024 & 2032
- Figure 14: North America Bus On Board Charger Cpu Volume Share (%), by Country 2024 & 2032
- Figure 15: South America Bus On Board Charger Cpu Revenue (million), by Application 2024 & 2032
- Figure 16: South America Bus On Board Charger Cpu Volume (K), by Application 2024 & 2032
- Figure 17: South America Bus On Board Charger Cpu Revenue Share (%), by Application 2024 & 2032
- Figure 18: South America Bus On Board Charger Cpu Volume Share (%), by Application 2024 & 2032
- Figure 19: South America Bus On Board Charger Cpu Revenue (million), by Type 2024 & 2032
- Figure 20: South America Bus On Board Charger Cpu Volume (K), by Type 2024 & 2032
- Figure 21: South America Bus On Board Charger Cpu Revenue Share (%), by Type 2024 & 2032
- Figure 22: South America Bus On Board Charger Cpu Volume Share (%), by Type 2024 & 2032
- Figure 23: South America Bus On Board Charger Cpu Revenue (million), by Country 2024 & 2032
- Figure 24: South America Bus On Board Charger Cpu Volume (K), by Country 2024 & 2032
- Figure 25: South America Bus On Board Charger Cpu Revenue Share (%), by Country 2024 & 2032
- Figure 26: South America Bus On Board Charger Cpu Volume Share (%), by Country 2024 & 2032
- Figure 27: Europe Bus On Board Charger Cpu Revenue (million), by Application 2024 & 2032
- Figure 28: Europe Bus On Board Charger Cpu Volume (K), by Application 2024 & 2032
- Figure 29: Europe Bus On Board Charger Cpu Revenue Share (%), by Application 2024 & 2032
- Figure 30: Europe Bus On Board Charger Cpu Volume Share (%), by Application 2024 & 2032
- Figure 31: Europe Bus On Board Charger Cpu Revenue (million), by Type 2024 & 2032
- Figure 32: Europe Bus On Board Charger Cpu Volume (K), by Type 2024 & 2032
- Figure 33: Europe Bus On Board Charger Cpu Revenue Share (%), by Type 2024 & 2032
- Figure 34: Europe Bus On Board Charger Cpu Volume Share (%), by Type 2024 & 2032
- Figure 35: Europe Bus On Board Charger Cpu Revenue (million), by Country 2024 & 2032
- Figure 36: Europe Bus On Board Charger Cpu Volume (K), by Country 2024 & 2032
- Figure 37: Europe Bus On Board Charger Cpu Revenue Share (%), by Country 2024 & 2032
- Figure 38: Europe Bus On Board Charger Cpu Volume Share (%), by Country 2024 & 2032
- Figure 39: Middle East & Africa Bus On Board Charger Cpu Revenue (million), by Application 2024 & 2032
- Figure 40: Middle East & Africa Bus On Board Charger Cpu Volume (K), by Application 2024 & 2032
- Figure 41: Middle East & Africa Bus On Board Charger Cpu Revenue Share (%), by Application 2024 & 2032
- Figure 42: Middle East & Africa Bus On Board Charger Cpu Volume Share (%), by Application 2024 & 2032
- Figure 43: Middle East & Africa Bus On Board Charger Cpu Revenue (million), by Type 2024 & 2032
- Figure 44: Middle East & Africa Bus On Board Charger Cpu Volume (K), by Type 2024 & 2032
- Figure 45: Middle East & Africa Bus On Board Charger Cpu Revenue Share (%), by Type 2024 & 2032
- Figure 46: Middle East & Africa Bus On Board Charger Cpu Volume Share (%), by Type 2024 & 2032
- Figure 47: Middle East & Africa Bus On Board Charger Cpu Revenue (million), by Country 2024 & 2032
- Figure 48: Middle East & Africa Bus On Board Charger Cpu Volume (K), by Country 2024 & 2032
- Figure 49: Middle East & Africa Bus On Board Charger Cpu Revenue Share (%), by Country 2024 & 2032
- Figure 50: Middle East & Africa Bus On Board Charger Cpu Volume Share (%), by Country 2024 & 2032
- Figure 51: Asia Pacific Bus On Board Charger Cpu Revenue (million), by Application 2024 & 2032
- Figure 52: Asia Pacific Bus On Board Charger Cpu Volume (K), by Application 2024 & 2032
- Figure 53: Asia Pacific Bus On Board Charger Cpu Revenue Share (%), by Application 2024 & 2032
- Figure 54: Asia Pacific Bus On Board Charger Cpu Volume Share (%), by Application 2024 & 2032
- Figure 55: Asia Pacific Bus On Board Charger Cpu Revenue (million), by Type 2024 & 2032
- Figure 56: Asia Pacific Bus On Board Charger Cpu Volume (K), by Type 2024 & 2032
- Figure 57: Asia Pacific Bus On Board Charger Cpu Revenue Share (%), by Type 2024 & 2032
- Figure 58: Asia Pacific Bus On Board Charger Cpu Volume Share (%), by Type 2024 & 2032
- Figure 59: Asia Pacific Bus On Board Charger Cpu Revenue (million), by Country 2024 & 2032
- Figure 60: Asia Pacific Bus On Board Charger Cpu Volume (K), by Country 2024 & 2032
- Figure 61: Asia Pacific Bus On Board Charger Cpu Revenue Share (%), by Country 2024 & 2032
- Figure 62: Asia Pacific Bus On Board Charger Cpu Volume Share (%), by Country 2024 & 2032
List of Tables
- Table 1: Global Bus On Board Charger Cpu Revenue million Forecast, by Region 2019 & 2032
- Table 2: Global Bus On Board Charger Cpu Volume K Forecast, by Region 2019 & 2032
- Table 3: Global Bus On Board Charger Cpu Revenue million Forecast, by Application 2019 & 2032
- Table 4: Global Bus On Board Charger Cpu Volume K Forecast, by Application 2019 & 2032
- Table 5: Global Bus On Board Charger Cpu Revenue million Forecast, by Type 2019 & 2032
- Table 6: Global Bus On Board Charger Cpu Volume K Forecast, by Type 2019 & 2032
- Table 7: Global Bus On Board Charger Cpu Revenue million Forecast, by Region 2019 & 2032
- Table 8: Global Bus On Board Charger Cpu Volume K Forecast, by Region 2019 & 2032
- Table 9: Global Bus On Board Charger Cpu Revenue million Forecast, by Application 2019 & 2032
- Table 10: Global Bus On Board Charger Cpu Volume K Forecast, by Application 2019 & 2032
- Table 11: Global Bus On Board Charger Cpu Revenue million Forecast, by Type 2019 & 2032
- Table 12: Global Bus On Board Charger Cpu Volume K Forecast, by Type 2019 & 2032
- Table 13: Global Bus On Board Charger Cpu Revenue million Forecast, by Country 2019 & 2032
- Table 14: Global Bus On Board Charger Cpu Volume K Forecast, by Country 2019 & 2032
- Table 15: United States Bus On Board Charger Cpu Revenue (million) Forecast, by Application 2019 & 2032
- Table 16: United States Bus On Board Charger Cpu Volume (K) Forecast, by Application 2019 & 2032
- Table 17: Canada Bus On Board Charger Cpu Revenue (million) Forecast, by Application 2019 & 2032
- Table 18: Canada Bus On Board Charger Cpu Volume (K) Forecast, by Application 2019 & 2032
- Table 19: Mexico Bus On Board Charger Cpu Revenue (million) Forecast, by Application 2019 & 2032
- Table 20: Mexico Bus On Board Charger Cpu Volume (K) Forecast, by Application 2019 & 2032
- Table 21: Global Bus On Board Charger Cpu Revenue million Forecast, by Application 2019 & 2032
- Table 22: Global Bus On Board Charger Cpu Volume K Forecast, by Application 2019 & 2032
- Table 23: Global Bus On Board Charger Cpu Revenue million Forecast, by Type 2019 & 2032
- Table 24: Global Bus On Board Charger Cpu Volume K Forecast, by Type 2019 & 2032
- Table 25: Global Bus On Board Charger Cpu Revenue million Forecast, by Country 2019 & 2032
- Table 26: Global Bus On Board Charger Cpu Volume K Forecast, by Country 2019 & 2032
- Table 27: Brazil Bus On Board Charger Cpu Revenue (million) Forecast, by Application 2019 & 2032
- Table 28: Brazil Bus On Board Charger Cpu Volume (K) Forecast, by Application 2019 & 2032
- Table 29: Argentina Bus On Board Charger Cpu Revenue (million) Forecast, by Application 2019 & 2032
- Table 30: Argentina Bus On Board Charger Cpu Volume (K) Forecast, by Application 2019 & 2032
- Table 31: Rest of South America Bus On Board Charger Cpu Revenue (million) Forecast, by Application 2019 & 2032
- Table 32: Rest of South America Bus On Board Charger Cpu Volume (K) Forecast, by Application 2019 & 2032
- Table 33: Global Bus On Board Charger Cpu Revenue million Forecast, by Application 2019 & 2032
- Table 34: Global Bus On Board Charger Cpu Volume K Forecast, by Application 2019 & 2032
- Table 35: Global Bus On Board Charger Cpu Revenue million Forecast, by Type 2019 & 2032
- Table 36: Global Bus On Board Charger Cpu Volume K Forecast, by Type 2019 & 2032
- Table 37: Global Bus On Board Charger Cpu Revenue million Forecast, by Country 2019 & 2032
- Table 38: Global Bus On Board Charger Cpu Volume K Forecast, by Country 2019 & 2032
- Table 39: United Kingdom Bus On Board Charger Cpu Revenue (million) Forecast, by Application 2019 & 2032
- Table 40: United Kingdom Bus On Board Charger Cpu Volume (K) Forecast, by Application 2019 & 2032
- Table 41: Germany Bus On Board Charger Cpu Revenue (million) Forecast, by Application 2019 & 2032
- Table 42: Germany Bus On Board Charger Cpu Volume (K) Forecast, by Application 2019 & 2032
- Table 43: France Bus On Board Charger Cpu Revenue (million) Forecast, by Application 2019 & 2032
- Table 44: France Bus On Board Charger Cpu Volume (K) Forecast, by Application 2019 & 2032
- Table 45: Italy Bus On Board Charger Cpu Revenue (million) Forecast, by Application 2019 & 2032
- Table 46: Italy Bus On Board Charger Cpu Volume (K) Forecast, by Application 2019 & 2032
- Table 47: Spain Bus On Board Charger Cpu Revenue (million) Forecast, by Application 2019 & 2032
- Table 48: Spain Bus On Board Charger Cpu Volume (K) Forecast, by Application 2019 & 2032
- Table 49: Russia Bus On Board Charger Cpu Revenue (million) Forecast, by Application 2019 & 2032
- Table 50: Russia Bus On Board Charger Cpu Volume (K) Forecast, by Application 2019 & 2032
- Table 51: Benelux Bus On Board Charger Cpu Revenue (million) Forecast, by Application 2019 & 2032
- Table 52: Benelux Bus On Board Charger Cpu Volume (K) Forecast, by Application 2019 & 2032
- Table 53: Nordics Bus On Board Charger Cpu Revenue (million) Forecast, by Application 2019 & 2032
- Table 54: Nordics Bus On Board Charger Cpu Volume (K) Forecast, by Application 2019 & 2032
- Table 55: Rest of Europe Bus On Board Charger Cpu Revenue (million) Forecast, by Application 2019 & 2032
- Table 56: Rest of Europe Bus On Board Charger Cpu Volume (K) Forecast, by Application 2019 & 2032
- Table 57: Global Bus On Board Charger Cpu Revenue million Forecast, by Application 2019 & 2032
- Table 58: Global Bus On Board Charger Cpu Volume K Forecast, by Application 2019 & 2032
- Table 59: Global Bus On Board Charger Cpu Revenue million Forecast, by Type 2019 & 2032
- Table 60: Global Bus On Board Charger Cpu Volume K Forecast, by Type 2019 & 2032
- Table 61: Global Bus On Board Charger Cpu Revenue million Forecast, by Country 2019 & 2032
- Table 62: Global Bus On Board Charger Cpu Volume K Forecast, by Country 2019 & 2032
- Table 63: Turkey Bus On Board Charger Cpu Revenue (million) Forecast, by Application 2019 & 2032
- Table 64: Turkey Bus On Board Charger Cpu Volume (K) Forecast, by Application 2019 & 2032
- Table 65: Israel Bus On Board Charger Cpu Revenue (million) Forecast, by Application 2019 & 2032
- Table 66: Israel Bus On Board Charger Cpu Volume (K) Forecast, by Application 2019 & 2032
- Table 67: GCC Bus On Board Charger Cpu Revenue (million) Forecast, by Application 2019 & 2032
- Table 68: GCC Bus On Board Charger Cpu Volume (K) Forecast, by Application 2019 & 2032
- Table 69: North Africa Bus On Board Charger Cpu Revenue (million) Forecast, by Application 2019 & 2032
- Table 70: North Africa Bus On Board Charger Cpu Volume (K) Forecast, by Application 2019 & 2032
- Table 71: South Africa Bus On Board Charger Cpu Revenue (million) Forecast, by Application 2019 & 2032
- Table 72: South Africa Bus On Board Charger Cpu Volume (K) Forecast, by Application 2019 & 2032
- Table 73: Rest of Middle East & Africa Bus On Board Charger Cpu Revenue (million) Forecast, by Application 2019 & 2032
- Table 74: Rest of Middle East & Africa Bus On Board Charger Cpu Volume (K) Forecast, by Application 2019 & 2032
- Table 75: Global Bus On Board Charger Cpu Revenue million Forecast, by Application 2019 & 2032
- Table 76: Global Bus On Board Charger Cpu Volume K Forecast, by Application 2019 & 2032
- Table 77: Global Bus On Board Charger Cpu Revenue million Forecast, by Type 2019 & 2032
- Table 78: Global Bus On Board Charger Cpu Volume K Forecast, by Type 2019 & 2032
- Table 79: Global Bus On Board Charger Cpu Revenue million Forecast, by Country 2019 & 2032
- Table 80: Global Bus On Board Charger Cpu Volume K Forecast, by Country 2019 & 2032
- Table 81: China Bus On Board Charger Cpu Revenue (million) Forecast, by Application 2019 & 2032
- Table 82: China Bus On Board Charger Cpu Volume (K) Forecast, by Application 2019 & 2032
- Table 83: India Bus On Board Charger Cpu Revenue (million) Forecast, by Application 2019 & 2032
- Table 84: India Bus On Board Charger Cpu Volume (K) Forecast, by Application 2019 & 2032
- Table 85: Japan Bus On Board Charger Cpu Revenue (million) Forecast, by Application 2019 & 2032
- Table 86: Japan Bus On Board Charger Cpu Volume (K) Forecast, by Application 2019 & 2032
- Table 87: South Korea Bus On Board Charger Cpu Revenue (million) Forecast, by Application 2019 & 2032
- Table 88: South Korea Bus On Board Charger Cpu Volume (K) Forecast, by Application 2019 & 2032
- Table 89: ASEAN Bus On Board Charger Cpu Revenue (million) Forecast, by Application 2019 & 2032
- Table 90: ASEAN Bus On Board Charger Cpu Volume (K) Forecast, by Application 2019 & 2032
- Table 91: Oceania Bus On Board Charger Cpu Revenue (million) Forecast, by Application 2019 & 2032
- Table 92: Oceania Bus On Board Charger Cpu Volume (K) Forecast, by Application 2019 & 2032
- Table 93: Rest of Asia Pacific Bus On Board Charger Cpu Revenue (million) Forecast, by Application 2019 & 2032
- Table 94: Rest of Asia Pacific Bus On Board Charger Cpu Volume (K) Forecast, by Application 2019 & 2032
Frequently Asked Questions
1. What is the projected Compound Annual Growth Rate (CAGR) of the Bus On Board Charger Cpu?
The projected CAGR is approximately XXX%.
2. Which companies are prominent players in the Bus On Board Charger Cpu?
Key companies in the market include BYD, Nichicon, Tesla, Infineon, Panasonic, Aptiv, LG, Lear, Dilong Technology, Kongsberg, Kenergy, Wanma, IES, Anghua, Lester, Tonhe Technology.
3. What are the main segments of the Bus On Board Charger Cpu?
The market segments include Application, Type.
4. Can you provide details about the market size?
The market size is estimated to be USD XXX million as of 2022.
5. What are some drivers contributing to market growth?
N/A
6. What are the notable trends driving market growth?
N/A
7. Are there any restraints impacting market growth?
N/A
8. Can you provide examples of recent developments in the market?
N/A
9. What pricing options are available for accessing the report?
Pricing options include single-user, multi-user, and enterprise licenses priced at USD 3950.00, USD 5925.00, and USD 7900.00 respectively.
10. Is the market size provided in terms of value or volume?
The market size is provided in terms of value, measured in million and volume, measured in K.
11. Are there any specific market keywords associated with the report?
Yes, the market keyword associated with the report is "Bus On Board Charger Cpu," which aids in identifying and referencing the specific market segment covered.
12. How do I determine which pricing option suits my needs best?
The pricing options vary based on user requirements and access needs. Individual users may opt for single-user licenses, while businesses requiring broader access may choose multi-user or enterprise licenses for cost-effective access to the report.
13. Are there any additional resources or data provided in the Bus On Board Charger Cpu report?
While the report offers comprehensive insights, it's advisable to review the specific contents or supplementary materials provided to ascertain if additional resources or data are available.
14. How can I stay updated on further developments or reports in the Bus On Board Charger Cpu?
To stay informed about further developments, trends, and reports in the Bus On Board Charger Cpu, consider subscribing to industry newsletters, following relevant companies and organizations, or regularly checking reputable industry news sources and publications.
Methodology
Step 1 - Identification of Relevant Samples Size from Population Database


Step 2 - Approaches for Defining Global Market Size (Value, Volume* & Price*)

Note*: In applicable scenarios
Step 3 - Data Sources
Primary Research
- Web Analytics
- Survey Reports
- Research Institute
- Latest Research Reports
- Opinion Leaders
Secondary Research
- Annual Reports
- White Paper
- Latest Press Release
- Industry Association
- Paid Database
- Investor Presentations

Step 4 - Data Triangulation
Involves using different sources of information in order to increase the validity of a study
These sources are likely to be stakeholders in a program - participants, other researchers, program staff, other community members, and so on.
Then we put all data in single framework & apply various statistical tools to find out the dynamic on the market.
During the analysis stage, feedback from the stakeholder groups would be compared to determine areas of agreement as well as areas of divergence
