

Key Insights
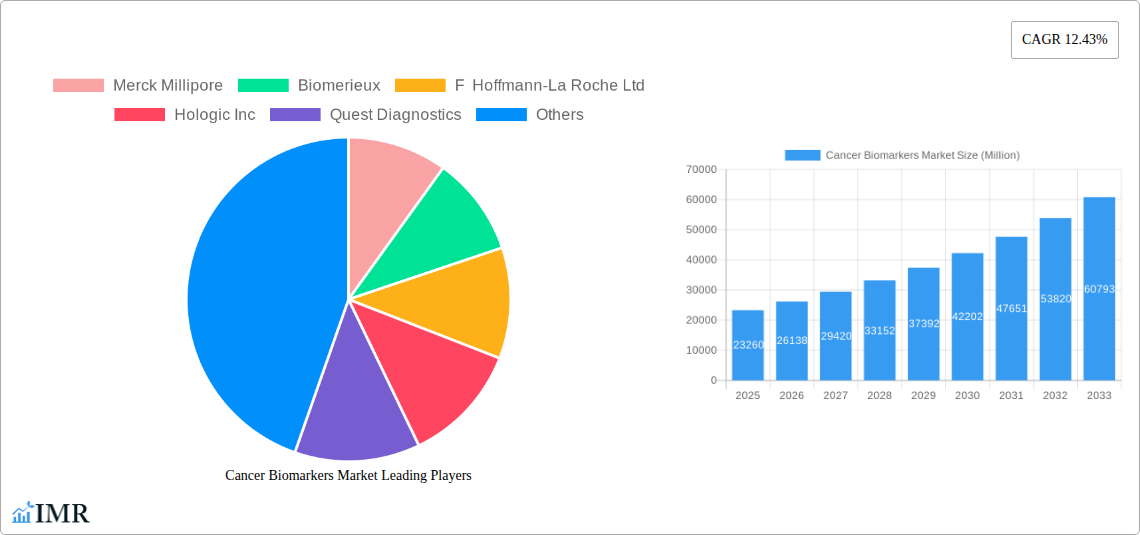
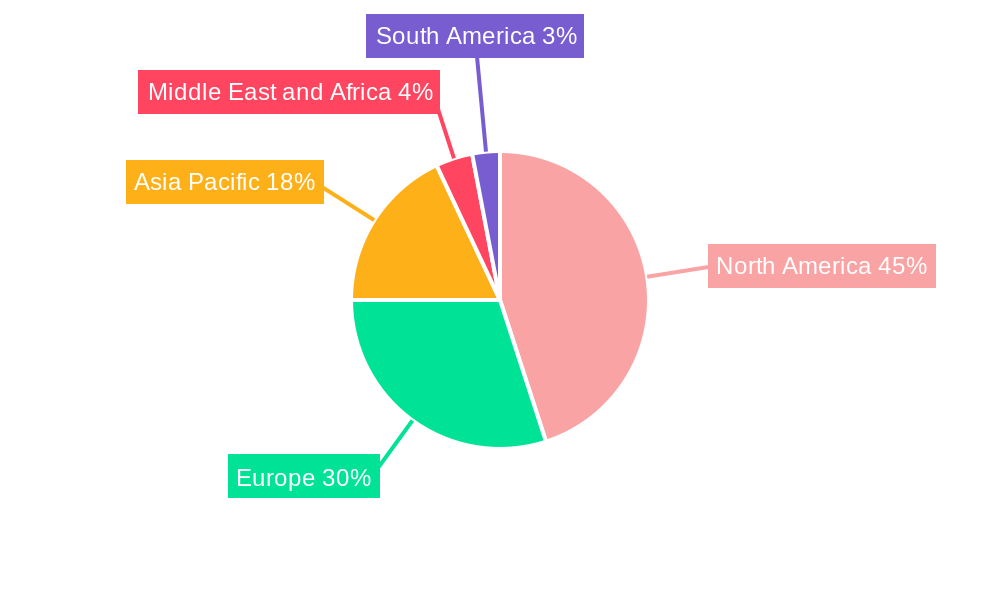
The global cancer biomarkers market, valued at $23.26 billion in 2025, is projected to experience robust growth, driven by a confluence of factors. The rising incidence of cancer globally, coupled with advancements in diagnostic technologies and personalized medicine approaches, fuels the demand for accurate and early cancer detection methods. Protein biomarkers, genetic biomarkers, and OMICS technologies are leading segments, contributing significantly to market expansion. The increasing adoption of minimally invasive diagnostic techniques and the growing awareness of early diagnosis among the population contribute further to market growth. North America currently holds a significant market share, attributed to well-established healthcare infrastructure, high healthcare expenditure, and the presence of major market players. However, the Asia-Pacific region is expected to witness substantial growth in the coming years, driven by rising healthcare spending, increasing cancer prevalence, and growing adoption of advanced diagnostic tools. The market is characterized by a competitive landscape with numerous key players actively engaged in research and development, mergers and acquisitions, and strategic partnerships to expand their market presence and offer innovative solutions. Furthermore, government initiatives promoting cancer research and early diagnosis contribute positively to the market outlook.
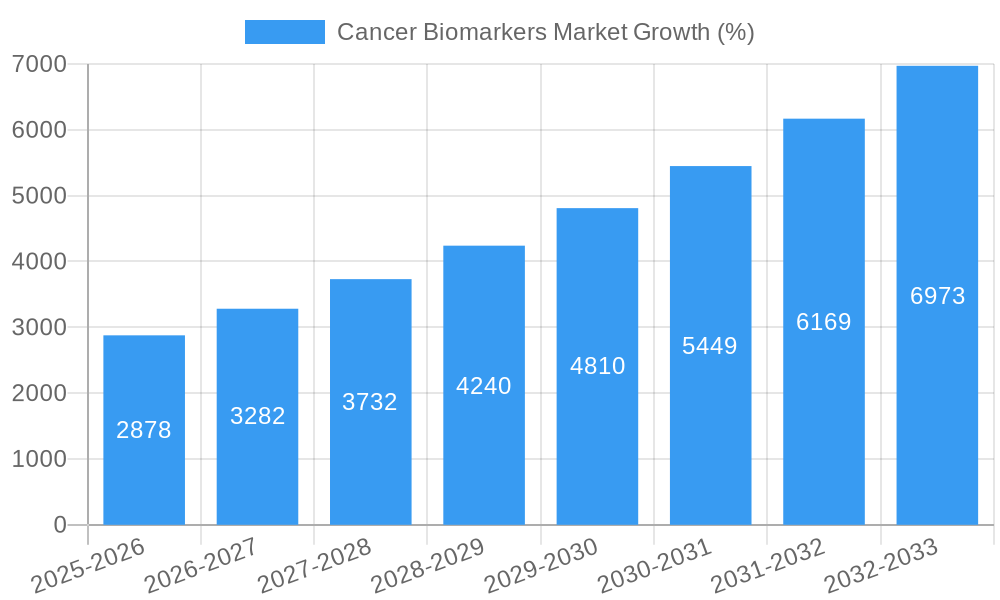
The market's expansion is not without challenges. High costs associated with biomarker development and testing can limit accessibility, particularly in low- and middle-income countries. The regulatory hurdles and approval processes for new biomarkers can also impede market growth. Despite these constraints, the overall outlook for the cancer biomarkers market remains positive, with significant growth opportunities across various segments and geographic regions. The continuous innovation in biomarker technologies, coupled with the growing need for precise and personalized cancer care, is anticipated to drive substantial market expansion throughout the forecast period (2025-2033). Technological advancements, including artificial intelligence and machine learning in biomarker analysis, are also expected to contribute to further market growth.
Cancer Biomarkers Market: A Comprehensive Market Report (2019-2033)
This in-depth report provides a comprehensive analysis of the Cancer Biomarkers Market, encompassing market dynamics, growth trends, regional segmentation, product landscape, key players, and future outlook. The study period covers 2019-2033, with 2025 as the base year and a forecast period of 2025-2033. The report segments the market by disease (Prostate Cancer, Breast Cancer, Lung Cancer, Colorectal Cancer, Cervical Cancer, Other Diseases), biomarker type (Protein Biomarkers, Genetic Biomarkers, Other Types), and profiling technology (OMICS Technology, Imaging Technology, Immunoassays, Others). The market is valued at XX Million in 2025 and is projected to reach XX Million by 2033, exhibiting a CAGR of XX%.
Cancer Biomarkers Market Market Dynamics & Structure
The Cancer Biomarkers Market is characterized by a moderately concentrated structure, with key players like Merck Millipore, Biomerieux, F. Hoffmann-La Roche Ltd, Hologic Inc, and others holding significant market share. Technological innovation, particularly in OMICS technologies and advanced imaging, is a primary driver of market growth. Stringent regulatory frameworks governing biomarker development and approval influence market dynamics, while the emergence of innovative diagnostic tools presents competitive substitutes. The market is primarily driven by an aging population, increasing cancer incidence rates, and growing demand for early diagnosis and personalized medicine. M&A activity within the sector is moderate, with xx deals recorded in the last five years, indicating strategic consolidation amongst players.
- Market Concentration: Moderately concentrated, with top 5 players holding approximately xx% market share in 2025.
- Technological Innovation: Rapid advancements in OMICS technologies (genomics, proteomics) and imaging techniques drive market growth.
- Regulatory Framework: Stringent regulatory approvals for new biomarkers influence market entry and expansion.
- Competitive Substitutes: Development of alternative diagnostic tools and technologies presents competitive pressure.
- End-User Demographics: Aging population and increasing cancer incidence rates fuel market demand.
- M&A Trends: Moderate M&A activity, with an estimated xx deals between 2020 and 2024.
Cancer Biomarkers Market Growth Trends & Insights
The Cancer Biomarkers Market has experienced significant growth during the historical period (2019-2024), driven by technological advancements and increasing adoption of personalized medicine. The market size is projected to expand considerably during the forecast period (2025-2033), fueled by rising cancer prevalence, improved healthcare infrastructure, and increased investments in research and development. The adoption rate of advanced biomarker technologies, such as liquid biopsies, is increasing rapidly, contributing to market expansion. Consumer behavior is shifting towards personalized therapies, further enhancing demand for accurate and reliable biomarkers. The market is witnessing a technological disruption with the advent of novel testing platforms and AI-powered diagnostic tools that promise higher accuracy and faster turnaround times.
Dominant Regions, Countries, or Segments in Cancer Biomarkers Market
North America currently dominates the Cancer Biomarkers Market, driven by robust healthcare infrastructure, high technological adoption, and substantial investments in cancer research. Within North America, the United States holds the largest market share due to high cancer incidence rates and significant funding for advanced diagnostic technologies. Europe is another significant market, with Germany and the United Kingdom emerging as prominent players. Among the disease segments, breast cancer and lung cancer contribute significantly to the market size due to their high prevalence. Within biomarker types, genetic biomarkers show considerable growth due to advancements in genomic sequencing technologies. OMICS technologies dominate the profiling technology segment due to their ability to analyze a large number of biomarkers simultaneously.
- Leading Region: North America (primarily the United States)
- Key Drivers: High cancer incidence, advanced healthcare infrastructure, substantial R&D investments, and increased adoption of personalized medicine.
- Growth Potential: High growth potential is observed in Asia-Pacific, driven by rising healthcare expenditure and increasing awareness of cancer prevention and early detection.
Cancer Biomarkers Market Product Landscape
The Cancer Biomarkers Market exhibits a diverse product landscape, encompassing a wide range of tests and assays for various cancer types. Product innovations focus on improving diagnostic accuracy, sensitivity, and specificity. Advanced technologies such as next-generation sequencing (NGS), digital PCR, and multiplex immunoassays are enabling the simultaneous detection of multiple biomarkers, facilitating earlier diagnosis and improved treatment outcomes. The unique selling propositions of leading products typically lie in their high sensitivity, speed, and ease of use. Technological advancements are concentrated on developing minimally invasive and cost-effective testing methods, such as liquid biopsies, that minimize patient discomfort and reduce overall healthcare costs.
Key Drivers, Barriers & Challenges in Cancer Biomarkers Market
Key Drivers: Technological advancements (NGS, liquid biopsies), increasing cancer incidence rates, rising demand for early diagnosis and personalized medicine, and growing investments in cancer research and development. Government initiatives promoting cancer awareness and early detection also contribute.
Key Challenges and Restraints: High cost of biomarker testing, stringent regulatory approvals, potential reimbursement issues, and the need for skilled professionals to interpret complex results pose significant challenges. Supply chain disruptions due to global events can impact the availability and affordability of reagents and instruments. The highly competitive market also restricts pricing power and profit margins for individual players. The complex regulatory environment can also lead to delays in approvals and the launch of new products.
Emerging Opportunities in Cancer Biomarkers Market
Significant opportunities exist in the development of liquid biopsy technologies, point-of-care diagnostics, and AI-powered biomarker analysis. Untapped markets exist in emerging economies, with significant growth potential in Asia-Pacific and Latin America. Innovative applications include early cancer detection in asymptomatic individuals and the development of biomarkers for monitoring treatment response and predicting recurrence. Evolving consumer preferences drive the demand for non-invasive testing methods and rapid turnaround times.
Growth Accelerators in the Cancer Biomarkers Market Industry
Technological breakthroughs in areas like single-cell analysis and spatial omics are poised to revolutionize the field. Strategic partnerships between diagnostic companies and pharmaceutical firms are enhancing the development and commercialization of targeted therapies based on biomarker profiles. Market expansion strategies, particularly in emerging economies with high cancer burdens, are also key growth catalysts. Increased government funding for research and development of novel biomarkers further propels market growth.
Key Players Shaping the Cancer Biomarkers Market Market
- Merck Millipore
- Biomerieux
- F. Hoffmann-La Roche Ltd
- Hologic Inc
- Quest Diagnostics
- Qiagen
- Thermo Fisher Scientific
- Illumina Inc
- Abbott Laboratories Inc
- Agilent Technologies
Notable Milestones in Cancer Biomarkers Market Sector
- February 2022: OncoDNA introduced the OncoDEEP Solid Tumor Biomarker Test Kit, providing labs with a comprehensive NGS solution.
- June 2022: Nonagen Bioscience received CE marking for its Oncuria immunoassay for bladder cancer, offering a novel multiplex urine test.
In-Depth Cancer Biomarkers Market Market Outlook
The Cancer Biomarkers Market holds significant future potential, driven by continuous technological advancements and the increasing adoption of precision oncology. Strategic opportunities lie in developing novel biomarkers for early detection, monitoring treatment response, and predicting drug resistance. The market's future growth will be fueled by a strong focus on personalized medicine, the development of minimally invasive diagnostic techniques, and the expansion into underserved markets globally. Further investments in R&D and strategic collaborations will significantly shape the market landscape in the coming years.
Cancer Biomarkers Market Segmentation
-
1. Disease
- 1.1. Prostate Cancer
- 1.2. Breast Cancer
- 1.3. Lung Cancer
- 1.4. Colorectal Cancer
- 1.5. Cervical Cancer
- 1.6. Other Diseases
-
2. Type
- 2.1. Protein Biomarkers
- 2.2. Genetic Biomarkers
- 2.3. Other Types
-
3. Profiling Technology
- 3.1. OMICS Technology
- 3.2. Imaging Technology
- 3.3. Immunoassays
- 3.4. Others
Cancer Biomarkers Market Segmentation By Geography
-
1. North America
- 1.1. United States
- 1.2. Canada
- 1.3. Mexico
-
2. Europe
- 2.1. Germany
- 2.2. United Kingdom
- 2.3. France
- 2.4. Italy
- 2.5. Spain
- 2.6. Rest of Europe
-
3. Asia Pacific
- 3.1. China
- 3.2. Japan
- 3.3. India
- 3.4. Australia
- 3.5. South Korea
- 3.6. Rest of Asia Pacific
-
4. Middle East and Africa
- 4.1. GCC
- 4.2. South Africa
- 4.3. Rest of Middle East and Africa
-
5. South America
- 5.1. Brazil
- 5.2. Argentina
- 5.3. Rest of South America
Cancer Biomarkers Market REPORT HIGHLIGHTS
| Aspects | Details |
|---|---|
| Study Period | 2019-2033 |
| Base Year | 2024 |
| Estimated Year | 2025 |
| Forecast Period | 2025-2033 |
| Historical Period | 2019-2024 |
| Growth Rate | CAGR of 12.43% from 2019-2033 |
| Segmentation |
|
Table of Contents
- 1. Introduction
- 1.1. Research Scope
- 1.2. Market Segmentation
- 1.3. Research Methodology
- 1.4. Definitions and Assumptions
- 2. Executive Summary
- 2.1. Introduction
- 3. Market Dynamics
- 3.1. Introduction
- 3.2. Market Drivers
- 3.2.1. Surge in Prevalence of Cancer Across the Globe; Paradigm Shift in Healthcare from Disease Diagnosis to Risk Assessment or Early Diagnosis; Increasing Focus on Innovative Drug Development
- 3.3. Market Restrains
- 3.3.1. High Cost of Cancer Diagnosis with Biomarkers; Reimbursement Issues with Biomarker Testing
- 3.4. Market Trends
- 3.4.1. Lung Cancer Segment is Expected to Hold a Significant Market Share in the Cancer Biomarkers Market
- 4. Market Factor Analysis
- 4.1. Porters Five Forces
- 4.2. Supply/Value Chain
- 4.3. PESTEL analysis
- 4.4. Market Entropy
- 4.5. Patent/Trademark Analysis
- 5. Global Cancer Biomarkers Market Analysis, Insights and Forecast, 2019-2031
- 5.1. Market Analysis, Insights and Forecast - by Disease
- 5.1.1. Prostate Cancer
- 5.1.2. Breast Cancer
- 5.1.3. Lung Cancer
- 5.1.4. Colorectal Cancer
- 5.1.5. Cervical Cancer
- 5.1.6. Other Diseases
- 5.2. Market Analysis, Insights and Forecast - by Type
- 5.2.1. Protein Biomarkers
- 5.2.2. Genetic Biomarkers
- 5.2.3. Other Types
- 5.3. Market Analysis, Insights and Forecast - by Profiling Technology
- 5.3.1. OMICS Technology
- 5.3.2. Imaging Technology
- 5.3.3. Immunoassays
- 5.3.4. Others
- 5.4. Market Analysis, Insights and Forecast - by Region
- 5.4.1. North America
- 5.4.2. Europe
- 5.4.3. Asia Pacific
- 5.4.4. Middle East and Africa
- 5.4.5. South America
- 5.1. Market Analysis, Insights and Forecast - by Disease
- 6. North America Cancer Biomarkers Market Analysis, Insights and Forecast, 2019-2031
- 6.1. Market Analysis, Insights and Forecast - by Disease
- 6.1.1. Prostate Cancer
- 6.1.2. Breast Cancer
- 6.1.3. Lung Cancer
- 6.1.4. Colorectal Cancer
- 6.1.5. Cervical Cancer
- 6.1.6. Other Diseases
- 6.2. Market Analysis, Insights and Forecast - by Type
- 6.2.1. Protein Biomarkers
- 6.2.2. Genetic Biomarkers
- 6.2.3. Other Types
- 6.3. Market Analysis, Insights and Forecast - by Profiling Technology
- 6.3.1. OMICS Technology
- 6.3.2. Imaging Technology
- 6.3.3. Immunoassays
- 6.3.4. Others
- 6.1. Market Analysis, Insights and Forecast - by Disease
- 7. Europe Cancer Biomarkers Market Analysis, Insights and Forecast, 2019-2031
- 7.1. Market Analysis, Insights and Forecast - by Disease
- 7.1.1. Prostate Cancer
- 7.1.2. Breast Cancer
- 7.1.3. Lung Cancer
- 7.1.4. Colorectal Cancer
- 7.1.5. Cervical Cancer
- 7.1.6. Other Diseases
- 7.2. Market Analysis, Insights and Forecast - by Type
- 7.2.1. Protein Biomarkers
- 7.2.2. Genetic Biomarkers
- 7.2.3. Other Types
- 7.3. Market Analysis, Insights and Forecast - by Profiling Technology
- 7.3.1. OMICS Technology
- 7.3.2. Imaging Technology
- 7.3.3. Immunoassays
- 7.3.4. Others
- 7.1. Market Analysis, Insights and Forecast - by Disease
- 8. Asia Pacific Cancer Biomarkers Market Analysis, Insights and Forecast, 2019-2031
- 8.1. Market Analysis, Insights and Forecast - by Disease
- 8.1.1. Prostate Cancer
- 8.1.2. Breast Cancer
- 8.1.3. Lung Cancer
- 8.1.4. Colorectal Cancer
- 8.1.5. Cervical Cancer
- 8.1.6. Other Diseases
- 8.2. Market Analysis, Insights and Forecast - by Type
- 8.2.1. Protein Biomarkers
- 8.2.2. Genetic Biomarkers
- 8.2.3. Other Types
- 8.3. Market Analysis, Insights and Forecast - by Profiling Technology
- 8.3.1. OMICS Technology
- 8.3.2. Imaging Technology
- 8.3.3. Immunoassays
- 8.3.4. Others
- 8.1. Market Analysis, Insights and Forecast - by Disease
- 9. Middle East and Africa Cancer Biomarkers Market Analysis, Insights and Forecast, 2019-2031
- 9.1. Market Analysis, Insights and Forecast - by Disease
- 9.1.1. Prostate Cancer
- 9.1.2. Breast Cancer
- 9.1.3. Lung Cancer
- 9.1.4. Colorectal Cancer
- 9.1.5. Cervical Cancer
- 9.1.6. Other Diseases
- 9.2. Market Analysis, Insights and Forecast - by Type
- 9.2.1. Protein Biomarkers
- 9.2.2. Genetic Biomarkers
- 9.2.3. Other Types
- 9.3. Market Analysis, Insights and Forecast - by Profiling Technology
- 9.3.1. OMICS Technology
- 9.3.2. Imaging Technology
- 9.3.3. Immunoassays
- 9.3.4. Others
- 9.1. Market Analysis, Insights and Forecast - by Disease
- 10. South America Cancer Biomarkers Market Analysis, Insights and Forecast, 2019-2031
- 10.1. Market Analysis, Insights and Forecast - by Disease
- 10.1.1. Prostate Cancer
- 10.1.2. Breast Cancer
- 10.1.3. Lung Cancer
- 10.1.4. Colorectal Cancer
- 10.1.5. Cervical Cancer
- 10.1.6. Other Diseases
- 10.2. Market Analysis, Insights and Forecast - by Type
- 10.2.1. Protein Biomarkers
- 10.2.2. Genetic Biomarkers
- 10.2.3. Other Types
- 10.3. Market Analysis, Insights and Forecast - by Profiling Technology
- 10.3.1. OMICS Technology
- 10.3.2. Imaging Technology
- 10.3.3. Immunoassays
- 10.3.4. Others
- 10.1. Market Analysis, Insights and Forecast - by Disease
- 11. North America Cancer Biomarkers Market Analysis, Insights and Forecast, 2019-2031
- 11.1. Market Analysis, Insights and Forecast - By Country/Sub-region
- 11.1.1 United States
- 11.1.2 Canada
- 11.1.3 Mexico
- 12. Europe Cancer Biomarkers Market Analysis, Insights and Forecast, 2019-2031
- 12.1. Market Analysis, Insights and Forecast - By Country/Sub-region
- 12.1.1 Germany
- 12.1.2 United Kingdom
- 12.1.3 France
- 12.1.4 Italy
- 12.1.5 Spain
- 12.1.6 Rest of Europe
- 13. Asia Pacific Cancer Biomarkers Market Analysis, Insights and Forecast, 2019-2031
- 13.1. Market Analysis, Insights and Forecast - By Country/Sub-region
- 13.1.1 China
- 13.1.2 Japan
- 13.1.3 India
- 13.1.4 Australia
- 13.1.5 South Korea
- 13.1.6 Rest of Asia Pacific
- 14. Middle East and Africa Cancer Biomarkers Market Analysis, Insights and Forecast, 2019-2031
- 14.1. Market Analysis, Insights and Forecast - By Country/Sub-region
- 14.1.1 GCC
- 14.1.2 South Africa
- 14.1.3 Rest of Middle East and Africa
- 15. South America Cancer Biomarkers Market Analysis, Insights and Forecast, 2019-2031
- 15.1. Market Analysis, Insights and Forecast - By Country/Sub-region
- 15.1.1 Brazil
- 15.1.2 Argentina
- 15.1.3 Rest of South America
- 16. Competitive Analysis
- 16.1. Global Market Share Analysis 2024
- 16.2. Company Profiles
- 16.2.1 Merck Millipore
- 16.2.1.1. Overview
- 16.2.1.2. Products
- 16.2.1.3. SWOT Analysis
- 16.2.1.4. Recent Developments
- 16.2.1.5. Financials (Based on Availability)
- 16.2.2 Biomerieux
- 16.2.2.1. Overview
- 16.2.2.2. Products
- 16.2.2.3. SWOT Analysis
- 16.2.2.4. Recent Developments
- 16.2.2.5. Financials (Based on Availability)
- 16.2.3 F Hoffmann-La Roche Ltd
- 16.2.3.1. Overview
- 16.2.3.2. Products
- 16.2.3.3. SWOT Analysis
- 16.2.3.4. Recent Developments
- 16.2.3.5. Financials (Based on Availability)
- 16.2.4 Hologic Inc
- 16.2.4.1. Overview
- 16.2.4.2. Products
- 16.2.4.3. SWOT Analysis
- 16.2.4.4. Recent Developments
- 16.2.4.5. Financials (Based on Availability)
- 16.2.5 Quest Diagnostics
- 16.2.5.1. Overview
- 16.2.5.2. Products
- 16.2.5.3. SWOT Analysis
- 16.2.5.4. Recent Developments
- 16.2.5.5. Financials (Based on Availability)
- 16.2.6 Qiagen
- 16.2.6.1. Overview
- 16.2.6.2. Products
- 16.2.6.3. SWOT Analysis
- 16.2.6.4. Recent Developments
- 16.2.6.5. Financials (Based on Availability)
- 16.2.7 Thermo Fisher Scientific
- 16.2.7.1. Overview
- 16.2.7.2. Products
- 16.2.7.3. SWOT Analysis
- 16.2.7.4. Recent Developments
- 16.2.7.5. Financials (Based on Availability)
- 16.2.8 Illumina Inc
- 16.2.8.1. Overview
- 16.2.8.2. Products
- 16.2.8.3. SWOT Analysis
- 16.2.8.4. Recent Developments
- 16.2.8.5. Financials (Based on Availability)
- 16.2.9 Abbott Laboratories Inc
- 16.2.9.1. Overview
- 16.2.9.2. Products
- 16.2.9.3. SWOT Analysis
- 16.2.9.4. Recent Developments
- 16.2.9.5. Financials (Based on Availability)
- 16.2.10 Agilent Technologies
- 16.2.10.1. Overview
- 16.2.10.2. Products
- 16.2.10.3. SWOT Analysis
- 16.2.10.4. Recent Developments
- 16.2.10.5. Financials (Based on Availability)
- 16.2.1 Merck Millipore
List of Figures
- Figure 1: Global Cancer Biomarkers Market Revenue Breakdown (Million, %) by Region 2024 & 2032
- Figure 2: Global Cancer Biomarkers Market Volume Breakdown (K Unit, %) by Region 2024 & 2032
- Figure 3: North America Cancer Biomarkers Market Revenue (Million), by Country 2024 & 2032
- Figure 4: North America Cancer Biomarkers Market Volume (K Unit), by Country 2024 & 2032
- Figure 5: North America Cancer Biomarkers Market Revenue Share (%), by Country 2024 & 2032
- Figure 6: North America Cancer Biomarkers Market Volume Share (%), by Country 2024 & 2032
- Figure 7: Europe Cancer Biomarkers Market Revenue (Million), by Country 2024 & 2032
- Figure 8: Europe Cancer Biomarkers Market Volume (K Unit), by Country 2024 & 2032
- Figure 9: Europe Cancer Biomarkers Market Revenue Share (%), by Country 2024 & 2032
- Figure 10: Europe Cancer Biomarkers Market Volume Share (%), by Country 2024 & 2032
- Figure 11: Asia Pacific Cancer Biomarkers Market Revenue (Million), by Country 2024 & 2032
- Figure 12: Asia Pacific Cancer Biomarkers Market Volume (K Unit), by Country 2024 & 2032
- Figure 13: Asia Pacific Cancer Biomarkers Market Revenue Share (%), by Country 2024 & 2032
- Figure 14: Asia Pacific Cancer Biomarkers Market Volume Share (%), by Country 2024 & 2032
- Figure 15: Middle East and Africa Cancer Biomarkers Market Revenue (Million), by Country 2024 & 2032
- Figure 16: Middle East and Africa Cancer Biomarkers Market Volume (K Unit), by Country 2024 & 2032
- Figure 17: Middle East and Africa Cancer Biomarkers Market Revenue Share (%), by Country 2024 & 2032
- Figure 18: Middle East and Africa Cancer Biomarkers Market Volume Share (%), by Country 2024 & 2032
- Figure 19: South America Cancer Biomarkers Market Revenue (Million), by Country 2024 & 2032
- Figure 20: South America Cancer Biomarkers Market Volume (K Unit), by Country 2024 & 2032
- Figure 21: South America Cancer Biomarkers Market Revenue Share (%), by Country 2024 & 2032
- Figure 22: South America Cancer Biomarkers Market Volume Share (%), by Country 2024 & 2032
- Figure 23: North America Cancer Biomarkers Market Revenue (Million), by Disease 2024 & 2032
- Figure 24: North America Cancer Biomarkers Market Volume (K Unit), by Disease 2024 & 2032
- Figure 25: North America Cancer Biomarkers Market Revenue Share (%), by Disease 2024 & 2032
- Figure 26: North America Cancer Biomarkers Market Volume Share (%), by Disease 2024 & 2032
- Figure 27: North America Cancer Biomarkers Market Revenue (Million), by Type 2024 & 2032
- Figure 28: North America Cancer Biomarkers Market Volume (K Unit), by Type 2024 & 2032
- Figure 29: North America Cancer Biomarkers Market Revenue Share (%), by Type 2024 & 2032
- Figure 30: North America Cancer Biomarkers Market Volume Share (%), by Type 2024 & 2032
- Figure 31: North America Cancer Biomarkers Market Revenue (Million), by Profiling Technology 2024 & 2032
- Figure 32: North America Cancer Biomarkers Market Volume (K Unit), by Profiling Technology 2024 & 2032
- Figure 33: North America Cancer Biomarkers Market Revenue Share (%), by Profiling Technology 2024 & 2032
- Figure 34: North America Cancer Biomarkers Market Volume Share (%), by Profiling Technology 2024 & 2032
- Figure 35: North America Cancer Biomarkers Market Revenue (Million), by Country 2024 & 2032
- Figure 36: North America Cancer Biomarkers Market Volume (K Unit), by Country 2024 & 2032
- Figure 37: North America Cancer Biomarkers Market Revenue Share (%), by Country 2024 & 2032
- Figure 38: North America Cancer Biomarkers Market Volume Share (%), by Country 2024 & 2032
- Figure 39: Europe Cancer Biomarkers Market Revenue (Million), by Disease 2024 & 2032
- Figure 40: Europe Cancer Biomarkers Market Volume (K Unit), by Disease 2024 & 2032
- Figure 41: Europe Cancer Biomarkers Market Revenue Share (%), by Disease 2024 & 2032
- Figure 42: Europe Cancer Biomarkers Market Volume Share (%), by Disease 2024 & 2032
- Figure 43: Europe Cancer Biomarkers Market Revenue (Million), by Type 2024 & 2032
- Figure 44: Europe Cancer Biomarkers Market Volume (K Unit), by Type 2024 & 2032
- Figure 45: Europe Cancer Biomarkers Market Revenue Share (%), by Type 2024 & 2032
- Figure 46: Europe Cancer Biomarkers Market Volume Share (%), by Type 2024 & 2032
- Figure 47: Europe Cancer Biomarkers Market Revenue (Million), by Profiling Technology 2024 & 2032
- Figure 48: Europe Cancer Biomarkers Market Volume (K Unit), by Profiling Technology 2024 & 2032
- Figure 49: Europe Cancer Biomarkers Market Revenue Share (%), by Profiling Technology 2024 & 2032
- Figure 50: Europe Cancer Biomarkers Market Volume Share (%), by Profiling Technology 2024 & 2032
- Figure 51: Europe Cancer Biomarkers Market Revenue (Million), by Country 2024 & 2032
- Figure 52: Europe Cancer Biomarkers Market Volume (K Unit), by Country 2024 & 2032
- Figure 53: Europe Cancer Biomarkers Market Revenue Share (%), by Country 2024 & 2032
- Figure 54: Europe Cancer Biomarkers Market Volume Share (%), by Country 2024 & 2032
- Figure 55: Asia Pacific Cancer Biomarkers Market Revenue (Million), by Disease 2024 & 2032
- Figure 56: Asia Pacific Cancer Biomarkers Market Volume (K Unit), by Disease 2024 & 2032
- Figure 57: Asia Pacific Cancer Biomarkers Market Revenue Share (%), by Disease 2024 & 2032
- Figure 58: Asia Pacific Cancer Biomarkers Market Volume Share (%), by Disease 2024 & 2032
- Figure 59: Asia Pacific Cancer Biomarkers Market Revenue (Million), by Type 2024 & 2032
- Figure 60: Asia Pacific Cancer Biomarkers Market Volume (K Unit), by Type 2024 & 2032
- Figure 61: Asia Pacific Cancer Biomarkers Market Revenue Share (%), by Type 2024 & 2032
- Figure 62: Asia Pacific Cancer Biomarkers Market Volume Share (%), by Type 2024 & 2032
- Figure 63: Asia Pacific Cancer Biomarkers Market Revenue (Million), by Profiling Technology 2024 & 2032
- Figure 64: Asia Pacific Cancer Biomarkers Market Volume (K Unit), by Profiling Technology 2024 & 2032
- Figure 65: Asia Pacific Cancer Biomarkers Market Revenue Share (%), by Profiling Technology 2024 & 2032
- Figure 66: Asia Pacific Cancer Biomarkers Market Volume Share (%), by Profiling Technology 2024 & 2032
- Figure 67: Asia Pacific Cancer Biomarkers Market Revenue (Million), by Country 2024 & 2032
- Figure 68: Asia Pacific Cancer Biomarkers Market Volume (K Unit), by Country 2024 & 2032
- Figure 69: Asia Pacific Cancer Biomarkers Market Revenue Share (%), by Country 2024 & 2032
- Figure 70: Asia Pacific Cancer Biomarkers Market Volume Share (%), by Country 2024 & 2032
- Figure 71: Middle East and Africa Cancer Biomarkers Market Revenue (Million), by Disease 2024 & 2032
- Figure 72: Middle East and Africa Cancer Biomarkers Market Volume (K Unit), by Disease 2024 & 2032
- Figure 73: Middle East and Africa Cancer Biomarkers Market Revenue Share (%), by Disease 2024 & 2032
- Figure 74: Middle East and Africa Cancer Biomarkers Market Volume Share (%), by Disease 2024 & 2032
- Figure 75: Middle East and Africa Cancer Biomarkers Market Revenue (Million), by Type 2024 & 2032
- Figure 76: Middle East and Africa Cancer Biomarkers Market Volume (K Unit), by Type 2024 & 2032
- Figure 77: Middle East and Africa Cancer Biomarkers Market Revenue Share (%), by Type 2024 & 2032
- Figure 78: Middle East and Africa Cancer Biomarkers Market Volume Share (%), by Type 2024 & 2032
- Figure 79: Middle East and Africa Cancer Biomarkers Market Revenue (Million), by Profiling Technology 2024 & 2032
- Figure 80: Middle East and Africa Cancer Biomarkers Market Volume (K Unit), by Profiling Technology 2024 & 2032
- Figure 81: Middle East and Africa Cancer Biomarkers Market Revenue Share (%), by Profiling Technology 2024 & 2032
- Figure 82: Middle East and Africa Cancer Biomarkers Market Volume Share (%), by Profiling Technology 2024 & 2032
- Figure 83: Middle East and Africa Cancer Biomarkers Market Revenue (Million), by Country 2024 & 2032
- Figure 84: Middle East and Africa Cancer Biomarkers Market Volume (K Unit), by Country 2024 & 2032
- Figure 85: Middle East and Africa Cancer Biomarkers Market Revenue Share (%), by Country 2024 & 2032
- Figure 86: Middle East and Africa Cancer Biomarkers Market Volume Share (%), by Country 2024 & 2032
- Figure 87: South America Cancer Biomarkers Market Revenue (Million), by Disease 2024 & 2032
- Figure 88: South America Cancer Biomarkers Market Volume (K Unit), by Disease 2024 & 2032
- Figure 89: South America Cancer Biomarkers Market Revenue Share (%), by Disease 2024 & 2032
- Figure 90: South America Cancer Biomarkers Market Volume Share (%), by Disease 2024 & 2032
- Figure 91: South America Cancer Biomarkers Market Revenue (Million), by Type 2024 & 2032
- Figure 92: South America Cancer Biomarkers Market Volume (K Unit), by Type 2024 & 2032
- Figure 93: South America Cancer Biomarkers Market Revenue Share (%), by Type 2024 & 2032
- Figure 94: South America Cancer Biomarkers Market Volume Share (%), by Type 2024 & 2032
- Figure 95: South America Cancer Biomarkers Market Revenue (Million), by Profiling Technology 2024 & 2032
- Figure 96: South America Cancer Biomarkers Market Volume (K Unit), by Profiling Technology 2024 & 2032
- Figure 97: South America Cancer Biomarkers Market Revenue Share (%), by Profiling Technology 2024 & 2032
- Figure 98: South America Cancer Biomarkers Market Volume Share (%), by Profiling Technology 2024 & 2032
- Figure 99: South America Cancer Biomarkers Market Revenue (Million), by Country 2024 & 2032
- Figure 100: South America Cancer Biomarkers Market Volume (K Unit), by Country 2024 & 2032
- Figure 101: South America Cancer Biomarkers Market Revenue Share (%), by Country 2024 & 2032
- Figure 102: South America Cancer Biomarkers Market Volume Share (%), by Country 2024 & 2032
List of Tables
- Table 1: Global Cancer Biomarkers Market Revenue Million Forecast, by Region 2019 & 2032
- Table 2: Global Cancer Biomarkers Market Volume K Unit Forecast, by Region 2019 & 2032
- Table 3: Global Cancer Biomarkers Market Revenue Million Forecast, by Disease 2019 & 2032
- Table 4: Global Cancer Biomarkers Market Volume K Unit Forecast, by Disease 2019 & 2032
- Table 5: Global Cancer Biomarkers Market Revenue Million Forecast, by Type 2019 & 2032
- Table 6: Global Cancer Biomarkers Market Volume K Unit Forecast, by Type 2019 & 2032
- Table 7: Global Cancer Biomarkers Market Revenue Million Forecast, by Profiling Technology 2019 & 2032
- Table 8: Global Cancer Biomarkers Market Volume K Unit Forecast, by Profiling Technology 2019 & 2032
- Table 9: Global Cancer Biomarkers Market Revenue Million Forecast, by Region 2019 & 2032
- Table 10: Global Cancer Biomarkers Market Volume K Unit Forecast, by Region 2019 & 2032
- Table 11: Global Cancer Biomarkers Market Revenue Million Forecast, by Country 2019 & 2032
- Table 12: Global Cancer Biomarkers Market Volume K Unit Forecast, by Country 2019 & 2032
- Table 13: United States Cancer Biomarkers Market Revenue (Million) Forecast, by Application 2019 & 2032
- Table 14: United States Cancer Biomarkers Market Volume (K Unit) Forecast, by Application 2019 & 2032
- Table 15: Canada Cancer Biomarkers Market Revenue (Million) Forecast, by Application 2019 & 2032
- Table 16: Canada Cancer Biomarkers Market Volume (K Unit) Forecast, by Application 2019 & 2032
- Table 17: Mexico Cancer Biomarkers Market Revenue (Million) Forecast, by Application 2019 & 2032
- Table 18: Mexico Cancer Biomarkers Market Volume (K Unit) Forecast, by Application 2019 & 2032
- Table 19: Global Cancer Biomarkers Market Revenue Million Forecast, by Country 2019 & 2032
- Table 20: Global Cancer Biomarkers Market Volume K Unit Forecast, by Country 2019 & 2032
- Table 21: Germany Cancer Biomarkers Market Revenue (Million) Forecast, by Application 2019 & 2032
- Table 22: Germany Cancer Biomarkers Market Volume (K Unit) Forecast, by Application 2019 & 2032
- Table 23: United Kingdom Cancer Biomarkers Market Revenue (Million) Forecast, by Application 2019 & 2032
- Table 24: United Kingdom Cancer Biomarkers Market Volume (K Unit) Forecast, by Application 2019 & 2032
- Table 25: France Cancer Biomarkers Market Revenue (Million) Forecast, by Application 2019 & 2032
- Table 26: France Cancer Biomarkers Market Volume (K Unit) Forecast, by Application 2019 & 2032
- Table 27: Italy Cancer Biomarkers Market Revenue (Million) Forecast, by Application 2019 & 2032
- Table 28: Italy Cancer Biomarkers Market Volume (K Unit) Forecast, by Application 2019 & 2032
- Table 29: Spain Cancer Biomarkers Market Revenue (Million) Forecast, by Application 2019 & 2032
- Table 30: Spain Cancer Biomarkers Market Volume (K Unit) Forecast, by Application 2019 & 2032
- Table 31: Rest of Europe Cancer Biomarkers Market Revenue (Million) Forecast, by Application 2019 & 2032
- Table 32: Rest of Europe Cancer Biomarkers Market Volume (K Unit) Forecast, by Application 2019 & 2032
- Table 33: Global Cancer Biomarkers Market Revenue Million Forecast, by Country 2019 & 2032
- Table 34: Global Cancer Biomarkers Market Volume K Unit Forecast, by Country 2019 & 2032
- Table 35: China Cancer Biomarkers Market Revenue (Million) Forecast, by Application 2019 & 2032
- Table 36: China Cancer Biomarkers Market Volume (K Unit) Forecast, by Application 2019 & 2032
- Table 37: Japan Cancer Biomarkers Market Revenue (Million) Forecast, by Application 2019 & 2032
- Table 38: Japan Cancer Biomarkers Market Volume (K Unit) Forecast, by Application 2019 & 2032
- Table 39: India Cancer Biomarkers Market Revenue (Million) Forecast, by Application 2019 & 2032
- Table 40: India Cancer Biomarkers Market Volume (K Unit) Forecast, by Application 2019 & 2032
- Table 41: Australia Cancer Biomarkers Market Revenue (Million) Forecast, by Application 2019 & 2032
- Table 42: Australia Cancer Biomarkers Market Volume (K Unit) Forecast, by Application 2019 & 2032
- Table 43: South Korea Cancer Biomarkers Market Revenue (Million) Forecast, by Application 2019 & 2032
- Table 44: South Korea Cancer Biomarkers Market Volume (K Unit) Forecast, by Application 2019 & 2032
- Table 45: Rest of Asia Pacific Cancer Biomarkers Market Revenue (Million) Forecast, by Application 2019 & 2032
- Table 46: Rest of Asia Pacific Cancer Biomarkers Market Volume (K Unit) Forecast, by Application 2019 & 2032
- Table 47: Global Cancer Biomarkers Market Revenue Million Forecast, by Country 2019 & 2032
- Table 48: Global Cancer Biomarkers Market Volume K Unit Forecast, by Country 2019 & 2032
- Table 49: GCC Cancer Biomarkers Market Revenue (Million) Forecast, by Application 2019 & 2032
- Table 50: GCC Cancer Biomarkers Market Volume (K Unit) Forecast, by Application 2019 & 2032
- Table 51: South Africa Cancer Biomarkers Market Revenue (Million) Forecast, by Application 2019 & 2032
- Table 52: South Africa Cancer Biomarkers Market Volume (K Unit) Forecast, by Application 2019 & 2032
- Table 53: Rest of Middle East and Africa Cancer Biomarkers Market Revenue (Million) Forecast, by Application 2019 & 2032
- Table 54: Rest of Middle East and Africa Cancer Biomarkers Market Volume (K Unit) Forecast, by Application 2019 & 2032
- Table 55: Global Cancer Biomarkers Market Revenue Million Forecast, by Country 2019 & 2032
- Table 56: Global Cancer Biomarkers Market Volume K Unit Forecast, by Country 2019 & 2032
- Table 57: Brazil Cancer Biomarkers Market Revenue (Million) Forecast, by Application 2019 & 2032
- Table 58: Brazil Cancer Biomarkers Market Volume (K Unit) Forecast, by Application 2019 & 2032
- Table 59: Argentina Cancer Biomarkers Market Revenue (Million) Forecast, by Application 2019 & 2032
- Table 60: Argentina Cancer Biomarkers Market Volume (K Unit) Forecast, by Application 2019 & 2032
- Table 61: Rest of South America Cancer Biomarkers Market Revenue (Million) Forecast, by Application 2019 & 2032
- Table 62: Rest of South America Cancer Biomarkers Market Volume (K Unit) Forecast, by Application 2019 & 2032
- Table 63: Global Cancer Biomarkers Market Revenue Million Forecast, by Disease 2019 & 2032
- Table 64: Global Cancer Biomarkers Market Volume K Unit Forecast, by Disease 2019 & 2032
- Table 65: Global Cancer Biomarkers Market Revenue Million Forecast, by Type 2019 & 2032
- Table 66: Global Cancer Biomarkers Market Volume K Unit Forecast, by Type 2019 & 2032
- Table 67: Global Cancer Biomarkers Market Revenue Million Forecast, by Profiling Technology 2019 & 2032
- Table 68: Global Cancer Biomarkers Market Volume K Unit Forecast, by Profiling Technology 2019 & 2032
- Table 69: Global Cancer Biomarkers Market Revenue Million Forecast, by Country 2019 & 2032
- Table 70: Global Cancer Biomarkers Market Volume K Unit Forecast, by Country 2019 & 2032
- Table 71: United States Cancer Biomarkers Market Revenue (Million) Forecast, by Application 2019 & 2032
- Table 72: United States Cancer Biomarkers Market Volume (K Unit) Forecast, by Application 2019 & 2032
- Table 73: Canada Cancer Biomarkers Market Revenue (Million) Forecast, by Application 2019 & 2032
- Table 74: Canada Cancer Biomarkers Market Volume (K Unit) Forecast, by Application 2019 & 2032
- Table 75: Mexico Cancer Biomarkers Market Revenue (Million) Forecast, by Application 2019 & 2032
- Table 76: Mexico Cancer Biomarkers Market Volume (K Unit) Forecast, by Application 2019 & 2032
- Table 77: Global Cancer Biomarkers Market Revenue Million Forecast, by Disease 2019 & 2032
- Table 78: Global Cancer Biomarkers Market Volume K Unit Forecast, by Disease 2019 & 2032
- Table 79: Global Cancer Biomarkers Market Revenue Million Forecast, by Type 2019 & 2032
- Table 80: Global Cancer Biomarkers Market Volume K Unit Forecast, by Type 2019 & 2032
- Table 81: Global Cancer Biomarkers Market Revenue Million Forecast, by Profiling Technology 2019 & 2032
- Table 82: Global Cancer Biomarkers Market Volume K Unit Forecast, by Profiling Technology 2019 & 2032
- Table 83: Global Cancer Biomarkers Market Revenue Million Forecast, by Country 2019 & 2032
- Table 84: Global Cancer Biomarkers Market Volume K Unit Forecast, by Country 2019 & 2032
- Table 85: Germany Cancer Biomarkers Market Revenue (Million) Forecast, by Application 2019 & 2032
- Table 86: Germany Cancer Biomarkers Market Volume (K Unit) Forecast, by Application 2019 & 2032
- Table 87: United Kingdom Cancer Biomarkers Market Revenue (Million) Forecast, by Application 2019 & 2032
- Table 88: United Kingdom Cancer Biomarkers Market Volume (K Unit) Forecast, by Application 2019 & 2032
- Table 89: France Cancer Biomarkers Market Revenue (Million) Forecast, by Application 2019 & 2032
- Table 90: France Cancer Biomarkers Market Volume (K Unit) Forecast, by Application 2019 & 2032
- Table 91: Italy Cancer Biomarkers Market Revenue (Million) Forecast, by Application 2019 & 2032
- Table 92: Italy Cancer Biomarkers Market Volume (K Unit) Forecast, by Application 2019 & 2032
- Table 93: Spain Cancer Biomarkers Market Revenue (Million) Forecast, by Application 2019 & 2032
- Table 94: Spain Cancer Biomarkers Market Volume (K Unit) Forecast, by Application 2019 & 2032
- Table 95: Rest of Europe Cancer Biomarkers Market Revenue (Million) Forecast, by Application 2019 & 2032
- Table 96: Rest of Europe Cancer Biomarkers Market Volume (K Unit) Forecast, by Application 2019 & 2032
- Table 97: Global Cancer Biomarkers Market Revenue Million Forecast, by Disease 2019 & 2032
- Table 98: Global Cancer Biomarkers Market Volume K Unit Forecast, by Disease 2019 & 2032
- Table 99: Global Cancer Biomarkers Market Revenue Million Forecast, by Type 2019 & 2032
- Table 100: Global Cancer Biomarkers Market Volume K Unit Forecast, by Type 2019 & 2032
- Table 101: Global Cancer Biomarkers Market Revenue Million Forecast, by Profiling Technology 2019 & 2032
- Table 102: Global Cancer Biomarkers Market Volume K Unit Forecast, by Profiling Technology 2019 & 2032
- Table 103: Global Cancer Biomarkers Market Revenue Million Forecast, by Country 2019 & 2032
- Table 104: Global Cancer Biomarkers Market Volume K Unit Forecast, by Country 2019 & 2032
- Table 105: China Cancer Biomarkers Market Revenue (Million) Forecast, by Application 2019 & 2032
- Table 106: China Cancer Biomarkers Market Volume (K Unit) Forecast, by Application 2019 & 2032
- Table 107: Japan Cancer Biomarkers Market Revenue (Million) Forecast, by Application 2019 & 2032
- Table 108: Japan Cancer Biomarkers Market Volume (K Unit) Forecast, by Application 2019 & 2032
- Table 109: India Cancer Biomarkers Market Revenue (Million) Forecast, by Application 2019 & 2032
- Table 110: India Cancer Biomarkers Market Volume (K Unit) Forecast, by Application 2019 & 2032
- Table 111: Australia Cancer Biomarkers Market Revenue (Million) Forecast, by Application 2019 & 2032
- Table 112: Australia Cancer Biomarkers Market Volume (K Unit) Forecast, by Application 2019 & 2032
- Table 113: South Korea Cancer Biomarkers Market Revenue (Million) Forecast, by Application 2019 & 2032
- Table 114: South Korea Cancer Biomarkers Market Volume (K Unit) Forecast, by Application 2019 & 2032
- Table 115: Rest of Asia Pacific Cancer Biomarkers Market Revenue (Million) Forecast, by Application 2019 & 2032
- Table 116: Rest of Asia Pacific Cancer Biomarkers Market Volume (K Unit) Forecast, by Application 2019 & 2032
- Table 117: Global Cancer Biomarkers Market Revenue Million Forecast, by Disease 2019 & 2032
- Table 118: Global Cancer Biomarkers Market Volume K Unit Forecast, by Disease 2019 & 2032
- Table 119: Global Cancer Biomarkers Market Revenue Million Forecast, by Type 2019 & 2032
- Table 120: Global Cancer Biomarkers Market Volume K Unit Forecast, by Type 2019 & 2032
- Table 121: Global Cancer Biomarkers Market Revenue Million Forecast, by Profiling Technology 2019 & 2032
- Table 122: Global Cancer Biomarkers Market Volume K Unit Forecast, by Profiling Technology 2019 & 2032
- Table 123: Global Cancer Biomarkers Market Revenue Million Forecast, by Country 2019 & 2032
- Table 124: Global Cancer Biomarkers Market Volume K Unit Forecast, by Country 2019 & 2032
- Table 125: GCC Cancer Biomarkers Market Revenue (Million) Forecast, by Application 2019 & 2032
- Table 126: GCC Cancer Biomarkers Market Volume (K Unit) Forecast, by Application 2019 & 2032
- Table 127: South Africa Cancer Biomarkers Market Revenue (Million) Forecast, by Application 2019 & 2032
- Table 128: South Africa Cancer Biomarkers Market Volume (K Unit) Forecast, by Application 2019 & 2032
- Table 129: Rest of Middle East and Africa Cancer Biomarkers Market Revenue (Million) Forecast, by Application 2019 & 2032
- Table 130: Rest of Middle East and Africa Cancer Biomarkers Market Volume (K Unit) Forecast, by Application 2019 & 2032
- Table 131: Global Cancer Biomarkers Market Revenue Million Forecast, by Disease 2019 & 2032
- Table 132: Global Cancer Biomarkers Market Volume K Unit Forecast, by Disease 2019 & 2032
- Table 133: Global Cancer Biomarkers Market Revenue Million Forecast, by Type 2019 & 2032
- Table 134: Global Cancer Biomarkers Market Volume K Unit Forecast, by Type 2019 & 2032
- Table 135: Global Cancer Biomarkers Market Revenue Million Forecast, by Profiling Technology 2019 & 2032
- Table 136: Global Cancer Biomarkers Market Volume K Unit Forecast, by Profiling Technology 2019 & 2032
- Table 137: Global Cancer Biomarkers Market Revenue Million Forecast, by Country 2019 & 2032
- Table 138: Global Cancer Biomarkers Market Volume K Unit Forecast, by Country 2019 & 2032
- Table 139: Brazil Cancer Biomarkers Market Revenue (Million) Forecast, by Application 2019 & 2032
- Table 140: Brazil Cancer Biomarkers Market Volume (K Unit) Forecast, by Application 2019 & 2032
- Table 141: Argentina Cancer Biomarkers Market Revenue (Million) Forecast, by Application 2019 & 2032
- Table 142: Argentina Cancer Biomarkers Market Volume (K Unit) Forecast, by Application 2019 & 2032
- Table 143: Rest of South America Cancer Biomarkers Market Revenue (Million) Forecast, by Application 2019 & 2032
- Table 144: Rest of South America Cancer Biomarkers Market Volume (K Unit) Forecast, by Application 2019 & 2032
Frequently Asked Questions
1. What is the projected Compound Annual Growth Rate (CAGR) of the Cancer Biomarkers Market?
The projected CAGR is approximately 12.43%.
2. Which companies are prominent players in the Cancer Biomarkers Market?
Key companies in the market include Merck Millipore, Biomerieux, F Hoffmann-La Roche Ltd, Hologic Inc, Quest Diagnostics, Qiagen, Thermo Fisher Scientific, Illumina Inc, Abbott Laboratories Inc, Agilent Technologies.
3. What are the main segments of the Cancer Biomarkers Market?
The market segments include Disease, Type, Profiling Technology.
4. Can you provide details about the market size?
The market size is estimated to be USD 23.26 Million as of 2022.
5. What are some drivers contributing to market growth?
Surge in Prevalence of Cancer Across the Globe; Paradigm Shift in Healthcare from Disease Diagnosis to Risk Assessment or Early Diagnosis; Increasing Focus on Innovative Drug Development.
6. What are the notable trends driving market growth?
Lung Cancer Segment is Expected to Hold a Significant Market Share in the Cancer Biomarkers Market.
7. Are there any restraints impacting market growth?
High Cost of Cancer Diagnosis with Biomarkers; Reimbursement Issues with Biomarker Testing.
8. Can you provide examples of recent developments in the market?
February 2022: OncoDNA introduced the OncoDEEP Solid Tumor Biomarker Test Kit. The OncoDEEP kit, which includes Twist Bioscience's enrichment and library preparation solutions, will give labs a complete and reliable solution for performing comprehensive NGS analysis of tumor samples.
9. What pricing options are available for accessing the report?
Pricing options include single-user, multi-user, and enterprise licenses priced at USD 4750, USD 5250, and USD 8750 respectively.
10. Is the market size provided in terms of value or volume?
The market size is provided in terms of value, measured in Million and volume, measured in K Unit.
11. Are there any specific market keywords associated with the report?
Yes, the market keyword associated with the report is "Cancer Biomarkers Market," which aids in identifying and referencing the specific market segment covered.
12. How do I determine which pricing option suits my needs best?
The pricing options vary based on user requirements and access needs. Individual users may opt for single-user licenses, while businesses requiring broader access may choose multi-user or enterprise licenses for cost-effective access to the report.
13. Are there any additional resources or data provided in the Cancer Biomarkers Market report?
While the report offers comprehensive insights, it's advisable to review the specific contents or supplementary materials provided to ascertain if additional resources or data are available.
14. How can I stay updated on further developments or reports in the Cancer Biomarkers Market?
To stay informed about further developments, trends, and reports in the Cancer Biomarkers Market, consider subscribing to industry newsletters, following relevant companies and organizations, or regularly checking reputable industry news sources and publications.
Methodology
Step 1 - Identification of Relevant Samples Size from Population Database


Step 2 - Approaches for Defining Global Market Size (Value, Volume* & Price*)

Note*: In applicable scenarios
Step 3 - Data Sources
Primary Research
- Web Analytics
- Survey Reports
- Research Institute
- Latest Research Reports
- Opinion Leaders
Secondary Research
- Annual Reports
- White Paper
- Latest Press Release
- Industry Association
- Paid Database
- Investor Presentations

Step 4 - Data Triangulation
Involves using different sources of information in order to increase the validity of a study
These sources are likely to be stakeholders in a program - participants, other researchers, program staff, other community members, and so on.
Then we put all data in single framework & apply various statistical tools to find out the dynamic on the market.
During the analysis stage, feedback from the stakeholder groups would be compared to determine areas of agreement as well as areas of divergence
