

Key Insights
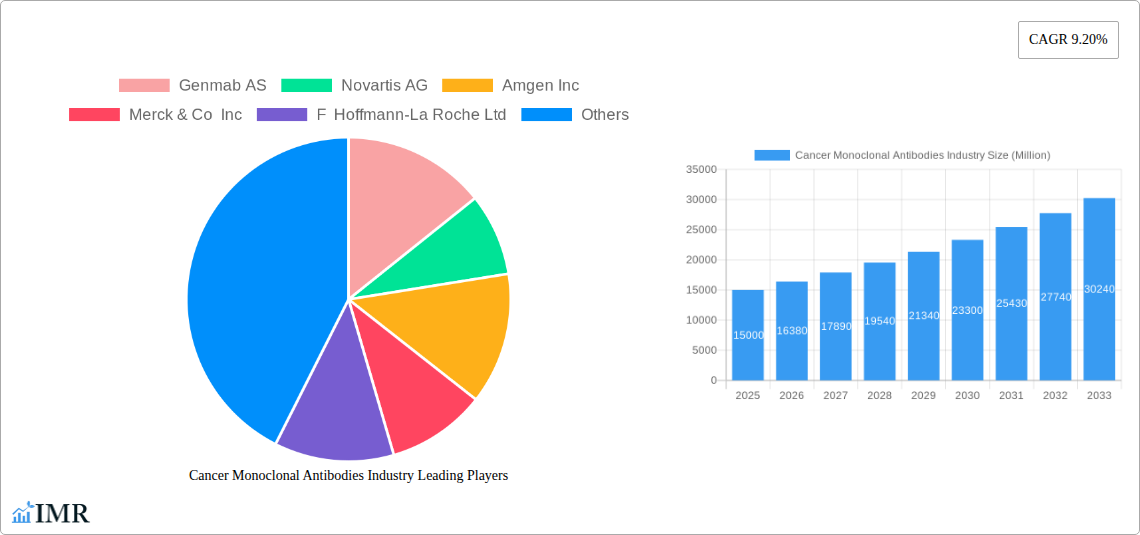
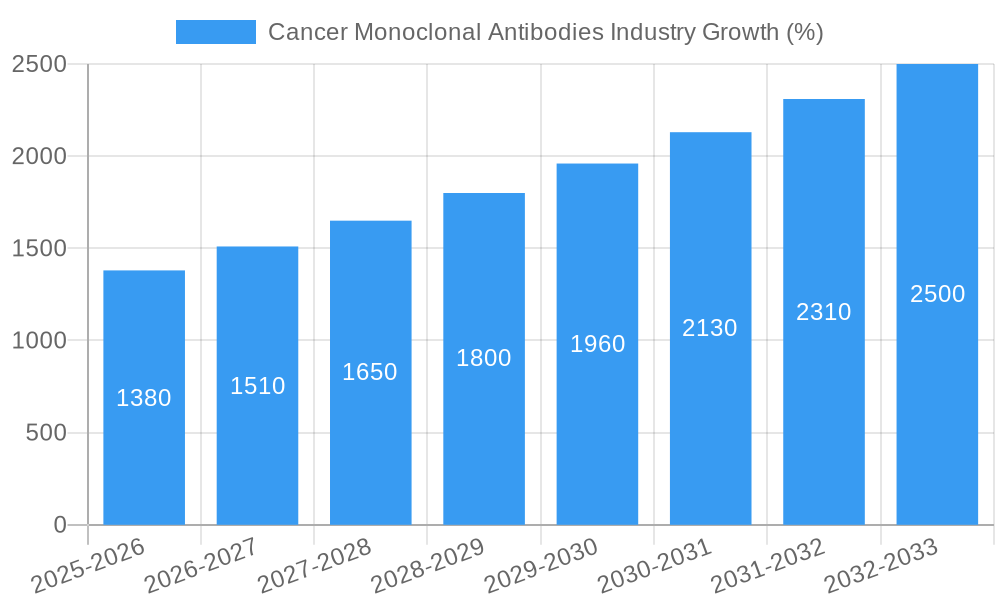
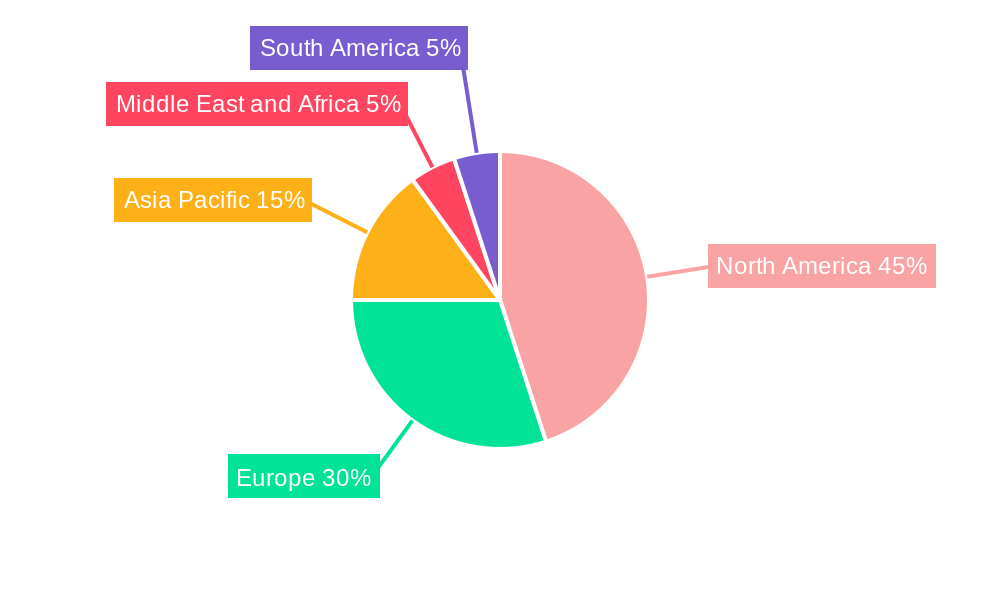
The global cancer monoclonal antibodies market is experiencing robust growth, projected to reach a substantial size by 2033, driven by a 9.20% CAGR. This expansion is fueled by several key factors. Firstly, the increasing prevalence of various cancers, particularly breast, blood, liver, brain, and colorectal cancers, creates a significant demand for effective treatment options. Monoclonal antibody therapies offer targeted and often less toxic alternatives to traditional cancer treatments like chemotherapy, contributing to their widespread adoption. Secondly, ongoing research and development are leading to the introduction of novel monoclonal antibodies with improved efficacy and reduced side effects, further stimulating market growth. The market is segmented by application (cancer type) and type of monoclonal antibody (murine, chimeric, humanized), with humanized antibodies expected to dominate due to their superior safety profile. Competition among major pharmaceutical companies like Genmab AS, Novartis AG, Amgen Inc., and Roche, is driving innovation and accessibility, resulting in a diverse range of therapies, including Bevacizumab, Rituximab, Trastuzumab, and others. Geographic distribution shows significant market share for North America and Europe, with Asia Pacific expected to exhibit strong growth in the coming years due to increasing healthcare expenditure and rising cancer incidence.
However, market growth is not without its challenges. High costs associated with the development, manufacturing, and administration of monoclonal antibody therapies represent a significant restraint, particularly in low- and middle-income countries. Additionally, the potential for adverse effects, although often less severe than traditional treatments, remains a concern requiring careful monitoring and management. Furthermore, the emergence of drug resistance and the complexity of treatment protocols for certain cancers pose challenges to the widespread implementation of these therapies. Nevertheless, ongoing technological advancements, innovative clinical trials, and a growing understanding of cancer biology are likely to mitigate these restraints and sustain market expansion throughout the forecast period. The focus on personalized medicine and the development of targeted therapies further enhance the long-term prospects of the cancer monoclonal antibodies market.
Cancer Monoclonal Antibodies Industry: A Comprehensive Market Report (2019-2033)
This comprehensive report provides a detailed analysis of the global Cancer Monoclonal Antibodies industry, encompassing market dynamics, growth trends, regional segmentation, product landscape, key players, and future outlook. The study period spans from 2019 to 2033, with a base year of 2025 and a forecast period from 2025 to 2033. The report utilizes data from 2019-2024 as historical data to inform projections. This report is crucial for investors, industry professionals, and researchers seeking a deep understanding of this rapidly evolving market.
Cancer Monoclonal Antibodies Industry Market Dynamics & Structure
The Cancer Monoclonal Antibodies market is characterized by high concentration among leading players, fierce competition, and continuous technological innovation. The market is driven by factors such as increasing cancer prevalence, growing demand for targeted therapies, and ongoing research and development efforts. Regulatory approvals and pricing strategies also play a significant role. Mergers and acquisitions (M&A) are frequent, reflecting consolidation within the industry.
- Market Concentration: The top 10 players (Genmab AS, Novartis AG, Amgen Inc, Merck & Co Inc, F Hoffmann-La Roche Ltd, Spectrum Pharmaceuticals Inc, Eli Lilly and Company, Bristol Myers Squibb Company, Johnson & Johnson, GlaxoSmithKline PLC) hold an estimated xx% market share in 2025.
- Technological Innovation: Continuous advancements in antibody engineering (e.g., bispecific antibodies, antibody-drug conjugates) are fueling market growth.
- Regulatory Framework: Stringent regulatory approvals and pricing policies influence market access and profitability.
- Competitive Landscape: Intense competition exists among established players and emerging biotech companies. The development of biosimilars also poses a challenge.
- M&A Activity: The sector witnesses significant M&A activity, with an estimated xx number of deals recorded between 2019 and 2024. This consolidates market share and accelerates product development.
- Innovation Barriers: High R&D costs, lengthy regulatory pathways, and challenges in clinical trials present significant barriers to innovation.
Cancer Monoclonal Antibodies Industry Growth Trends & Insights
The global cancer monoclonal antibodies market is experiencing substantial growth, driven by an aging population, increasing cancer incidence, and the rising adoption of targeted therapies. The market size is estimated to reach xx million units in 2025 and is projected to exhibit a Compound Annual Growth Rate (CAGR) of xx% during the forecast period (2025-2033). Increased market penetration of monoclonal antibody therapies across various cancer types contributes significantly to this growth. Technological advancements, such as the development of next-generation antibodies with enhanced efficacy and reduced side effects, are further accelerating market expansion. Changes in consumer preferences, with a growing demand for personalized medicine, are also shaping the industry landscape.
Dominant Regions, Countries, or Segments in Cancer Monoclonal Antibodies Industry
North America currently holds the largest market share due to factors such as high healthcare expenditure, strong regulatory support, and significant research and development activities. However, the Asia-Pacific region is expected to witness the fastest growth owing to increasing cancer prevalence, rising disposable incomes, and expanding healthcare infrastructure. Within the application segments, breast cancer and blood cancer represent significant portions of the market, driven by the availability of effective monoclonal antibody therapies. Humanized antibodies dominate the types of monoclonal antibodies segment due to their higher efficacy and lower immunogenicity compared to other types. Among monoclonal antibody therapies, Bevacizumab (Avastin), Rituximab (Rituxan), and Trastuzumab (Herceptin) are among the most widely used and commercially successful.
- Key Drivers:
- High healthcare expenditure in North America and Europe.
- Favorable regulatory landscape in developed countries.
- Increasing cancer prevalence globally.
- Growing awareness and adoption of targeted therapies.
- Dominance Factors:
- High market penetration in North America.
- Rapid growth potential in Asia-Pacific.
- High demand for specific applications (breast cancer, blood cancer).
Cancer Monoclonal Antibodies Industry Product Landscape
The Cancer Monoclonal Antibodies market offers a diverse range of products, including murine, chimeric, humanized, and fully human antibodies, each with unique properties. Innovative antibody-drug conjugates (ADCs) are gaining traction, combining the target specificity of antibodies with the cytotoxic effects of drugs. The market is witnessing the emergence of bispecific antibodies, which simultaneously target multiple antigens, potentially enhancing treatment efficacy. Performance metrics focus on response rates, overall survival, progression-free survival, and safety profiles. These products are marketed based on their superior efficacy, reduced side effects, and targeted action against specific cancer cells.
Key Drivers, Barriers & Challenges in Cancer Monoclonal Antibodies Industry
Key Drivers:
- Increasing prevalence of cancer globally.
- Growing demand for targeted therapies.
- Advancements in antibody engineering technology.
- Favorable regulatory environment in some regions.
Challenges & Restraints:
- High R&D costs and lengthy regulatory processes.
- Emergence of biosimilars increasing price competition.
- Potential side effects associated with some monoclonal antibodies.
- Complex supply chains and manufacturing challenges. Estimated xx% of production capacity is currently constrained.
Emerging Opportunities in Cancer Monoclonal Antibodies Industry
- Growing demand for personalized medicine.
- Development of novel antibody-based therapies (e.g., CAR T-cell therapy).
- Expansion into emerging markets with unmet medical needs.
- Development of more effective combination therapies.
Growth Accelerators in the Cancer Monoclonal Antibodies Industry
Technological advancements continue to drive long-term growth, particularly in antibody engineering. Strategic partnerships between pharmaceutical companies and biotechnology firms facilitate innovation and access to new technologies. The expansion of the global market into emerging economies presents significant growth opportunities.
Key Players Shaping the Cancer Monoclonal Antibodies Industry Market
- Genmab AS
- Novartis AG
- Amgen Inc
- Merck & Co Inc
- F Hoffmann-La Roche Ltd
- Spectrum Pharmaceuticals Inc
- Eli Lilly and Company
- Bristol Myers Squibb Company
- Johnson & Johnson
- GlaxoSmithKline PLC
Notable Milestones in Cancer Monoclonal Antibodies Industry Sector
- February 2022: Janssen Pharmaceutical Companies of Johnson & Johnson received FDA approval for CARVYKTI (ciltacabtagene autoleucel) for treating relapsed or refractory multiple myeloma.
- January 2022: Akeso received CDE approval in China to commence a Phase II clinical trial of ligufalimab (AK117) and ivonescimab (AK112) for first-line breast cancer.
In-Depth Cancer Monoclonal Antibodies Industry Market Outlook
The Cancer Monoclonal Antibodies market is poised for continued robust growth, driven by technological advancements, strategic collaborations, and expanding global demand. The development of next-generation antibodies with improved efficacy and safety profiles, combined with the increasing adoption of targeted therapies, will shape the market's future. Strategic partnerships and market expansion strategies in emerging markets will contribute to the long-term growth potential.
Cancer Monoclonal Antibodies Industry Segmentation
-
1. Types of Monoclonal Antibody
- 1.1. Murine Antibodies
- 1.2. Chimeric Antibodies
- 1.3. Humanized Antibodies
-
2. Monoclonal Antibody Therapies
- 2.1. Bevacizumab (Avastin)
- 2.2. Rituximab (Rituxan)
- 2.3. Trastuzumab (Herceptin)
- 2.4. Cetuximab (Erbitux)
- 2.5. Panitumumab (Vectibix)
- 2.6. Other Monoclonal Antibody Therapies
-
3. Application
- 3.1. Breast Cancer
- 3.2. Blood Cancer
- 3.3. Liver Cancer
- 3.4. Brain Cancer
- 3.5. Colorectal Cancer
- 3.6. Other Applications
Cancer Monoclonal Antibodies Industry Segmentation By Geography
-
1. North America
- 1.1. United States
- 1.2. Canada
- 1.3. Mexico
-
2. Europe
- 2.1. Germany
- 2.2. United Kingdom
- 2.3. France
- 2.4. Italy
- 2.5. Spain
- 2.6. Rest of Europe
-
3. Asia Pacific
- 3.1. China
- 3.2. Japan
- 3.3. India
- 3.4. Australia
- 3.5. South korea
- 3.6. Rest of Asia Pacific
-
4. Middle East and Africa
- 4.1. GCC
- 4.2. South Africa
- 4.3. Rest of Middle East and Africa
-
5. South America
- 5.1. Brazil
- 5.2. Argentina
- 5.3. Rest of South America
Cancer Monoclonal Antibodies Industry REPORT HIGHLIGHTS
| Aspects | Details |
|---|---|
| Study Period | 2019-2033 |
| Base Year | 2024 |
| Estimated Year | 2025 |
| Forecast Period | 2025-2033 |
| Historical Period | 2019-2024 |
| Growth Rate | CAGR of 9.20% from 2019-2033 |
| Segmentation |
|
Table of Contents
- 1. Introduction
- 1.1. Research Scope
- 1.2. Market Segmentation
- 1.3. Research Methodology
- 1.4. Definitions and Assumptions
- 2. Executive Summary
- 2.1. Introduction
- 3. Market Dynamics
- 3.1. Introduction
- 3.2. Market Drivers
- 3.2.1. Growing Prevalence of Cancer; Increasing Investment in Research and Development of Genomic Studies; Rising Advancements and Preference toward Specificity of Monoclonal Antibodies to Target Cancer
- 3.3. Market Restrains
- 3.3.1. Stringent Regulatory Guidelines; Long Duration of Research and Development with Rising Failures in Clinical Trials
- 3.4. Market Trends
- 3.4.1. Trastuzumab (Herceptin) is Expected to Hold Significant Market Share in Monoclonal Antibody Therapies
- 4. Market Factor Analysis
- 4.1. Porters Five Forces
- 4.2. Supply/Value Chain
- 4.3. PESTEL analysis
- 4.4. Market Entropy
- 4.5. Patent/Trademark Analysis
- 5. Cancer Monoclonal Antibodies Industry Analysis, Insights and Forecast, 2019-2031
- 5.1. Market Analysis, Insights and Forecast - by Types of Monoclonal Antibody
- 5.1.1. Murine Antibodies
- 5.1.2. Chimeric Antibodies
- 5.1.3. Humanized Antibodies
- 5.2. Market Analysis, Insights and Forecast - by Monoclonal Antibody Therapies
- 5.2.1. Bevacizumab (Avastin)
- 5.2.2. Rituximab (Rituxan)
- 5.2.3. Trastuzumab (Herceptin)
- 5.2.4. Cetuximab (Erbitux)
- 5.2.5. Panitumumab (Vectibix)
- 5.2.6. Other Monoclonal Antibody Therapies
- 5.3. Market Analysis, Insights and Forecast - by Application
- 5.3.1. Breast Cancer
- 5.3.2. Blood Cancer
- 5.3.3. Liver Cancer
- 5.3.4. Brain Cancer
- 5.3.5. Colorectal Cancer
- 5.3.6. Other Applications
- 5.4. Market Analysis, Insights and Forecast - by Region
- 5.4.1. North America
- 5.4.2. Europe
- 5.4.3. Asia Pacific
- 5.4.4. Middle East and Africa
- 5.4.5. South America
- 5.1. Market Analysis, Insights and Forecast - by Types of Monoclonal Antibody
- 6. North America Cancer Monoclonal Antibodies Industry Analysis, Insights and Forecast, 2019-2031
- 6.1. Market Analysis, Insights and Forecast - by Types of Monoclonal Antibody
- 6.1.1. Murine Antibodies
- 6.1.2. Chimeric Antibodies
- 6.1.3. Humanized Antibodies
- 6.2. Market Analysis, Insights and Forecast - by Monoclonal Antibody Therapies
- 6.2.1. Bevacizumab (Avastin)
- 6.2.2. Rituximab (Rituxan)
- 6.2.3. Trastuzumab (Herceptin)
- 6.2.4. Cetuximab (Erbitux)
- 6.2.5. Panitumumab (Vectibix)
- 6.2.6. Other Monoclonal Antibody Therapies
- 6.3. Market Analysis, Insights and Forecast - by Application
- 6.3.1. Breast Cancer
- 6.3.2. Blood Cancer
- 6.3.3. Liver Cancer
- 6.3.4. Brain Cancer
- 6.3.5. Colorectal Cancer
- 6.3.6. Other Applications
- 6.1. Market Analysis, Insights and Forecast - by Types of Monoclonal Antibody
- 7. Europe Cancer Monoclonal Antibodies Industry Analysis, Insights and Forecast, 2019-2031
- 7.1. Market Analysis, Insights and Forecast - by Types of Monoclonal Antibody
- 7.1.1. Murine Antibodies
- 7.1.2. Chimeric Antibodies
- 7.1.3. Humanized Antibodies
- 7.2. Market Analysis, Insights and Forecast - by Monoclonal Antibody Therapies
- 7.2.1. Bevacizumab (Avastin)
- 7.2.2. Rituximab (Rituxan)
- 7.2.3. Trastuzumab (Herceptin)
- 7.2.4. Cetuximab (Erbitux)
- 7.2.5. Panitumumab (Vectibix)
- 7.2.6. Other Monoclonal Antibody Therapies
- 7.3. Market Analysis, Insights and Forecast - by Application
- 7.3.1. Breast Cancer
- 7.3.2. Blood Cancer
- 7.3.3. Liver Cancer
- 7.3.4. Brain Cancer
- 7.3.5. Colorectal Cancer
- 7.3.6. Other Applications
- 7.1. Market Analysis, Insights and Forecast - by Types of Monoclonal Antibody
- 8. Asia Pacific Cancer Monoclonal Antibodies Industry Analysis, Insights and Forecast, 2019-2031
- 8.1. Market Analysis, Insights and Forecast - by Types of Monoclonal Antibody
- 8.1.1. Murine Antibodies
- 8.1.2. Chimeric Antibodies
- 8.1.3. Humanized Antibodies
- 8.2. Market Analysis, Insights and Forecast - by Monoclonal Antibody Therapies
- 8.2.1. Bevacizumab (Avastin)
- 8.2.2. Rituximab (Rituxan)
- 8.2.3. Trastuzumab (Herceptin)
- 8.2.4. Cetuximab (Erbitux)
- 8.2.5. Panitumumab (Vectibix)
- 8.2.6. Other Monoclonal Antibody Therapies
- 8.3. Market Analysis, Insights and Forecast - by Application
- 8.3.1. Breast Cancer
- 8.3.2. Blood Cancer
- 8.3.3. Liver Cancer
- 8.3.4. Brain Cancer
- 8.3.5. Colorectal Cancer
- 8.3.6. Other Applications
- 8.1. Market Analysis, Insights and Forecast - by Types of Monoclonal Antibody
- 9. Middle East and Africa Cancer Monoclonal Antibodies Industry Analysis, Insights and Forecast, 2019-2031
- 9.1. Market Analysis, Insights and Forecast - by Types of Monoclonal Antibody
- 9.1.1. Murine Antibodies
- 9.1.2. Chimeric Antibodies
- 9.1.3. Humanized Antibodies
- 9.2. Market Analysis, Insights and Forecast - by Monoclonal Antibody Therapies
- 9.2.1. Bevacizumab (Avastin)
- 9.2.2. Rituximab (Rituxan)
- 9.2.3. Trastuzumab (Herceptin)
- 9.2.4. Cetuximab (Erbitux)
- 9.2.5. Panitumumab (Vectibix)
- 9.2.6. Other Monoclonal Antibody Therapies
- 9.3. Market Analysis, Insights and Forecast - by Application
- 9.3.1. Breast Cancer
- 9.3.2. Blood Cancer
- 9.3.3. Liver Cancer
- 9.3.4. Brain Cancer
- 9.3.5. Colorectal Cancer
- 9.3.6. Other Applications
- 9.1. Market Analysis, Insights and Forecast - by Types of Monoclonal Antibody
- 10. South America Cancer Monoclonal Antibodies Industry Analysis, Insights and Forecast, 2019-2031
- 10.1. Market Analysis, Insights and Forecast - by Types of Monoclonal Antibody
- 10.1.1. Murine Antibodies
- 10.1.2. Chimeric Antibodies
- 10.1.3. Humanized Antibodies
- 10.2. Market Analysis, Insights and Forecast - by Monoclonal Antibody Therapies
- 10.2.1. Bevacizumab (Avastin)
- 10.2.2. Rituximab (Rituxan)
- 10.2.3. Trastuzumab (Herceptin)
- 10.2.4. Cetuximab (Erbitux)
- 10.2.5. Panitumumab (Vectibix)
- 10.2.6. Other Monoclonal Antibody Therapies
- 10.3. Market Analysis, Insights and Forecast - by Application
- 10.3.1. Breast Cancer
- 10.3.2. Blood Cancer
- 10.3.3. Liver Cancer
- 10.3.4. Brain Cancer
- 10.3.5. Colorectal Cancer
- 10.3.6. Other Applications
- 10.1. Market Analysis, Insights and Forecast - by Types of Monoclonal Antibody
- 11. North America Cancer Monoclonal Antibodies Industry Analysis, Insights and Forecast, 2019-2031
- 11.1. Market Analysis, Insights and Forecast - By Country/Sub-region
- 11.1.1 United States
- 11.1.2 Canada
- 11.1.3 Mexico
- 12. Europe Cancer Monoclonal Antibodies Industry Analysis, Insights and Forecast, 2019-2031
- 12.1. Market Analysis, Insights and Forecast - By Country/Sub-region
- 12.1.1 Germany
- 12.1.2 United Kingdom
- 12.1.3 France
- 12.1.4 Italy
- 12.1.5 Spain
- 12.1.6 Rest of Europe
- 13. Asia Pacific Cancer Monoclonal Antibodies Industry Analysis, Insights and Forecast, 2019-2031
- 13.1. Market Analysis, Insights and Forecast - By Country/Sub-region
- 13.1.1 China
- 13.1.2 Japan
- 13.1.3 India
- 13.1.4 Australia
- 13.1.5 South korea
- 13.1.6 Rest of Asia Pacific
- 14. Middle East and Africa Cancer Monoclonal Antibodies Industry Analysis, Insights and Forecast, 2019-2031
- 14.1. Market Analysis, Insights and Forecast - By Country/Sub-region
- 14.1.1 GCC
- 14.1.2 South Africa
- 14.1.3 Rest of Middle East and Africa
- 15. South America Cancer Monoclonal Antibodies Industry Analysis, Insights and Forecast, 2019-2031
- 15.1. Market Analysis, Insights and Forecast - By Country/Sub-region
- 15.1.1 Brazil
- 15.1.2 Argentina
- 15.1.3 Rest of South America
- 16. Competitive Analysis
- 16.1. Market Share Analysis 2024
- 16.2. Company Profiles
- 16.2.1 Genmab AS
- 16.2.1.1. Overview
- 16.2.1.2. Products
- 16.2.1.3. SWOT Analysis
- 16.2.1.4. Recent Developments
- 16.2.1.5. Financials (Based on Availability)
- 16.2.2 Novartis AG
- 16.2.2.1. Overview
- 16.2.2.2. Products
- 16.2.2.3. SWOT Analysis
- 16.2.2.4. Recent Developments
- 16.2.2.5. Financials (Based on Availability)
- 16.2.3 Amgen Inc
- 16.2.3.1. Overview
- 16.2.3.2. Products
- 16.2.3.3. SWOT Analysis
- 16.2.3.4. Recent Developments
- 16.2.3.5. Financials (Based on Availability)
- 16.2.4 Merck & Co Inc
- 16.2.4.1. Overview
- 16.2.4.2. Products
- 16.2.4.3. SWOT Analysis
- 16.2.4.4. Recent Developments
- 16.2.4.5. Financials (Based on Availability)
- 16.2.5 F Hoffmann-La Roche Ltd
- 16.2.5.1. Overview
- 16.2.5.2. Products
- 16.2.5.3. SWOT Analysis
- 16.2.5.4. Recent Developments
- 16.2.5.5. Financials (Based on Availability)
- 16.2.6 Spectrum Pharmaceuticals Inc
- 16.2.6.1. Overview
- 16.2.6.2. Products
- 16.2.6.3. SWOT Analysis
- 16.2.6.4. Recent Developments
- 16.2.6.5. Financials (Based on Availability)
- 16.2.7 Eli Lilly and Company
- 16.2.7.1. Overview
- 16.2.7.2. Products
- 16.2.7.3. SWOT Analysis
- 16.2.7.4. Recent Developments
- 16.2.7.5. Financials (Based on Availability)
- 16.2.8 Bristol Myers Squibb Company
- 16.2.8.1. Overview
- 16.2.8.2. Products
- 16.2.8.3. SWOT Analysis
- 16.2.8.4. Recent Developments
- 16.2.8.5. Financials (Based on Availability)
- 16.2.9 Johnson & Johnson
- 16.2.9.1. Overview
- 16.2.9.2. Products
- 16.2.9.3. SWOT Analysis
- 16.2.9.4. Recent Developments
- 16.2.9.5. Financials (Based on Availability)
- 16.2.10 GlaxoSmithKline PLC
- 16.2.10.1. Overview
- 16.2.10.2. Products
- 16.2.10.3. SWOT Analysis
- 16.2.10.4. Recent Developments
- 16.2.10.5. Financials (Based on Availability)
- 16.2.1 Genmab AS
List of Figures
- Figure 1: Cancer Monoclonal Antibodies Industry Revenue Breakdown (Million, %) by Product 2024 & 2032
- Figure 2: Cancer Monoclonal Antibodies Industry Share (%) by Company 2024
List of Tables
- Table 1: Cancer Monoclonal Antibodies Industry Revenue Million Forecast, by Region 2019 & 2032
- Table 2: Cancer Monoclonal Antibodies Industry Volume K Unit Forecast, by Region 2019 & 2032
- Table 3: Cancer Monoclonal Antibodies Industry Revenue Million Forecast, by Types of Monoclonal Antibody 2019 & 2032
- Table 4: Cancer Monoclonal Antibodies Industry Volume K Unit Forecast, by Types of Monoclonal Antibody 2019 & 2032
- Table 5: Cancer Monoclonal Antibodies Industry Revenue Million Forecast, by Monoclonal Antibody Therapies 2019 & 2032
- Table 6: Cancer Monoclonal Antibodies Industry Volume K Unit Forecast, by Monoclonal Antibody Therapies 2019 & 2032
- Table 7: Cancer Monoclonal Antibodies Industry Revenue Million Forecast, by Application 2019 & 2032
- Table 8: Cancer Monoclonal Antibodies Industry Volume K Unit Forecast, by Application 2019 & 2032
- Table 9: Cancer Monoclonal Antibodies Industry Revenue Million Forecast, by Region 2019 & 2032
- Table 10: Cancer Monoclonal Antibodies Industry Volume K Unit Forecast, by Region 2019 & 2032
- Table 11: Cancer Monoclonal Antibodies Industry Revenue Million Forecast, by Country 2019 & 2032
- Table 12: Cancer Monoclonal Antibodies Industry Volume K Unit Forecast, by Country 2019 & 2032
- Table 13: United States Cancer Monoclonal Antibodies Industry Revenue (Million) Forecast, by Application 2019 & 2032
- Table 14: United States Cancer Monoclonal Antibodies Industry Volume (K Unit) Forecast, by Application 2019 & 2032
- Table 15: Canada Cancer Monoclonal Antibodies Industry Revenue (Million) Forecast, by Application 2019 & 2032
- Table 16: Canada Cancer Monoclonal Antibodies Industry Volume (K Unit) Forecast, by Application 2019 & 2032
- Table 17: Mexico Cancer Monoclonal Antibodies Industry Revenue (Million) Forecast, by Application 2019 & 2032
- Table 18: Mexico Cancer Monoclonal Antibodies Industry Volume (K Unit) Forecast, by Application 2019 & 2032
- Table 19: Cancer Monoclonal Antibodies Industry Revenue Million Forecast, by Country 2019 & 2032
- Table 20: Cancer Monoclonal Antibodies Industry Volume K Unit Forecast, by Country 2019 & 2032
- Table 21: Germany Cancer Monoclonal Antibodies Industry Revenue (Million) Forecast, by Application 2019 & 2032
- Table 22: Germany Cancer Monoclonal Antibodies Industry Volume (K Unit) Forecast, by Application 2019 & 2032
- Table 23: United Kingdom Cancer Monoclonal Antibodies Industry Revenue (Million) Forecast, by Application 2019 & 2032
- Table 24: United Kingdom Cancer Monoclonal Antibodies Industry Volume (K Unit) Forecast, by Application 2019 & 2032
- Table 25: France Cancer Monoclonal Antibodies Industry Revenue (Million) Forecast, by Application 2019 & 2032
- Table 26: France Cancer Monoclonal Antibodies Industry Volume (K Unit) Forecast, by Application 2019 & 2032
- Table 27: Italy Cancer Monoclonal Antibodies Industry Revenue (Million) Forecast, by Application 2019 & 2032
- Table 28: Italy Cancer Monoclonal Antibodies Industry Volume (K Unit) Forecast, by Application 2019 & 2032
- Table 29: Spain Cancer Monoclonal Antibodies Industry Revenue (Million) Forecast, by Application 2019 & 2032
- Table 30: Spain Cancer Monoclonal Antibodies Industry Volume (K Unit) Forecast, by Application 2019 & 2032
- Table 31: Rest of Europe Cancer Monoclonal Antibodies Industry Revenue (Million) Forecast, by Application 2019 & 2032
- Table 32: Rest of Europe Cancer Monoclonal Antibodies Industry Volume (K Unit) Forecast, by Application 2019 & 2032
- Table 33: Cancer Monoclonal Antibodies Industry Revenue Million Forecast, by Country 2019 & 2032
- Table 34: Cancer Monoclonal Antibodies Industry Volume K Unit Forecast, by Country 2019 & 2032
- Table 35: China Cancer Monoclonal Antibodies Industry Revenue (Million) Forecast, by Application 2019 & 2032
- Table 36: China Cancer Monoclonal Antibodies Industry Volume (K Unit) Forecast, by Application 2019 & 2032
- Table 37: Japan Cancer Monoclonal Antibodies Industry Revenue (Million) Forecast, by Application 2019 & 2032
- Table 38: Japan Cancer Monoclonal Antibodies Industry Volume (K Unit) Forecast, by Application 2019 & 2032
- Table 39: India Cancer Monoclonal Antibodies Industry Revenue (Million) Forecast, by Application 2019 & 2032
- Table 40: India Cancer Monoclonal Antibodies Industry Volume (K Unit) Forecast, by Application 2019 & 2032
- Table 41: Australia Cancer Monoclonal Antibodies Industry Revenue (Million) Forecast, by Application 2019 & 2032
- Table 42: Australia Cancer Monoclonal Antibodies Industry Volume (K Unit) Forecast, by Application 2019 & 2032
- Table 43: South korea Cancer Monoclonal Antibodies Industry Revenue (Million) Forecast, by Application 2019 & 2032
- Table 44: South korea Cancer Monoclonal Antibodies Industry Volume (K Unit) Forecast, by Application 2019 & 2032
- Table 45: Rest of Asia Pacific Cancer Monoclonal Antibodies Industry Revenue (Million) Forecast, by Application 2019 & 2032
- Table 46: Rest of Asia Pacific Cancer Monoclonal Antibodies Industry Volume (K Unit) Forecast, by Application 2019 & 2032
- Table 47: Cancer Monoclonal Antibodies Industry Revenue Million Forecast, by Country 2019 & 2032
- Table 48: Cancer Monoclonal Antibodies Industry Volume K Unit Forecast, by Country 2019 & 2032
- Table 49: GCC Cancer Monoclonal Antibodies Industry Revenue (Million) Forecast, by Application 2019 & 2032
- Table 50: GCC Cancer Monoclonal Antibodies Industry Volume (K Unit) Forecast, by Application 2019 & 2032
- Table 51: South Africa Cancer Monoclonal Antibodies Industry Revenue (Million) Forecast, by Application 2019 & 2032
- Table 52: South Africa Cancer Monoclonal Antibodies Industry Volume (K Unit) Forecast, by Application 2019 & 2032
- Table 53: Rest of Middle East and Africa Cancer Monoclonal Antibodies Industry Revenue (Million) Forecast, by Application 2019 & 2032
- Table 54: Rest of Middle East and Africa Cancer Monoclonal Antibodies Industry Volume (K Unit) Forecast, by Application 2019 & 2032
- Table 55: Cancer Monoclonal Antibodies Industry Revenue Million Forecast, by Country 2019 & 2032
- Table 56: Cancer Monoclonal Antibodies Industry Volume K Unit Forecast, by Country 2019 & 2032
- Table 57: Brazil Cancer Monoclonal Antibodies Industry Revenue (Million) Forecast, by Application 2019 & 2032
- Table 58: Brazil Cancer Monoclonal Antibodies Industry Volume (K Unit) Forecast, by Application 2019 & 2032
- Table 59: Argentina Cancer Monoclonal Antibodies Industry Revenue (Million) Forecast, by Application 2019 & 2032
- Table 60: Argentina Cancer Monoclonal Antibodies Industry Volume (K Unit) Forecast, by Application 2019 & 2032
- Table 61: Rest of South America Cancer Monoclonal Antibodies Industry Revenue (Million) Forecast, by Application 2019 & 2032
- Table 62: Rest of South America Cancer Monoclonal Antibodies Industry Volume (K Unit) Forecast, by Application 2019 & 2032
- Table 63: Cancer Monoclonal Antibodies Industry Revenue Million Forecast, by Types of Monoclonal Antibody 2019 & 2032
- Table 64: Cancer Monoclonal Antibodies Industry Volume K Unit Forecast, by Types of Monoclonal Antibody 2019 & 2032
- Table 65: Cancer Monoclonal Antibodies Industry Revenue Million Forecast, by Monoclonal Antibody Therapies 2019 & 2032
- Table 66: Cancer Monoclonal Antibodies Industry Volume K Unit Forecast, by Monoclonal Antibody Therapies 2019 & 2032
- Table 67: Cancer Monoclonal Antibodies Industry Revenue Million Forecast, by Application 2019 & 2032
- Table 68: Cancer Monoclonal Antibodies Industry Volume K Unit Forecast, by Application 2019 & 2032
- Table 69: Cancer Monoclonal Antibodies Industry Revenue Million Forecast, by Country 2019 & 2032
- Table 70: Cancer Monoclonal Antibodies Industry Volume K Unit Forecast, by Country 2019 & 2032
- Table 71: United States Cancer Monoclonal Antibodies Industry Revenue (Million) Forecast, by Application 2019 & 2032
- Table 72: United States Cancer Monoclonal Antibodies Industry Volume (K Unit) Forecast, by Application 2019 & 2032
- Table 73: Canada Cancer Monoclonal Antibodies Industry Revenue (Million) Forecast, by Application 2019 & 2032
- Table 74: Canada Cancer Monoclonal Antibodies Industry Volume (K Unit) Forecast, by Application 2019 & 2032
- Table 75: Mexico Cancer Monoclonal Antibodies Industry Revenue (Million) Forecast, by Application 2019 & 2032
- Table 76: Mexico Cancer Monoclonal Antibodies Industry Volume (K Unit) Forecast, by Application 2019 & 2032
- Table 77: Cancer Monoclonal Antibodies Industry Revenue Million Forecast, by Types of Monoclonal Antibody 2019 & 2032
- Table 78: Cancer Monoclonal Antibodies Industry Volume K Unit Forecast, by Types of Monoclonal Antibody 2019 & 2032
- Table 79: Cancer Monoclonal Antibodies Industry Revenue Million Forecast, by Monoclonal Antibody Therapies 2019 & 2032
- Table 80: Cancer Monoclonal Antibodies Industry Volume K Unit Forecast, by Monoclonal Antibody Therapies 2019 & 2032
- Table 81: Cancer Monoclonal Antibodies Industry Revenue Million Forecast, by Application 2019 & 2032
- Table 82: Cancer Monoclonal Antibodies Industry Volume K Unit Forecast, by Application 2019 & 2032
- Table 83: Cancer Monoclonal Antibodies Industry Revenue Million Forecast, by Country 2019 & 2032
- Table 84: Cancer Monoclonal Antibodies Industry Volume K Unit Forecast, by Country 2019 & 2032
- Table 85: Germany Cancer Monoclonal Antibodies Industry Revenue (Million) Forecast, by Application 2019 & 2032
- Table 86: Germany Cancer Monoclonal Antibodies Industry Volume (K Unit) Forecast, by Application 2019 & 2032
- Table 87: United Kingdom Cancer Monoclonal Antibodies Industry Revenue (Million) Forecast, by Application 2019 & 2032
- Table 88: United Kingdom Cancer Monoclonal Antibodies Industry Volume (K Unit) Forecast, by Application 2019 & 2032
- Table 89: France Cancer Monoclonal Antibodies Industry Revenue (Million) Forecast, by Application 2019 & 2032
- Table 90: France Cancer Monoclonal Antibodies Industry Volume (K Unit) Forecast, by Application 2019 & 2032
- Table 91: Italy Cancer Monoclonal Antibodies Industry Revenue (Million) Forecast, by Application 2019 & 2032
- Table 92: Italy Cancer Monoclonal Antibodies Industry Volume (K Unit) Forecast, by Application 2019 & 2032
- Table 93: Spain Cancer Monoclonal Antibodies Industry Revenue (Million) Forecast, by Application 2019 & 2032
- Table 94: Spain Cancer Monoclonal Antibodies Industry Volume (K Unit) Forecast, by Application 2019 & 2032
- Table 95: Rest of Europe Cancer Monoclonal Antibodies Industry Revenue (Million) Forecast, by Application 2019 & 2032
- Table 96: Rest of Europe Cancer Monoclonal Antibodies Industry Volume (K Unit) Forecast, by Application 2019 & 2032
- Table 97: Cancer Monoclonal Antibodies Industry Revenue Million Forecast, by Types of Monoclonal Antibody 2019 & 2032
- Table 98: Cancer Monoclonal Antibodies Industry Volume K Unit Forecast, by Types of Monoclonal Antibody 2019 & 2032
- Table 99: Cancer Monoclonal Antibodies Industry Revenue Million Forecast, by Monoclonal Antibody Therapies 2019 & 2032
- Table 100: Cancer Monoclonal Antibodies Industry Volume K Unit Forecast, by Monoclonal Antibody Therapies 2019 & 2032
- Table 101: Cancer Monoclonal Antibodies Industry Revenue Million Forecast, by Application 2019 & 2032
- Table 102: Cancer Monoclonal Antibodies Industry Volume K Unit Forecast, by Application 2019 & 2032
- Table 103: Cancer Monoclonal Antibodies Industry Revenue Million Forecast, by Country 2019 & 2032
- Table 104: Cancer Monoclonal Antibodies Industry Volume K Unit Forecast, by Country 2019 & 2032
- Table 105: China Cancer Monoclonal Antibodies Industry Revenue (Million) Forecast, by Application 2019 & 2032
- Table 106: China Cancer Monoclonal Antibodies Industry Volume (K Unit) Forecast, by Application 2019 & 2032
- Table 107: Japan Cancer Monoclonal Antibodies Industry Revenue (Million) Forecast, by Application 2019 & 2032
- Table 108: Japan Cancer Monoclonal Antibodies Industry Volume (K Unit) Forecast, by Application 2019 & 2032
- Table 109: India Cancer Monoclonal Antibodies Industry Revenue (Million) Forecast, by Application 2019 & 2032
- Table 110: India Cancer Monoclonal Antibodies Industry Volume (K Unit) Forecast, by Application 2019 & 2032
- Table 111: Australia Cancer Monoclonal Antibodies Industry Revenue (Million) Forecast, by Application 2019 & 2032
- Table 112: Australia Cancer Monoclonal Antibodies Industry Volume (K Unit) Forecast, by Application 2019 & 2032
- Table 113: South korea Cancer Monoclonal Antibodies Industry Revenue (Million) Forecast, by Application 2019 & 2032
- Table 114: South korea Cancer Monoclonal Antibodies Industry Volume (K Unit) Forecast, by Application 2019 & 2032
- Table 115: Rest of Asia Pacific Cancer Monoclonal Antibodies Industry Revenue (Million) Forecast, by Application 2019 & 2032
- Table 116: Rest of Asia Pacific Cancer Monoclonal Antibodies Industry Volume (K Unit) Forecast, by Application 2019 & 2032
- Table 117: Cancer Monoclonal Antibodies Industry Revenue Million Forecast, by Types of Monoclonal Antibody 2019 & 2032
- Table 118: Cancer Monoclonal Antibodies Industry Volume K Unit Forecast, by Types of Monoclonal Antibody 2019 & 2032
- Table 119: Cancer Monoclonal Antibodies Industry Revenue Million Forecast, by Monoclonal Antibody Therapies 2019 & 2032
- Table 120: Cancer Monoclonal Antibodies Industry Volume K Unit Forecast, by Monoclonal Antibody Therapies 2019 & 2032
- Table 121: Cancer Monoclonal Antibodies Industry Revenue Million Forecast, by Application 2019 & 2032
- Table 122: Cancer Monoclonal Antibodies Industry Volume K Unit Forecast, by Application 2019 & 2032
- Table 123: Cancer Monoclonal Antibodies Industry Revenue Million Forecast, by Country 2019 & 2032
- Table 124: Cancer Monoclonal Antibodies Industry Volume K Unit Forecast, by Country 2019 & 2032
- Table 125: GCC Cancer Monoclonal Antibodies Industry Revenue (Million) Forecast, by Application 2019 & 2032
- Table 126: GCC Cancer Monoclonal Antibodies Industry Volume (K Unit) Forecast, by Application 2019 & 2032
- Table 127: South Africa Cancer Monoclonal Antibodies Industry Revenue (Million) Forecast, by Application 2019 & 2032
- Table 128: South Africa Cancer Monoclonal Antibodies Industry Volume (K Unit) Forecast, by Application 2019 & 2032
- Table 129: Rest of Middle East and Africa Cancer Monoclonal Antibodies Industry Revenue (Million) Forecast, by Application 2019 & 2032
- Table 130: Rest of Middle East and Africa Cancer Monoclonal Antibodies Industry Volume (K Unit) Forecast, by Application 2019 & 2032
- Table 131: Cancer Monoclonal Antibodies Industry Revenue Million Forecast, by Types of Monoclonal Antibody 2019 & 2032
- Table 132: Cancer Monoclonal Antibodies Industry Volume K Unit Forecast, by Types of Monoclonal Antibody 2019 & 2032
- Table 133: Cancer Monoclonal Antibodies Industry Revenue Million Forecast, by Monoclonal Antibody Therapies 2019 & 2032
- Table 134: Cancer Monoclonal Antibodies Industry Volume K Unit Forecast, by Monoclonal Antibody Therapies 2019 & 2032
- Table 135: Cancer Monoclonal Antibodies Industry Revenue Million Forecast, by Application 2019 & 2032
- Table 136: Cancer Monoclonal Antibodies Industry Volume K Unit Forecast, by Application 2019 & 2032
- Table 137: Cancer Monoclonal Antibodies Industry Revenue Million Forecast, by Country 2019 & 2032
- Table 138: Cancer Monoclonal Antibodies Industry Volume K Unit Forecast, by Country 2019 & 2032
- Table 139: Brazil Cancer Monoclonal Antibodies Industry Revenue (Million) Forecast, by Application 2019 & 2032
- Table 140: Brazil Cancer Monoclonal Antibodies Industry Volume (K Unit) Forecast, by Application 2019 & 2032
- Table 141: Argentina Cancer Monoclonal Antibodies Industry Revenue (Million) Forecast, by Application 2019 & 2032
- Table 142: Argentina Cancer Monoclonal Antibodies Industry Volume (K Unit) Forecast, by Application 2019 & 2032
- Table 143: Rest of South America Cancer Monoclonal Antibodies Industry Revenue (Million) Forecast, by Application 2019 & 2032
- Table 144: Rest of South America Cancer Monoclonal Antibodies Industry Volume (K Unit) Forecast, by Application 2019 & 2032
Frequently Asked Questions
1. What is the projected Compound Annual Growth Rate (CAGR) of the Cancer Monoclonal Antibodies Industry?
The projected CAGR is approximately 9.20%.
2. Which companies are prominent players in the Cancer Monoclonal Antibodies Industry?
Key companies in the market include Genmab AS, Novartis AG, Amgen Inc, Merck & Co Inc, F Hoffmann-La Roche Ltd, Spectrum Pharmaceuticals Inc , Eli Lilly and Company, Bristol Myers Squibb Company, Johnson & Johnson, GlaxoSmithKline PLC.
3. What are the main segments of the Cancer Monoclonal Antibodies Industry?
The market segments include Types of Monoclonal Antibody, Monoclonal Antibody Therapies, Application.
4. Can you provide details about the market size?
The market size is estimated to be USD XX Million as of 2022.
5. What are some drivers contributing to market growth?
Growing Prevalence of Cancer; Increasing Investment in Research and Development of Genomic Studies; Rising Advancements and Preference toward Specificity of Monoclonal Antibodies to Target Cancer.
6. What are the notable trends driving market growth?
Trastuzumab (Herceptin) is Expected to Hold Significant Market Share in Monoclonal Antibody Therapies.
7. Are there any restraints impacting market growth?
Stringent Regulatory Guidelines; Long Duration of Research and Development with Rising Failures in Clinical Trials.
8. Can you provide examples of recent developments in the market?
In February 2022, the Janssen Pharmaceutical Companies of Johnson & Johnson received United States Food and Drug Administration (FDA) approval for CARVYKTI (ciltacabtagene autoleucel; cilta-cel) for the treatment of adults with relapsed or refractory multiple myeloma (RRMM) after four or more prior lines of therapy, including a proteasome inhibitor, an immunomodulatory agent, and an anti-CD38 monoclonal antibody.
9. What pricing options are available for accessing the report?
Pricing options include single-user, multi-user, and enterprise licenses priced at USD 3800, USD 4500, and USD 5800 respectively.
10. Is the market size provided in terms of value or volume?
The market size is provided in terms of value, measured in Million and volume, measured in K Unit.
11. Are there any specific market keywords associated with the report?
Yes, the market keyword associated with the report is "Cancer Monoclonal Antibodies Industry," which aids in identifying and referencing the specific market segment covered.
12. How do I determine which pricing option suits my needs best?
The pricing options vary based on user requirements and access needs. Individual users may opt for single-user licenses, while businesses requiring broader access may choose multi-user or enterprise licenses for cost-effective access to the report.
13. Are there any additional resources or data provided in the Cancer Monoclonal Antibodies Industry report?
While the report offers comprehensive insights, it's advisable to review the specific contents or supplementary materials provided to ascertain if additional resources or data are available.
14. How can I stay updated on further developments or reports in the Cancer Monoclonal Antibodies Industry?
To stay informed about further developments, trends, and reports in the Cancer Monoclonal Antibodies Industry, consider subscribing to industry newsletters, following relevant companies and organizations, or regularly checking reputable industry news sources and publications.
Methodology
Step 1 - Identification of Relevant Samples Size from Population Database


Step 2 - Approaches for Defining Global Market Size (Value, Volume* & Price*)

Note*: In applicable scenarios
Step 3 - Data Sources
Primary Research
- Web Analytics
- Survey Reports
- Research Institute
- Latest Research Reports
- Opinion Leaders
Secondary Research
- Annual Reports
- White Paper
- Latest Press Release
- Industry Association
- Paid Database
- Investor Presentations

Step 4 - Data Triangulation
Involves using different sources of information in order to increase the validity of a study
These sources are likely to be stakeholders in a program - participants, other researchers, program staff, other community members, and so on.
Then we put all data in single framework & apply various statistical tools to find out the dynamic on the market.
During the analysis stage, feedback from the stakeholder groups would be compared to determine areas of agreement as well as areas of divergence
